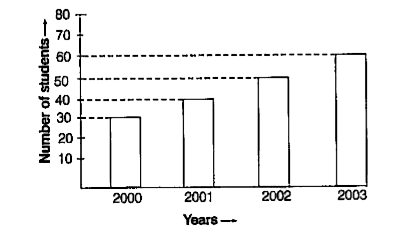
Read the adjoining bar graph showing the number ofstudents in a particular class of a school. Answer thefollowing questions :(a) What is the scale of this graph?(b) How many new students are added every year?(c) Is the number of students in the year 2003 twice that in the year 2000?
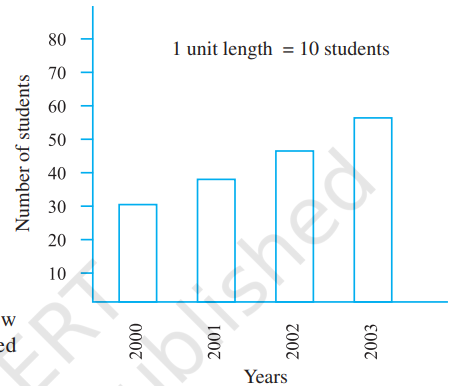
(a) The scale is 1 unit length equals 10 students.
(b)100 new students are added every new year
.(c) number of students in 2000=10×30
number of students in 2003=60×10
number of students in 2003 is twice the number of students in 2000
Topper's Solved these Questions
- DATA HANDLINGBOOK - NCERTCHAPTER - DATA HANDLINGEXERCISE - EXERCISE 9.3
3 Videos
- DATA HANDLINGBOOK - NCERTCHAPTER - DATA HANDLINGEXERCISE - EXERCISE 9.4
4 Videos
- DATA HANDLINGBOOK - NCERTCHAPTER - DATA HANDLINGEXERCISE - EXERCISE 9.1
7 Videos
- BASIC GEOMETRICAL IDEASBOOK - NCERTCHAPTER - BASIC GEOMETRICAL IDEASEXERCISE - EXERCISE 4.6
4 Videos
- DECIMALSBOOK - NCERTCHAPTER - DECIMALSEXERCISE - EXERCISE 8.1
10 Videos
Similar Questions
Read the adjoining bar graph showing the number ofstudents in a particular class of a school. Answer thefollowing questions :(a) What is the scale of this graph?(b) How many new students are added every year?(c) Is the number of students in the year 2003 twice that in the year 2000?

View SolutionThe following bar graph shows the number of students in a particular class of school. Then, answer the following questions.
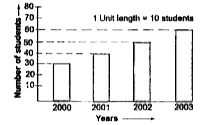
What is the number of students in the year 2003?
View Solution
Knowledge Check
The following bar graph shows the number of students in a particular class of school. Then, answer the following questions.
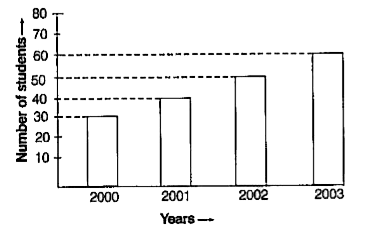
What is the number of students in the year 2003?A10B25C45D60The following bar graph shows the number of students in a particular class of school. Then, answer the following questions.
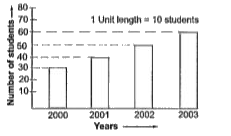
(i) What is the nuber of students in the year 2003 ?A70B60C50D40The following bar graph shows the number of students in a particular class of school. Then, answer the following questions.
Is the number of students in the year 2002 is twice that in the year 2000?AYesBNoCCannot sayDNone of these
The following bar graph shows the number of students in different classes of a school.
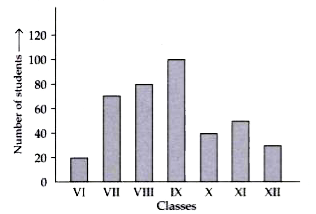
How many more students are there in Class IX than in Class VIII ?
View SolutionThe given bar graph, shows the number of students in different classes.
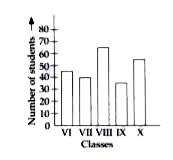
How many more students are there in class VIII than in class IX?
View SolutionThe given bar graph, shows the number of students in different classes.
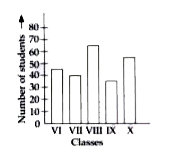
Find the total number of students in the classes VIII to X.
View SolutionThe bar graph given below shows the marks of students of a class in a particular subject:
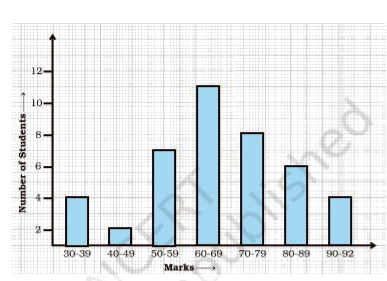
Study the bar graph and answer the following questions:
(a) If 40 is the pass mark, then how many students have failed?
(b) How many students got marks from 50 to 69?
(c) How many students scored 90 marks and above?
(d) If students who scored marks above 80 are given merits then how many merit holders are there?
(e) What is the strength of the class?
View SolutionRead the given bar graph, showing the number of games played by different number of students of a school.
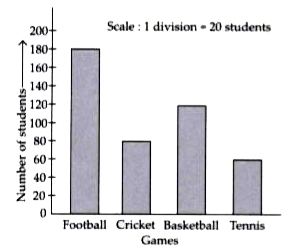
How many students play Cricket and Tennis together ?
View Solution
