The following pictograph shows the number of absentees in aclass of 30 students during the previous week
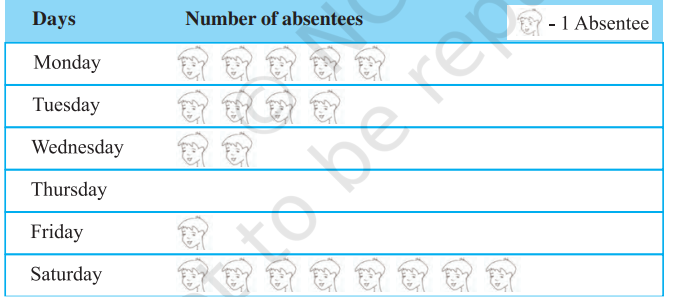
(a) On which day were the maximum number of students absent?
(b) Which day had full attendance?
(c) What was the total number of absentees in that week?
(a) Maximum absentees were on Saturday.
(There are 8 pictures in the row for Saturday; on all
other days, the number
of pictures are less).
(b)Against Thursday, there is no picture, i.e. no one is absent.
Thus, on that day the class had full attendance.
(c) There are 20 pictures in all.
So, the total number of absentees in that
week was 20
Topper's Solved these Questions
- BOOK - NCERTCHAPTER - DATA HANDLINGEXERCISE - EXERCISE 9.33videos
DATA HANDLING
- BOOK - NCERTCHAPTER - DATA HANDLINGEXERCISE - EXERCISE 9.44videos
DATA HANDLING
- BOOK - NCERTCHAPTER - DATA HANDLINGEXERCISE - EXERCISE 9.17videos
DATA HANDLING
- BOOK - NCERTCHAPTER - BASIC GEOMETRICAL IDEASEXERCISE - EXERCISE 4.64videos
BASIC GEOMETRICAL IDEAS
- BOOK - NCERTCHAPTER - DECIMALSEXERCISE - EXERCISE 8.110videos
DECIMALS
Similar Questions
The following pictograph shows the number of absentees in aclass of 30 students during the previous week

(a) On which day were the maximum number of students absent?
(b) Which day had full attendance?
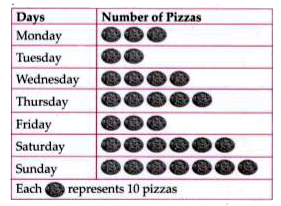
(c) What was the total number of absentees in that week?View SolutionThe given pictograph shows the number of pizzas delivered by pizza hut during a week.
On which day, the number of pizzas delivered is minimum?View SolutionRead the given bar graph, showing the number of games played by different number of students of a school.
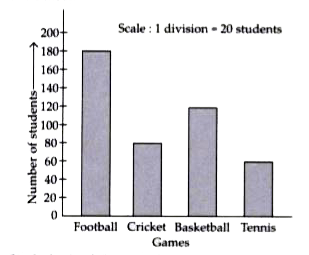
Which game is played by the maximum number of students ?View SolutionFollowing pictograph shows the number of tractors in five villages.

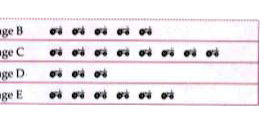
Observe the pictograph and answer the following questions.
Which village has the maximum number of tractors.View SolutionThe pictograph shows the number of bicycles made by a factory during the four weeks of a month. Answer the following questions.
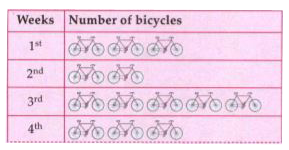

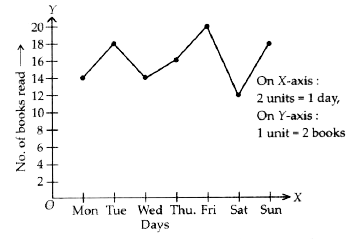
In which week maximum number of bicycles were made ?View SolutionThe following graph shows the number of books read by Ashok in a week.
On which day Ashok read the maximum number of books?
 View Solution
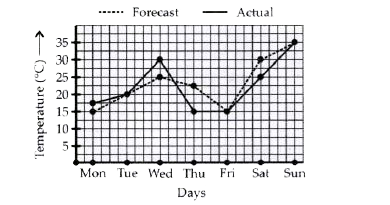
The following graph shows the temperature forecast and the actual temperature for each day of a week.(a) On which days was the forecast temperature the same as the actual temperature? (b) What was the maximum forecast temperature during the week?(c) What was the minimum actual temperature during the week?(d) On which day did the actual temperature differ the most from the forecast temperature?
View SolutionThe following graph shows the temperature forecast and the actual temperature for each day of a week.
(a) On which days was the forecast temperature the same as the actual temperature?
(b) What was the maximum forecast temperature during the week?
(c) What was the minimum actual temperature during the week?
(d) On which day did the actual temperature differ the most from the forecast temperature?
 View Solution
A class teacher has the following absentee record of 40 students of a class for the whole term. Find the mean number of days a student was absent.
View SolutionIn a class of 50 students, 8 % were absent on one day. The number of students present on that day was ________.
View Solution

