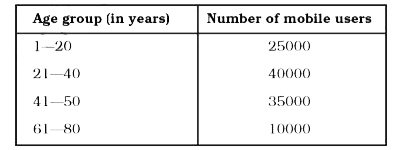
Number of persons in various age groups in a town is given in the following tableDraw a bar graph to represent the above information and answer the following questions. (take 1 unit length = 20 thousands)(a) Which two age groups have same population?(b) All persons in the age group of 60 and above are called senior citizens. How many senior citizens are there in the town?
a) 30-44 and 45-59 have same population=120,000
b)The age corresponding to age 60 or more=age between60-74 and 75 and above.
=80,000+40,000=120,000 people.
Topper's Solved these Questions
- DATA HANDLINGBOOK - NCERTCHAPTER - DATA HANDLINGEXERCISE - EXERCISE 9.1
7 Videos
- DATA HANDLINGBOOK - NCERTCHAPTER - DATA HANDLINGEXERCISE - EXERCISE 9.3
3 Videos
- BASIC GEOMETRICAL IDEASBOOK - NCERTCHAPTER - BASIC GEOMETRICAL IDEASEXERCISE - EXERCISE 4.6
4 Videos
- DECIMALSBOOK - NCERTCHAPTER - DECIMALSEXERCISE - EXERCISE 8.1
10 Videos
Similar Questions
Knowledge Check
Study the following histogram and answer the questions.
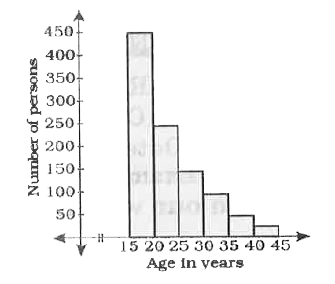
The number of persons in the age group 20 - 30 years is :A475B400C300D700Study the following histogram and answer the questions.
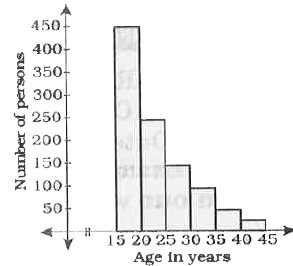
The total number of persons in the age group of 15 years to 45 years is :A450B800C1000D500The given bar graph represents the number of teachers in different weight groups. Study the graph and answer the questions that follows
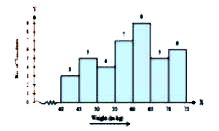
In which the following weight groups in the number of teachers the maximumA45-50B60-65C65-70D40-45
The bar graph given below represents the circulation of newspapers in different languages in a town. Study the bar graph and answer the following questions:
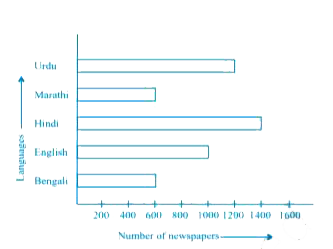
Name the two languages in which circulation of newspaper is the same.
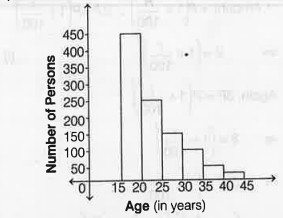
View SolutionDirection :- Study the histogram and answer the following questions
 .
.
The ratio of the number of persons between the age group of 20-25 and 30-35 is
(A) 1:3
(B) 2:1
(C ) 10:3
(D) 6:1
View SolutionThe following table shows the number of illitrate persons in the age group (10-58 Years) in a town. Represents the given data by means of a histogram.

View SolutionThe bar graph given below represents the circulation of newspapers (dailies) in a town in six languages (the figures are approximated to hundreds).
f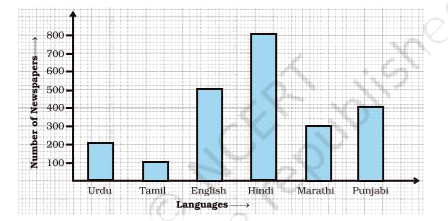
Study the bar graph and answer the following questions:
(a) Find the total number of newspapers read in Hindi, Punjabi, Urdu, Marathi and Tamil.
(b) Find the excess number of newspapers read in Hindi than those in English.
(c) Name the language in which the least number of newspapers are read.
(d) Write the total circulation of newspapers in the town.
View SolutionStudy the following histogram and answer the questions.
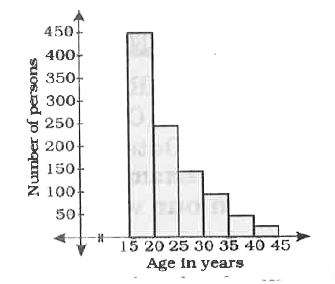
The ratio of maximum population in an age group to the total number of persons under study is :
View Solution

