Study the following graph carefully and answer the questions that follow
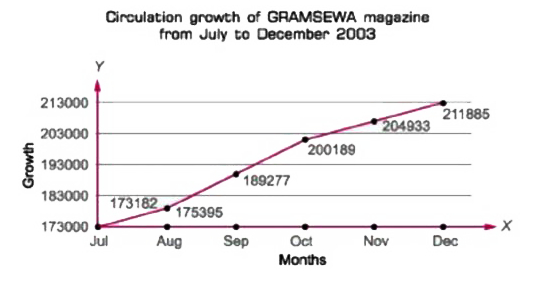
The circulation of magazine in November is …….. more than that of September
15566
16556
15656
16000
The correct Answer is:C
Step by step video, text & image solution for Study the following graph carefully and answer the questions that follow The circulation of magazine in November is …….. more than that of September by Maths experts to help you in doubts & scoring excellent marks in Class 14 exams.
Updated on:21/07/2023Topper's Solved these Questions
- LINE GRAPHBook:ARIHANT SSCChapter:LINE GRAPHExercise:FAST TRACK PRACTICE
Explore 43 Videos
- INDICES AND SURDSBook:ARIHANT SSCChapter:INDICES AND SURDSExercise:HIGHER SKILL LEVEL QUESTIONS
Explore 17 Videos
- LINEAR EQUATIONSBook:ARIHANT SSCChapter:LINEAR EQUATIONSExercise:Higher Skill Level Questions
Explore 7 Videos
Similar Questions
Study the following graph carefully and answer the questions that follow
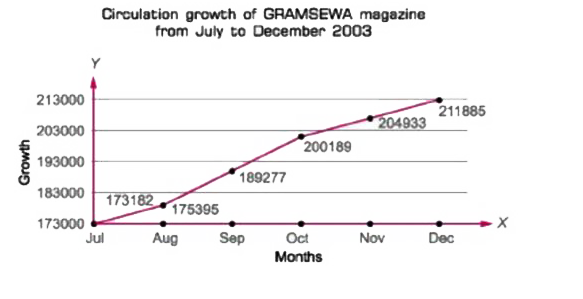
The growth rate is very marginal during the month of
View SolutionStudy the following graph carefully and answer the questions that follow
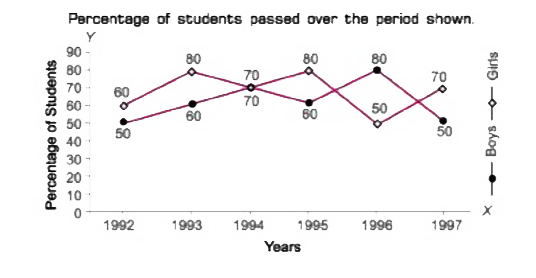
What is the ratio of the average of failed girls and that of failed boys ?
View Solution
Knowledge Check
Study the following bar graph and answer the question that follows.
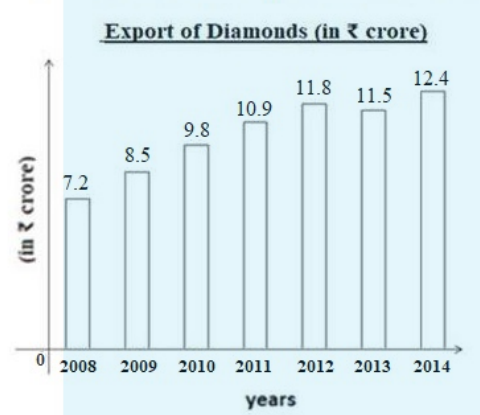
In which year was the maximin percentage increase in diamonds exports compared to the previous year?A2014B2009C2010D2012Study the following graph carefully and answer the questions that follow
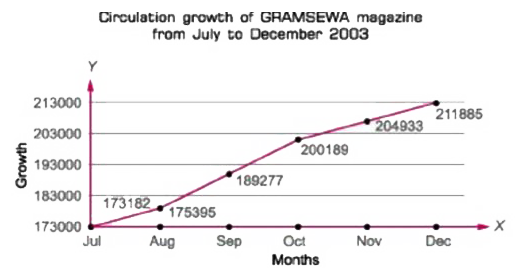
The circulation in October is ……. times than that of July .A1.5B1C1.15DNone of theseStudy the following graph carefully and answer the questions that follow
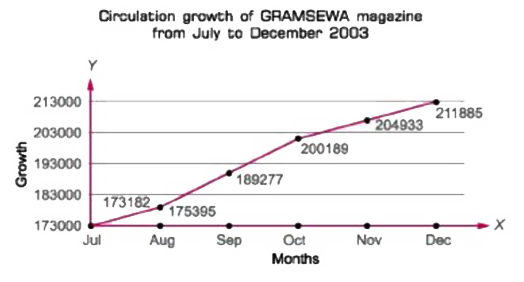
What is the total circulation of magazine from July to December ?A1154681B1154861C1145861D1150862
Study the following graphs carefully and answer the questions that follow :
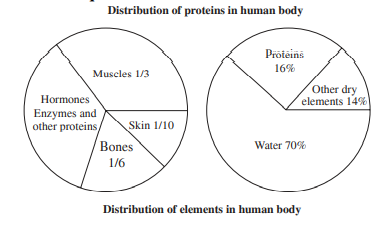
In the human body what is made of neither bones nor skin ?
View SolutionStudy the following graphs carefully and answer the questions that follow :
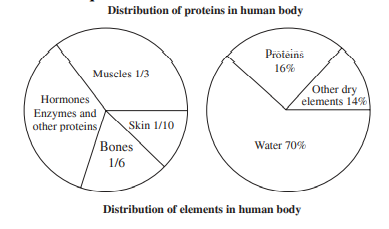
What is the ratio of the distribution of proteins in the muscles to that of the distribution of proteins in the bones ?
View SolutionStudy the following graph carefully and answer the questions that follow
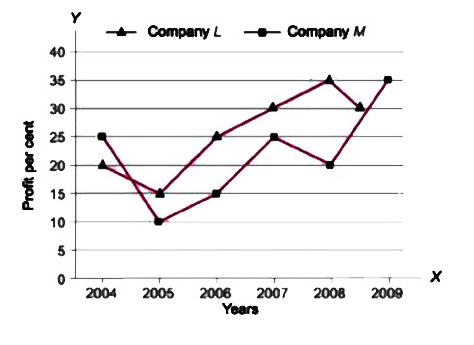
Which of the following statements is true with respect to the above graph ?
View SolutionStudy the following graph carefully and answer the questions that
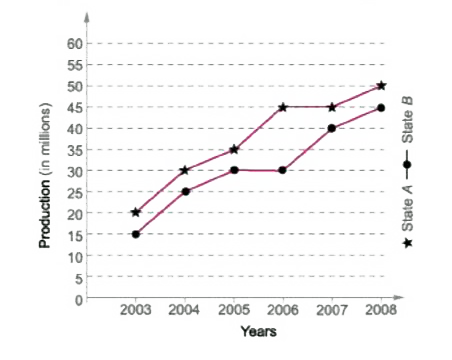
What was the average population of State B ( in millions ) for the years together ?
View SolutionStudy the following graph carefully and answer the questions that
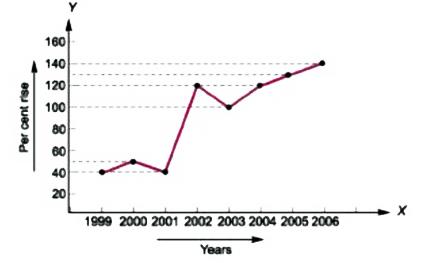
What was the average of percent rise over the given years ?
View Solution
