Study the following graph carefully and answer the questions that follow
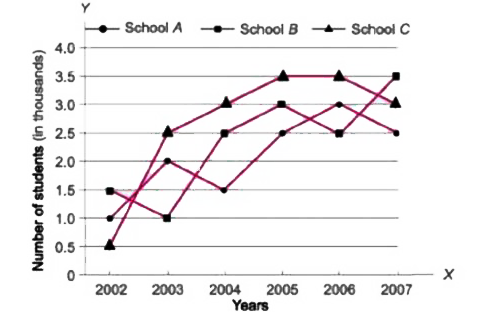
How many times the total number of students in all the three schools A,B and C together was exactly equal among the given years ?
2
5
4
3
The correct Answer is:D
Step by step video, text & image solution for Study the following graph carefully and answer the questions that follow How many times the total number of students in all the three schools A,B and C together was exactly equal among the given years ? by Maths experts to help you in doubts & scoring excellent marks in Class 14 exams.
Updated on:21/07/2023Topper's Solved these Questions
- LINE GRAPHBook:ARIHANT SSCChapter:LINE GRAPHExercise:FAST TRACK PRACTICE
Explore 43 Videos
- INDICES AND SURDSBook:ARIHANT SSCChapter:INDICES AND SURDSExercise:HIGHER SKILL LEVEL QUESTIONS
Explore 17 Videos
- LINEAR EQUATIONSBook:ARIHANT SSCChapter:LINEAR EQUATIONSExercise:Higher Skill Level Questions
Explore 7 Videos
Similar Questions
Following table shows the number of students studying in four different schools in four years. Studying the table carefully and answer the questions that follow
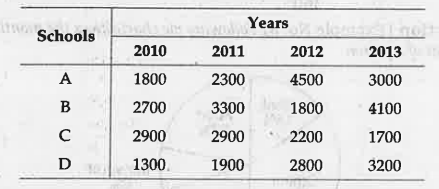
What is the total number of students studying in all the four schools together in the year 2012?
View SolutionStudy the following graph carefully and answer the given questions.
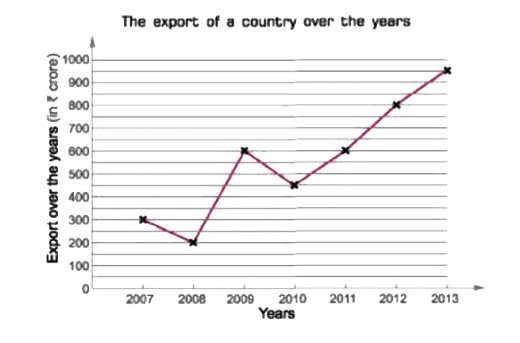
What is the total exports ( in ? Crore) for the given years ?
View Solution
Knowledge Check
Study the following graph carefully and answer the questions that follow
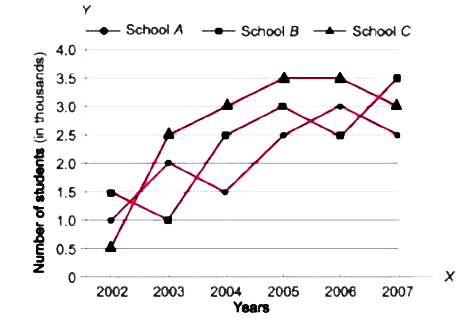
What was the average number of students in all schools together in the year 2006 ?A30000B9000C3000D6000Study the following graph carefully and answer the questions that follow
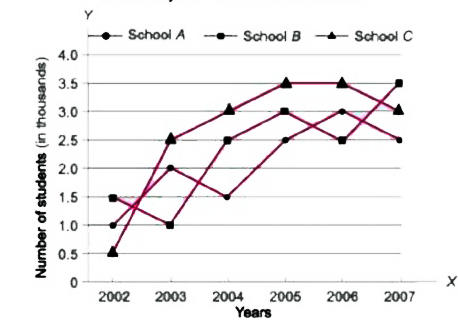
What was the approximate average number of students in school A over all the years together ?A1990B2090C2300D1800Study the following graph carefully to answer the questions that follow-----
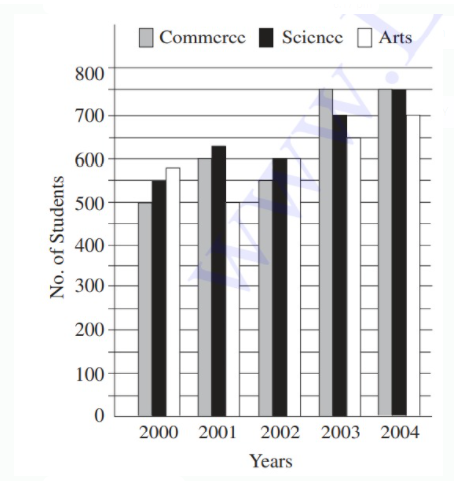
What is the total number of students studying Arts in all the years together ?A3700B2750C3500DNone of these
Study the following graph carefully and answer the questions that
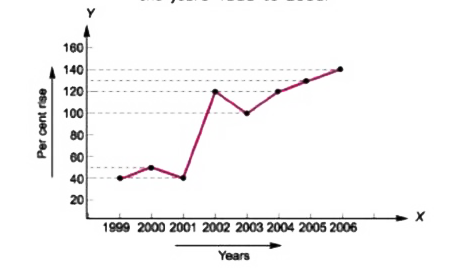
For how many years , the percent rise was more than 100 % ?
View SolutionStudy the following graph carefully and answer the questions that follow
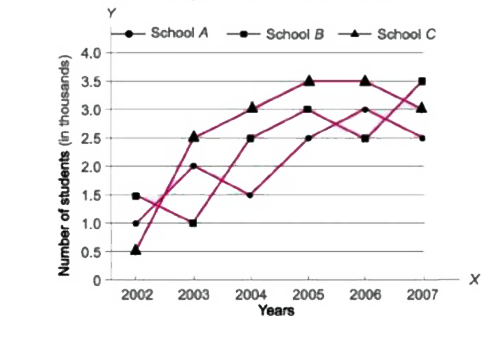
What was the difference between the total number of students in all schools together in the year 2003 and the number of students in school B in the year 2005 ?
View SolutionStudy the following graph carefully and answer the questions that follow
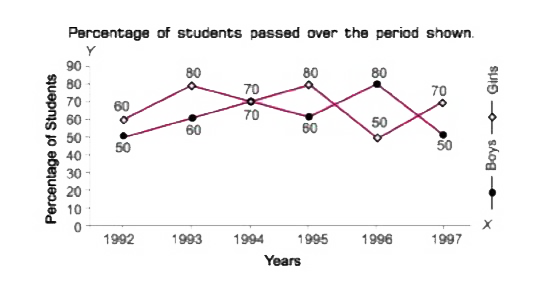
For how many times was the gap constant for the percentage of successful boys and girls ?
View SolutionStudy the following graph carefully and answer the questions that follow
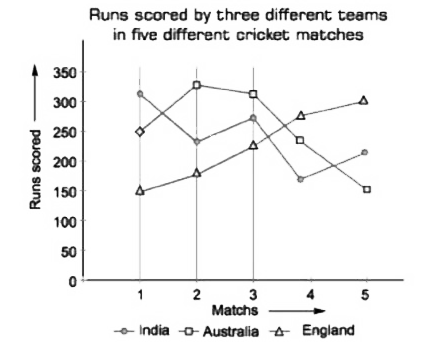
What are the average runs scored by all the three teams in Match 3 together ?
View SolutionStudy the following graph carefully and answer the questions that follow
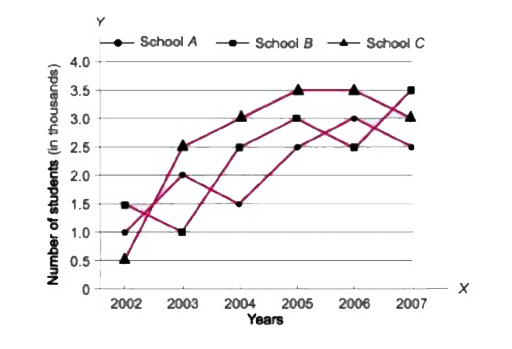
Total number of students in school B and school C together in the year 2004 was approximately what percent of the total number of students in school B and school C together in the year 2007 ?
View Solution
