Study the following graph carefully and answer the questions that follow
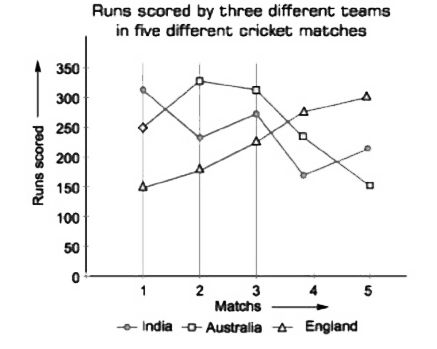
In which match the total runs scored by India and England together is the third highest /lowest ?
1
2
3
4
The correct Answer is:A
Step by step video, text & image solution for Study the following graph carefully and answer the questions that follow In which match the total runs scored by India and England together is the third highest /lowest ? by Maths experts to help you in doubts & scoring excellent marks in Class 14 exams.
Updated on:21/07/2023Topper's Solved these Questions
- LINE GRAPHBOOK - ARIHANT SSCCHAPTER - LINE GRAPHEXERCISE - FAST TRACK PRACTICE
43 Videos
- INDICES AND SURDSBOOK - ARIHANT SSCCHAPTER - INDICES AND SURDSEXERCISE - HIGHER SKILL LEVEL QUESTIONS
17 Videos
- LINEAR EQUATIONSBOOK - ARIHANT SSCCHAPTER - LINEAR EQUATIONSEXERCISE - Higher Skill Level Questions
7 Videos
Similar Questions
Study the following graphs carefully and answer the questions that follow :
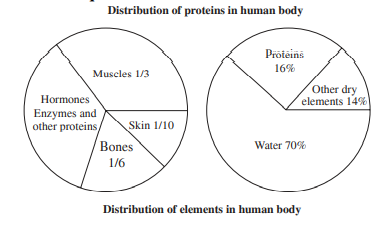
In the human body what is made of neither bones nor skin ?
View SolutionStudy the following graph carefully and answer the questions that follow
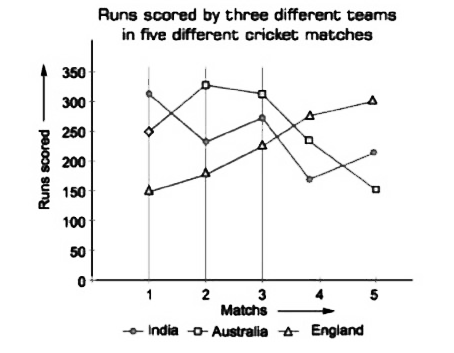
Total runs scored by India and Ausralia in Match 4 together is approximately , what percentage of the total runs scored by England in all thefive matches together ?
View Solution
Knowledge Check
Study the following graph carefully and answer the questions that follow
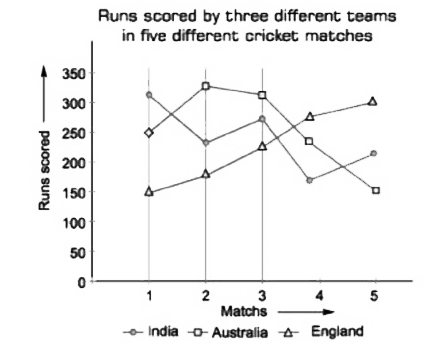
In which match , is the difference between the runs scored by Australia and England second lowest ?A1B2C3D4Study the following graph carefully and answer the questions that follow
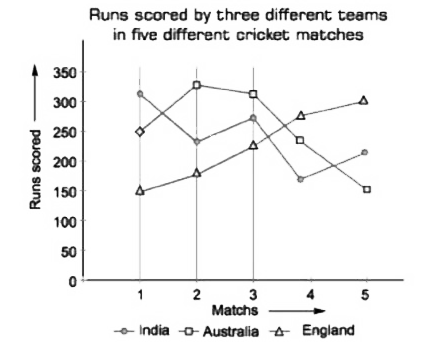
What are the average runs scored by all the three teams in Match 3 together ?Aa) 280Bb) 270Cc) 275Dd) 285Study the following graph carefully and answer the questions that follow
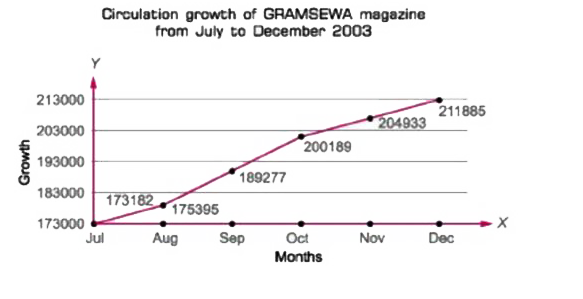
The growth rate is very marginal during the month ofAAugustBOctoberCNovemberDDecember
Study the following graph carefully and answer the questions that follow
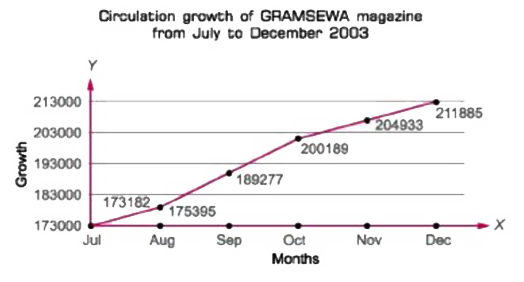
What is the total circulation of magazine from July to December ?
View SolutionStudy the following graph carefully and answer the questions that follow
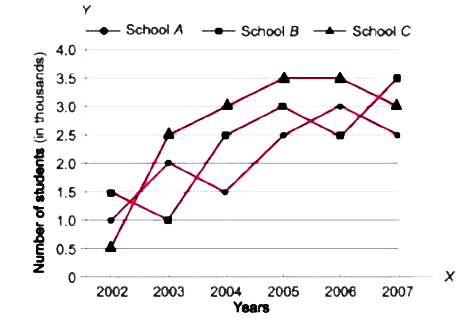
What was the average number of students in all schools together in the year 2006 ?
View SolutionStudy the following graph carefully and answer the following questions -----
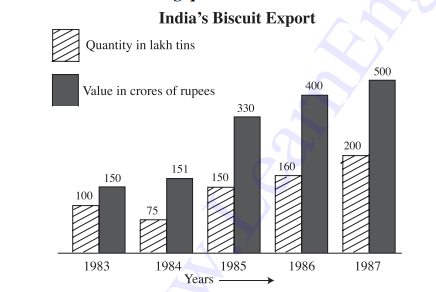
In which year the value per tins was minimum ?
View SolutionStudy the following graph carefully and answer the questions that follow
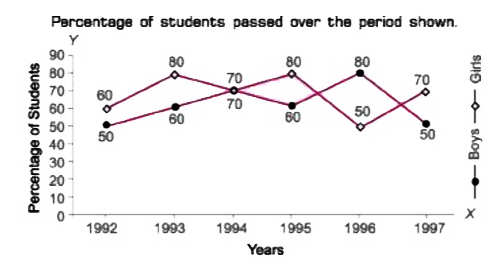
What is the over all percentage of failed boys over the period shown ?
View SolutionStudy the following graph carefully and answer the questions that follow
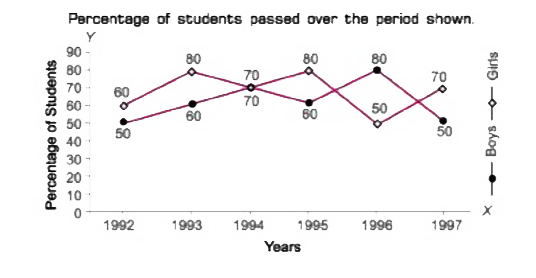
What is the ratio of the average of failed girls and that of failed boys ?
View Solution
