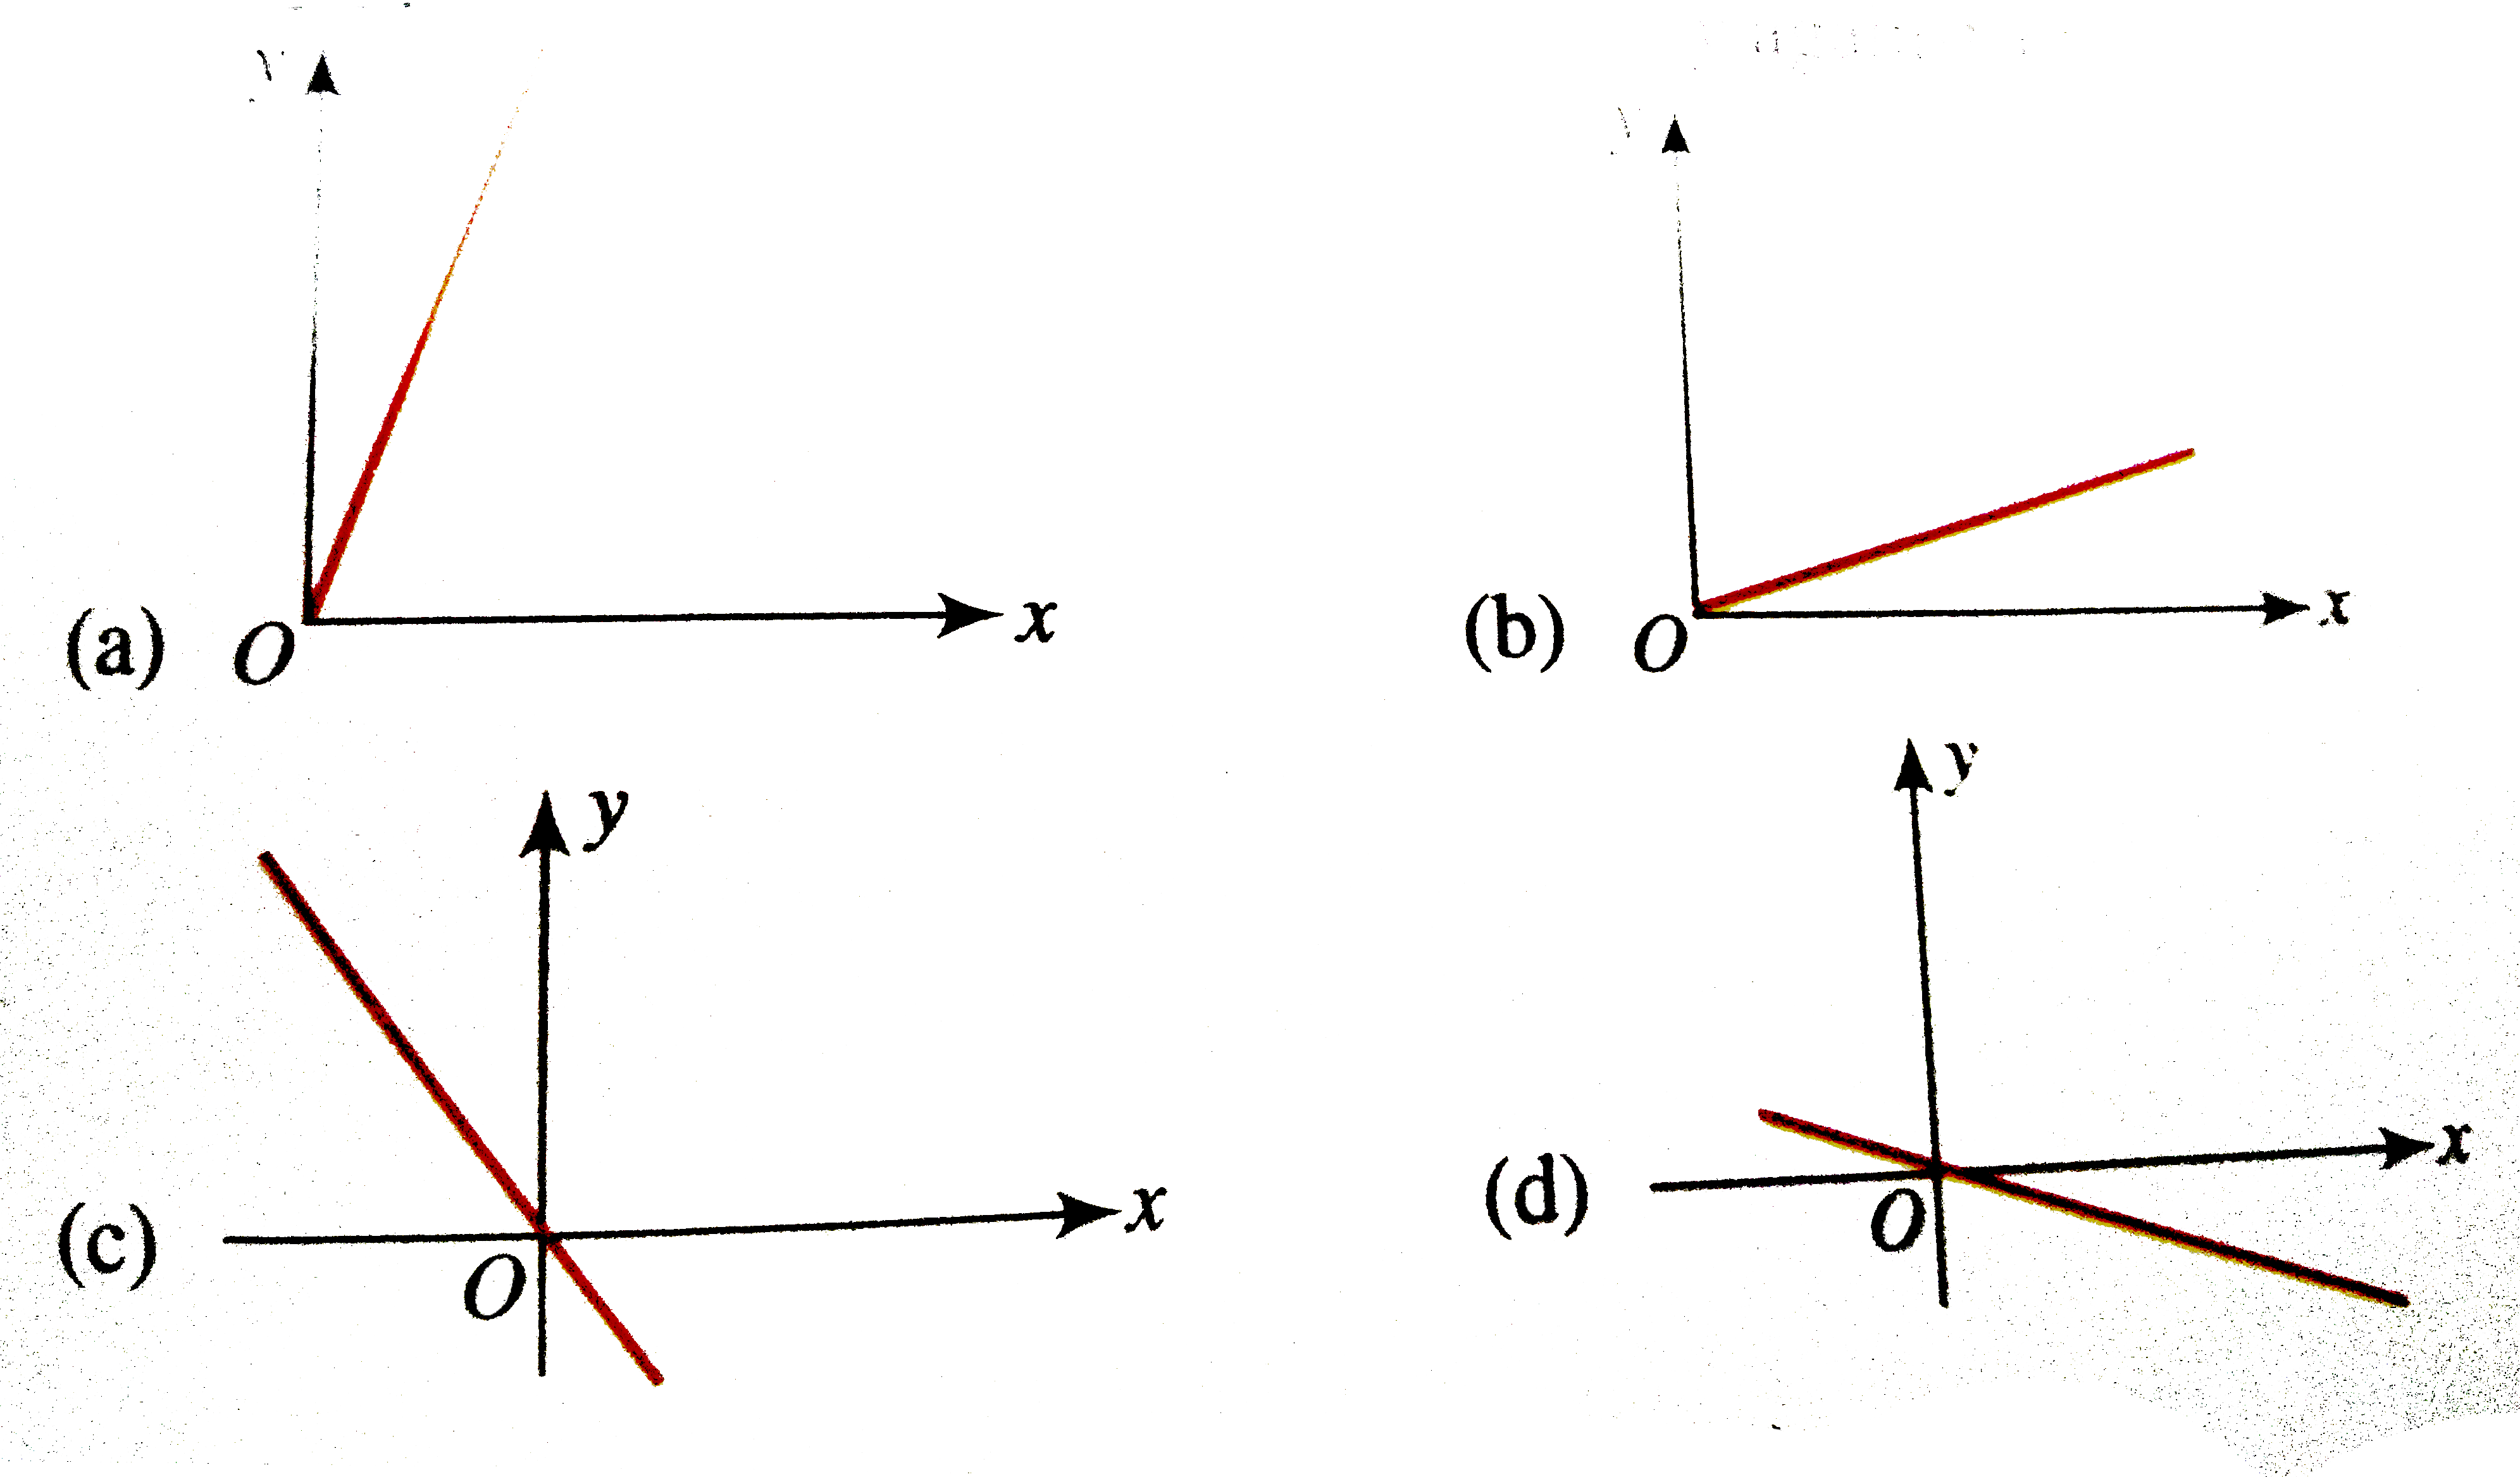
Consider the following diagrams x men, working at constant speed, do a certain job in y days. Which one of these diagrams shows the relation between x and y?
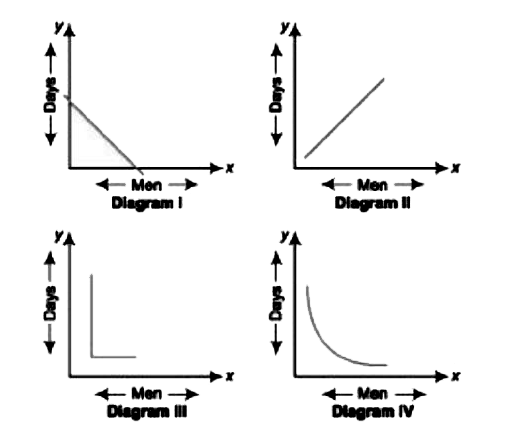
diagram I
diagram II
diagram III
diagram IV
The correct Answer is:D
Step by step video, text & image solution for Consider the following diagrams x men, working at constant speed, do a certain job in y days. Which one of these diagrams shows the relation between x and y? by Maths experts to help you in doubts & scoring excellent marks in Class 14 exams.
Updated on:21/07/2023Topper's Solved these Questions
- WORK AND TIME Book:ARIHANT SSCChapter:WORK AND TIME Exercise:EXERCISE BASE LEVEL QUESTION
Explore 68 Videos
- VOLUME AND SURFACE AREA Book:ARIHANT SSCChapter:VOLUME AND SURFACE AREA Exercise:FAST TRACK PRACTICE
Explore 111 Videos
- WORK AND WAGES Book:ARIHANT SSCChapter:WORK AND WAGES Exercise:EXERCISE (HIGHER SKILL LEVEL QUESTIONS)
Explore 7 Videos
Similar Questions
Knowledge Check
Which one is the correct relation between the elastic constants Y, K and η ?
AY=9Kη3K+ηBY=3Kη3η+KCY=3K+ηKηDY=KηK+3ηIf x men can do a piece of work in y days, in how many days will x men do the same work ?
AxzyBxyzCyzxDxyzIf x men, working x hours per day, can do x units of work in x days, then y mens, working y hours per day would be able to complete how many units of work in y days? x2y3 b. x3y2 c. x3y2 d. y3x2
Ax2y3 units of workBx3y2 units of workCy2x3 units of workDy3x2 units of work
The diagram shows a number line.

The value of x + y is
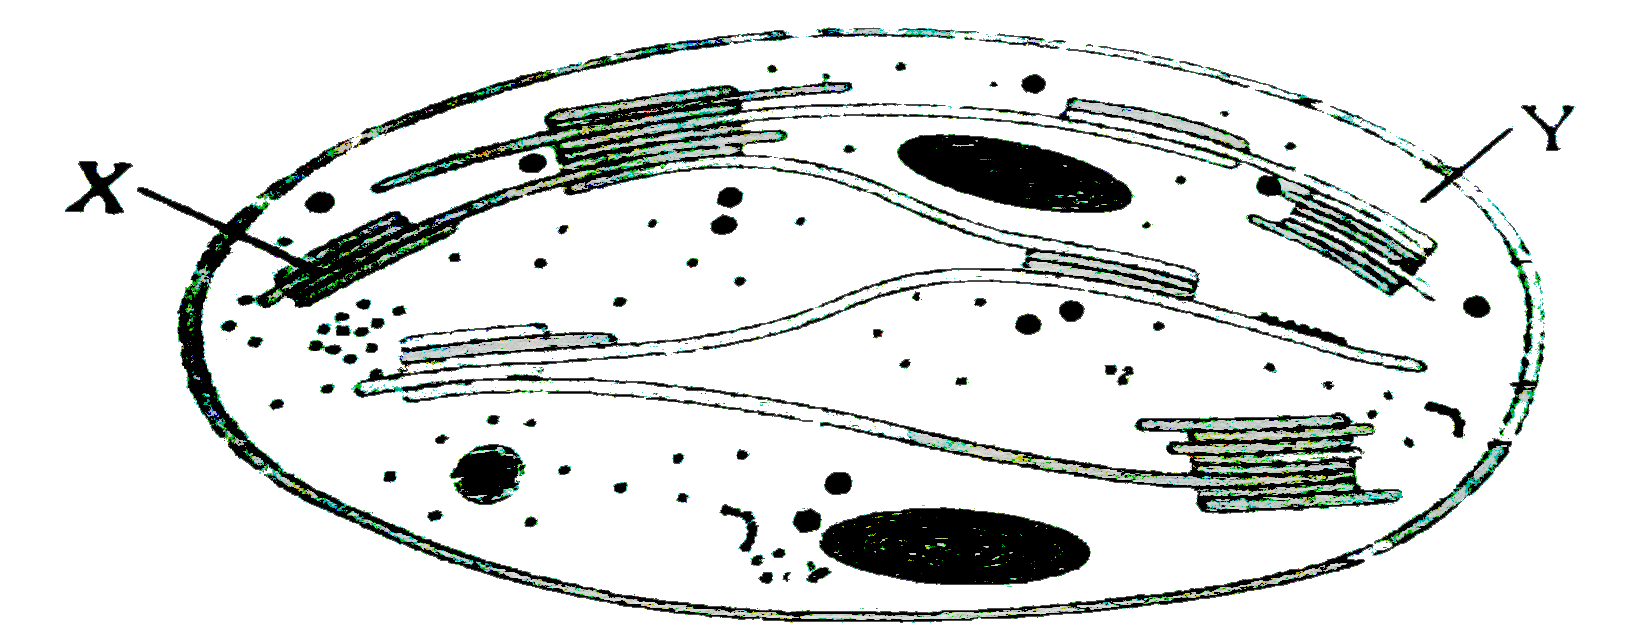
View SolutionSee the following diagram and identify x and y with their fuctions

View SolutionShow the relationship between X and Y through a scattered diagram.

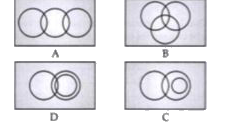
View SolutionWhich one of the following venn diagrams represents the relation among men, doctors and patients in a hospital ?
View SolutionThe graph of (y−x) against (y+x) is shown below.
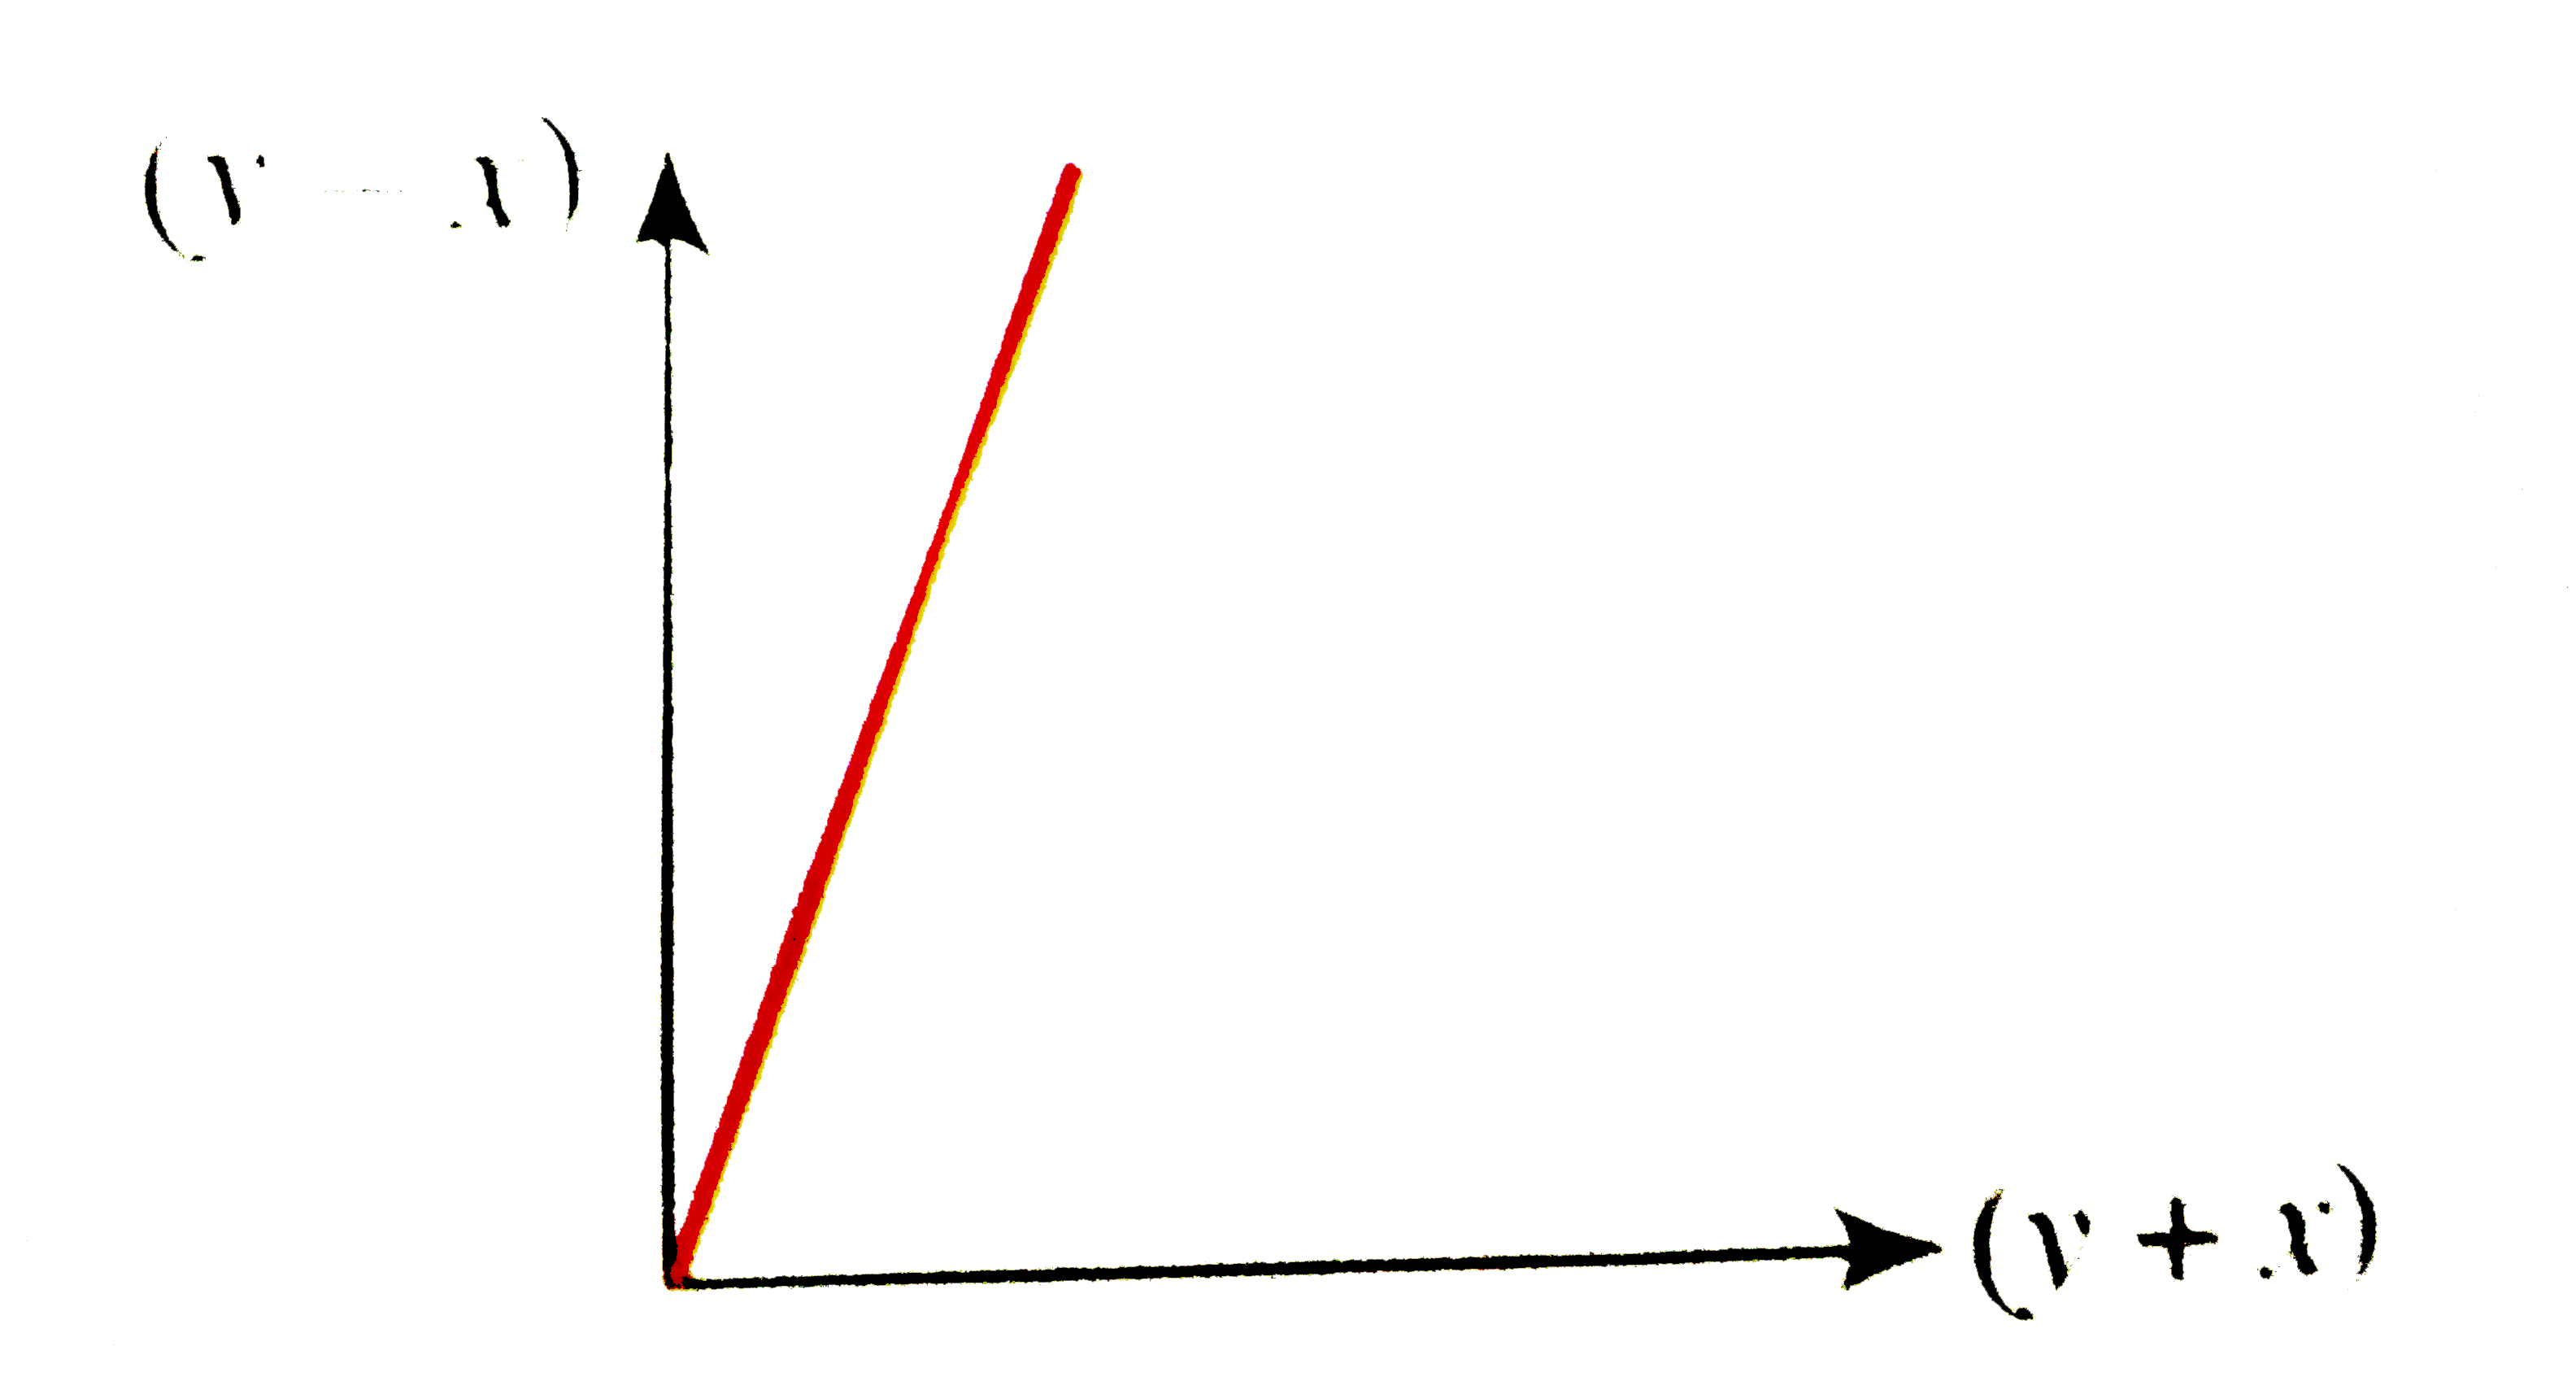
Which one of the following shows the graph of y against x ?
View Solution

