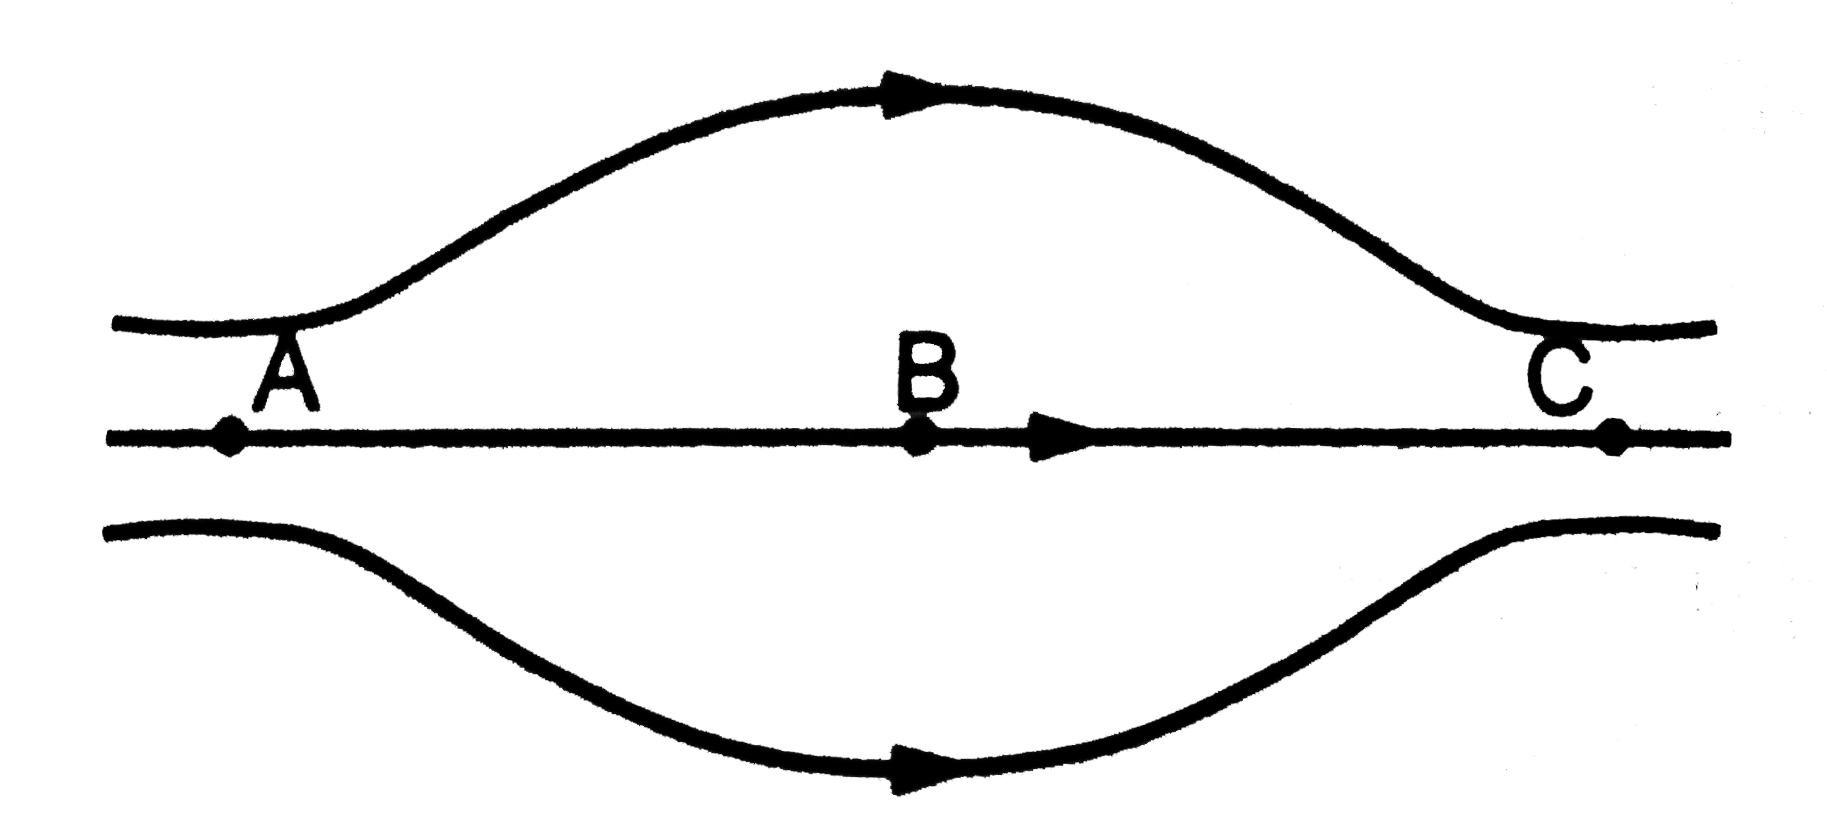
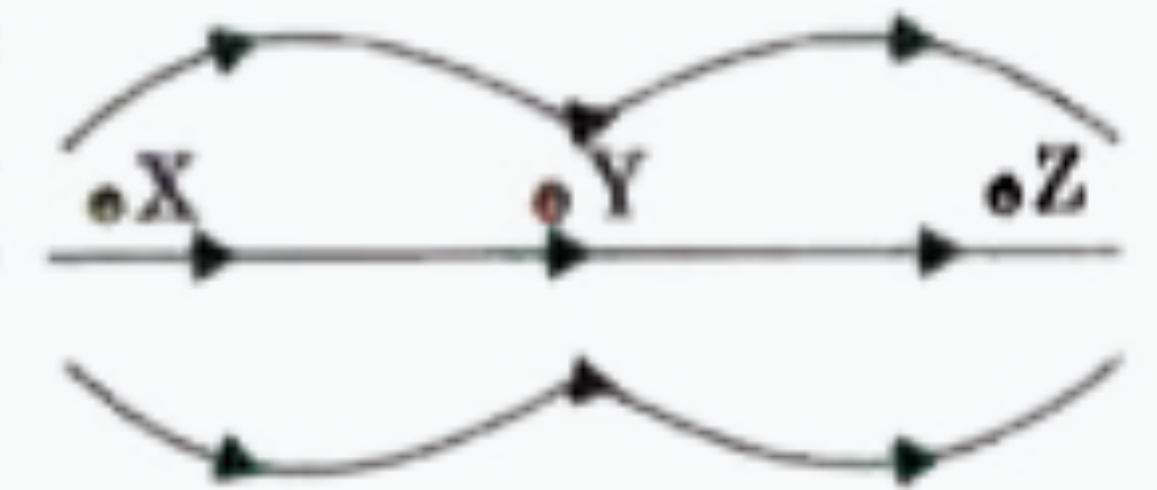
In the figure , electric field lines in a certain region are shown. The figure suggests that :
A
Ex=Ey=Ez
B
Ex<Ey<Ez
C
Ex>Ey>Ez
D
Ex=Ez<Ey
Text Solution
The correct Answer is:D
In the diagram, density of electric field lines are nearly same at point X and Z but their density near point Y is more.
|
Topper's Solved these Questions
- ELECTRIC CHARGES AND FIELDS Book:MODERN PUBLICATIONChapter:ELECTRIC CHARGES AND FIELDS Exercise:COMPETITION FILE ( Objective Question (BA.MCQ))
Explore 3 Videos
- ELECTRIC CHARGES AND FIELDS Book:MODERN PUBLICATIONChapter:ELECTRIC CHARGES AND FIELDS Exercise:COMPETITION FILE ( Objective Question (BB.MCQ))
Explore 22 Videos
- ELECTRIC CHARGES AND FIELDS Book:MODERN PUBLICATIONChapter:ELECTRIC CHARGES AND FIELDS Exercise:COMPETITION FILE ( Objective Question (A.MCQ) )
Explore 56 Videos
- DUAL NATURE OF RADIATION AND MATTER Book:MODERN PUBLICATIONChapter:DUAL NATURE OF RADIATION AND MATTER Exercise:CHAPTER PRACTICE TEST
Explore 15 Videos
- ELECTROMAGNETIC INDUCTIONBook:MODERN PUBLICATIONChapter:ELECTROMAGNETIC INDUCTIONExercise:CHAPTER PRACTICE TEST FOR BOARD EXAMINATION
Explore 14 Videos
Similar Questions
Knowledge Check
The figure shows some of the electric field lines corresponding to an electric field. The figure suggests
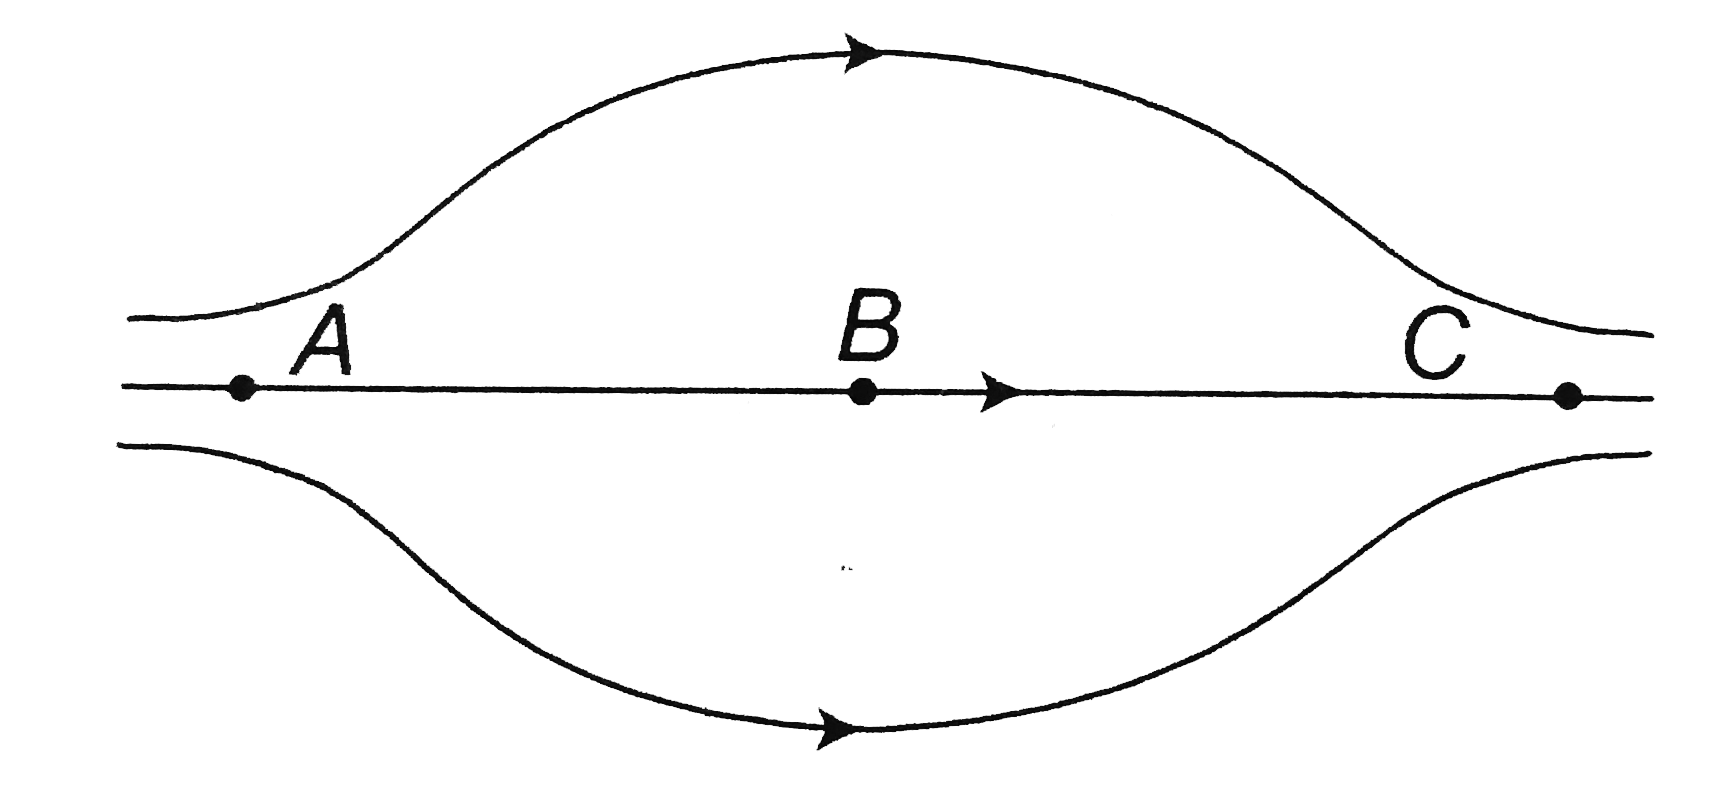 AEa>EB>ECBEA=EB=ECCEa=EC>EBDEA>EC>EB
The figure shows some of the electric field lines corresponding to an electric field. The figure suggests
 AEA>EB>ECBEA=EB=ECCEA=EC>EBDEA=EC<EB
The figure shows some of the electric field lines corresponding to an electric field. The figure suggests
 AEA>EB>ECBEA=EB=ECCEA=EC>EBDEA>EC<EB
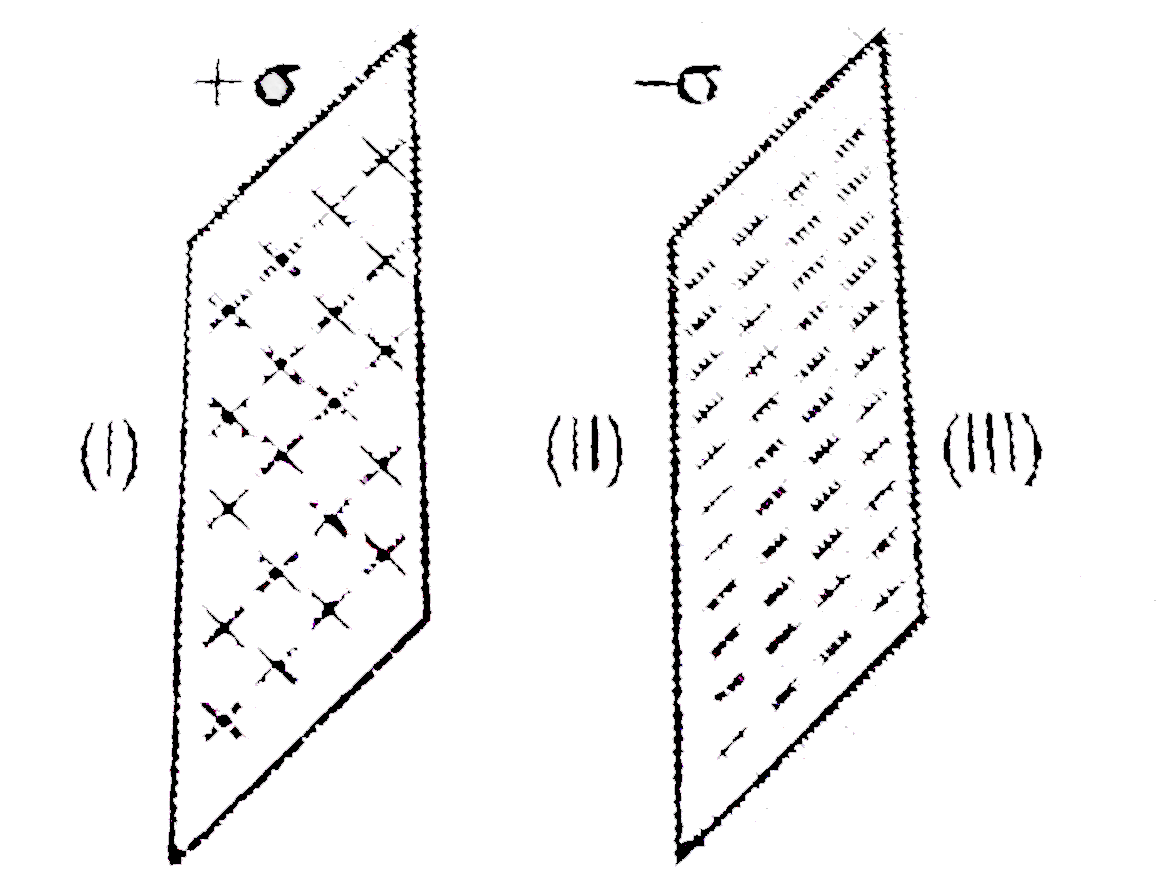
In the uniform electric field shown in figure, find

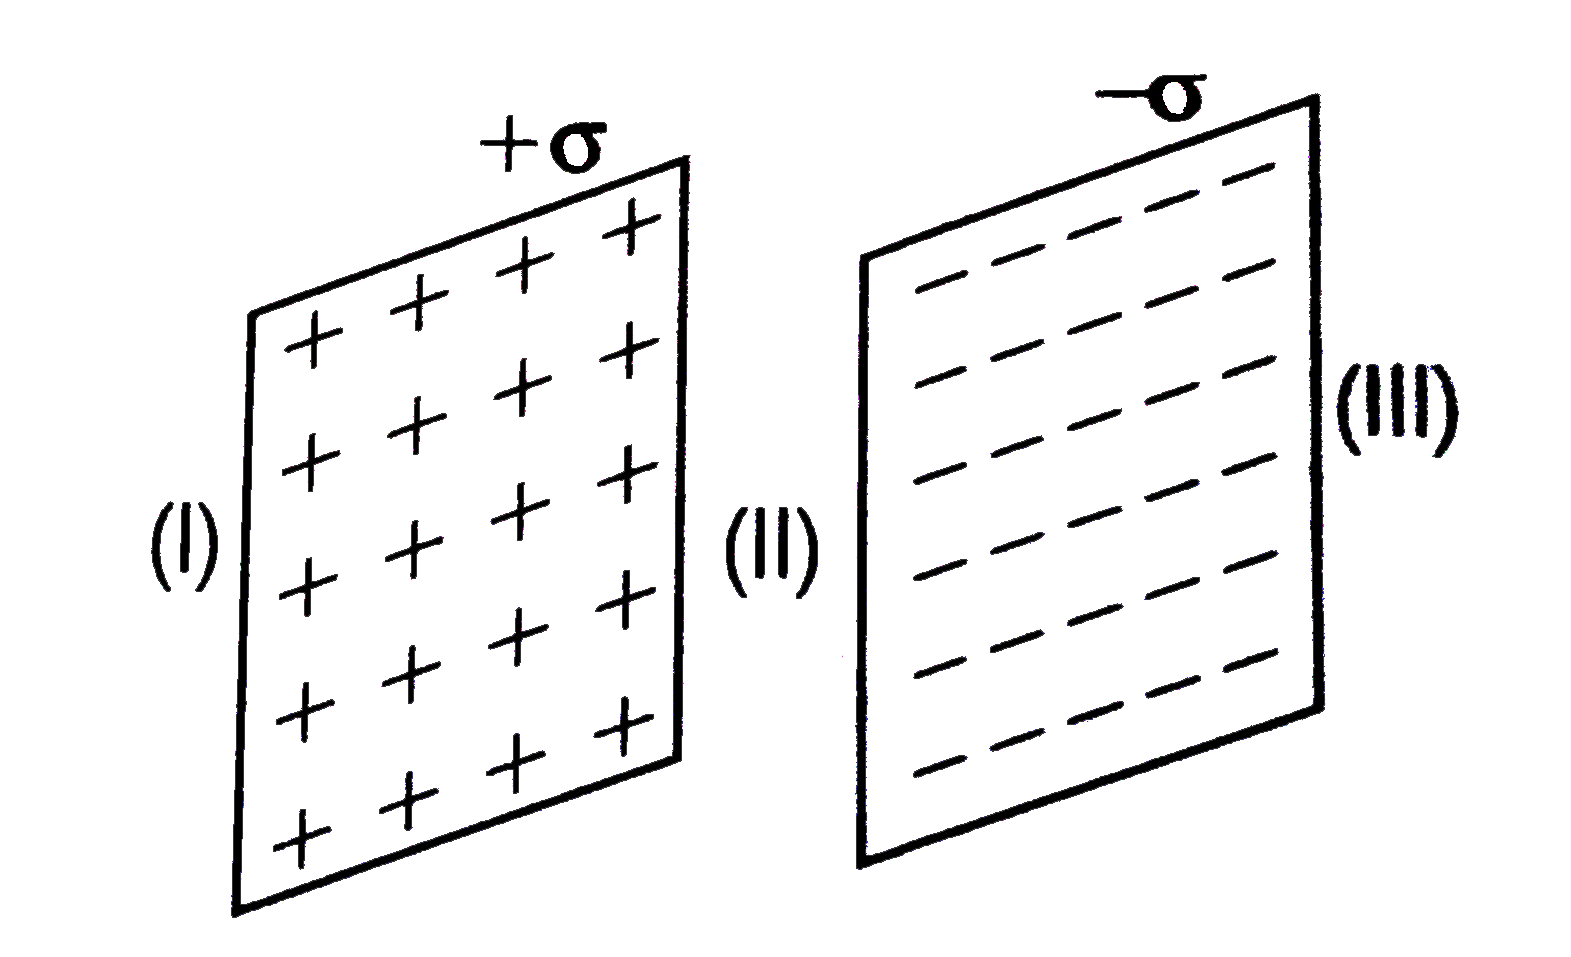
View SolutionFind the electric field in region II as in figure shown.
View SolutionThe figure shows some of the electric field lines corresponding to an electric field. The figure suggests

View SolutionFigure 1.24 shows electric field lines corresponding to an electric field E. Figure suggests that.

View SolutionFind the electric field in region II as shown in figure.
View Solution


