A random survey of the number of children of various age groups playing in a park was found as following Draw a histogram to represent
Please refer to video to see the histogram for the given data.
Similar Questions
A random survey of the number of children of various are groups playing in park was found as follows :
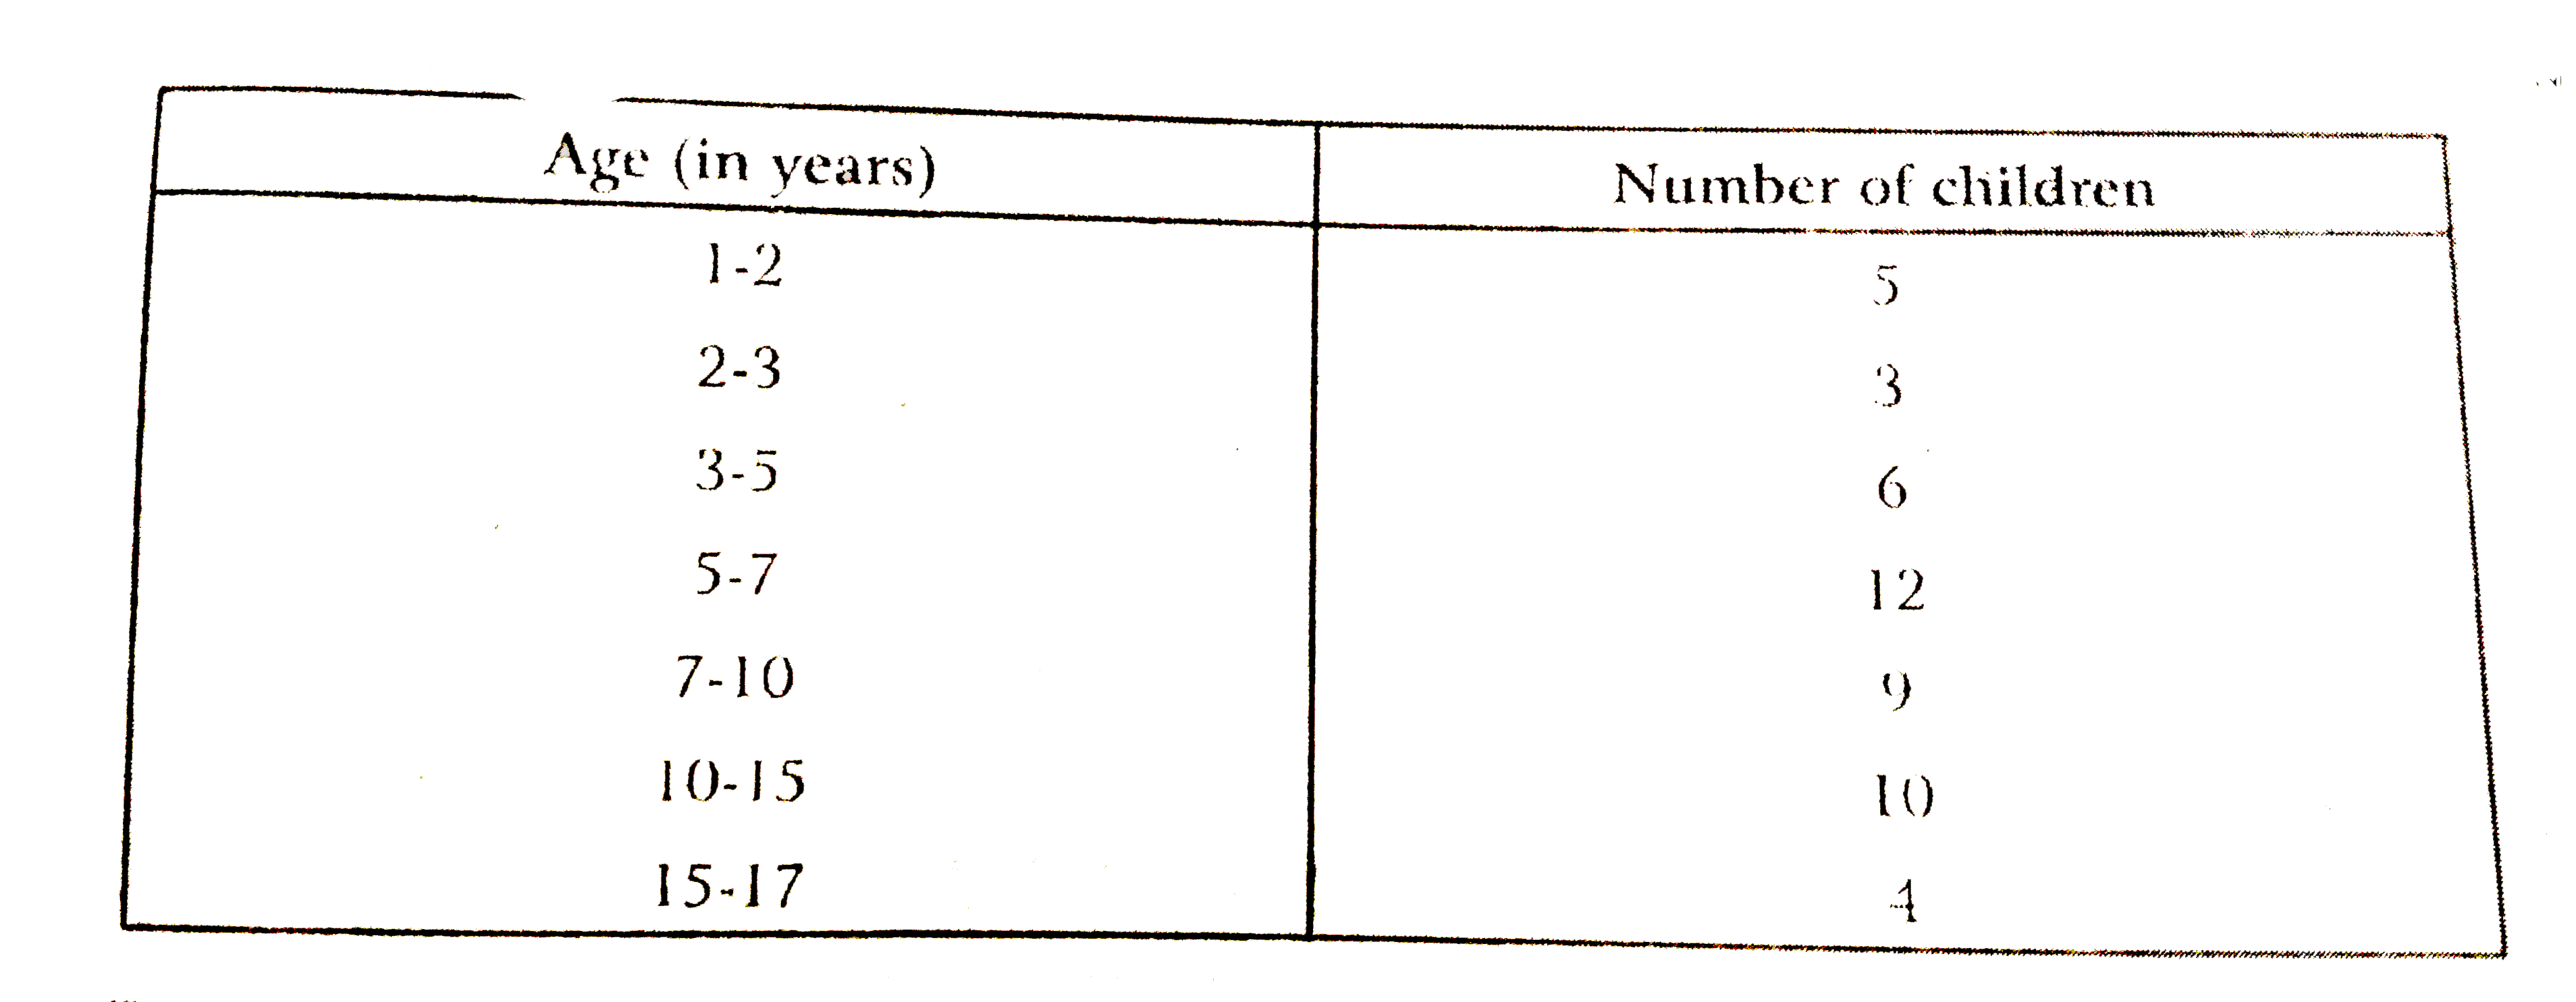
Draw a histogram to represent the data above.
View SolutionDraw a histogram to represent the following:

View Solution100 surnames were randomly picked up for a test and fequency distribution of the number of letters in the English alphabet in the surnames was found as follows :
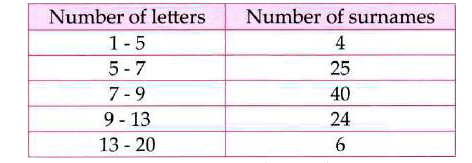
Draw a histogram to depict the given information
View SolutionDraw a histogram to represent the following data.

View SolutionThe given table presents the number of illiterate males in the age group (10-34) in a town.

Draw a histogram to represent the above data.
View SolutionNumber of mobile phone users in various age groups in a city is listed below:
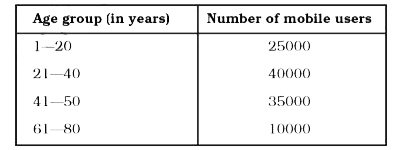
Draw a bar graph to represent the above information.
View SolutionThe length of 40 leaves of a plant are measured correct to one millimetre, and the obtained data is represented in the following table:
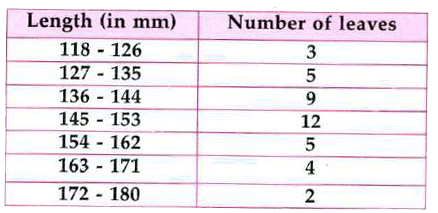
Draw a histogram to represent the given data. [Hint: First make the class intervals continuous]
View SolutionThe length of 40 leaves of a plant are measured correct to nearest millimetres. The data obtained is as follows :

Draw histogram to represent the given data.
View SolutionA study was made for the number of persons of different age group visited in a library in a week which is shown in the histogram. Study the histogram and answer the question given below.
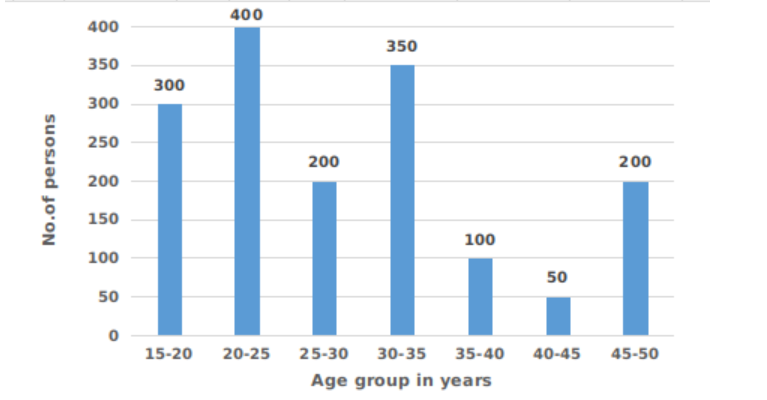
The ratio of the number of persons in the age groups 15-20 years and 20-25 years together, to the number of persons in the age groups 30-35 years and 35-40 years together, is:
View SolutionDraw the histogram to represent the following data.

View Solution
