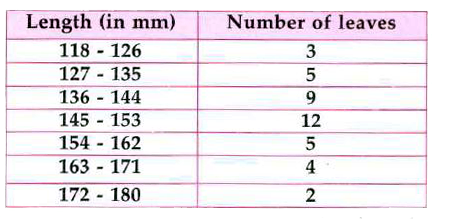
The length of 40 leaves of a plant are measured correct to one millimetre, and the obtained data is represented in the following table:
![The length of 40 leaves of a plant are measured correct to one millimetre, and the obtained data is represented in the following table: Draw a histogram to represent the given data. [Hint: First make the class intervals continuous]](https://d10lpgp6xz60nq.cloudfront.net/physics_images/MTG_FOU_COU_MAT_IX_C14_E01_025_Q01.png)
Draw a histogram to represent the given data. [Hint: First make the class intervals continuous]
The correct Answer is:(##MTGFOUCOUMATIXC14E01025_A01##)
Step by step video, text & image solution for The length of 40 leaves of a plant are measured correct to one millimetre, and the obtained data is represented in the following table: Draw a histogram to represent the given data. [Hint: First make the class intervals continuous] by Maths experts to help you in doubts & scoring excellent marks in Class 9 exams.
Updated on:21/07/2023Topper's Solved these Questions
- STATISTICSBOOK - MTG IIT JEE FOUNDATIONCHAPTER - STATISTICSEXERCISE - NCERT SECTION (Exercise 14.4)
7 Videos
- STATISTICSBOOK - MTG IIT JEE FOUNDATIONCHAPTER - STATISTICSEXERCISE - Exercise (Multiple Choice Question)
50 Videos
- STATISTICSBOOK - MTG IIT JEE FOUNDATIONCHAPTER - STATISTICSEXERCISE - NCERT SECTION (Exercise 14.2)
15 Videos
- QUADRILATERALS BOOK - MTG IIT JEE FOUNDATIONCHAPTER - QUADRILATERALS EXERCISE - Olympiad/HOTS CORNER
15 Videos
- TRIANGLESBOOK - MTG IIT JEE FOUNDATIONCHAPTER - TRIANGLESEXERCISE - OLYMPAID/ HOTS CORNER
10 Videos
Similar Questions
The length of 40 leaves of a plant are measured correct to one millimeter, and the obtained data is represented in the following table:
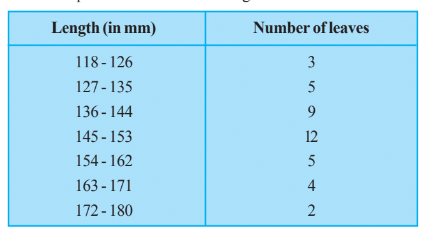
(i) Draw a histogram to represent the given data.
(ii) Is there any other suitable graphical representation for the same data?
(iii) Is it correct to conclude that the maximum number of leaves are 153 mm long?Why?
View SolutionDraw a histogram to represent the following data.

View SolutionThe length of 40 leaves of a plant measured correct to one millimetre and the obtained data is represented in the following table:

(i) Draw a histogram to represent the given data.
(ii) Is there any other suitable graphical representation for the same data?
(iii) Is it correct to conclude that the maximum number of leaves 153 mm long and why?
View SolutionThe length of 40 leaves of a plant are measured correct to one millimetre, and the obtained data is represented in the following table:
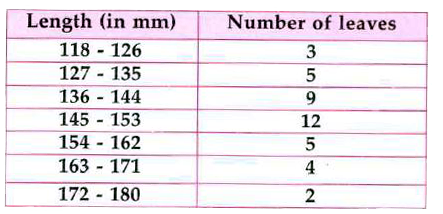
Is there any other suitable graphical representation for the same data?
View SolutionThe lengths of 62 levels of a plant are measured in millimetres and the data is represented in the following table
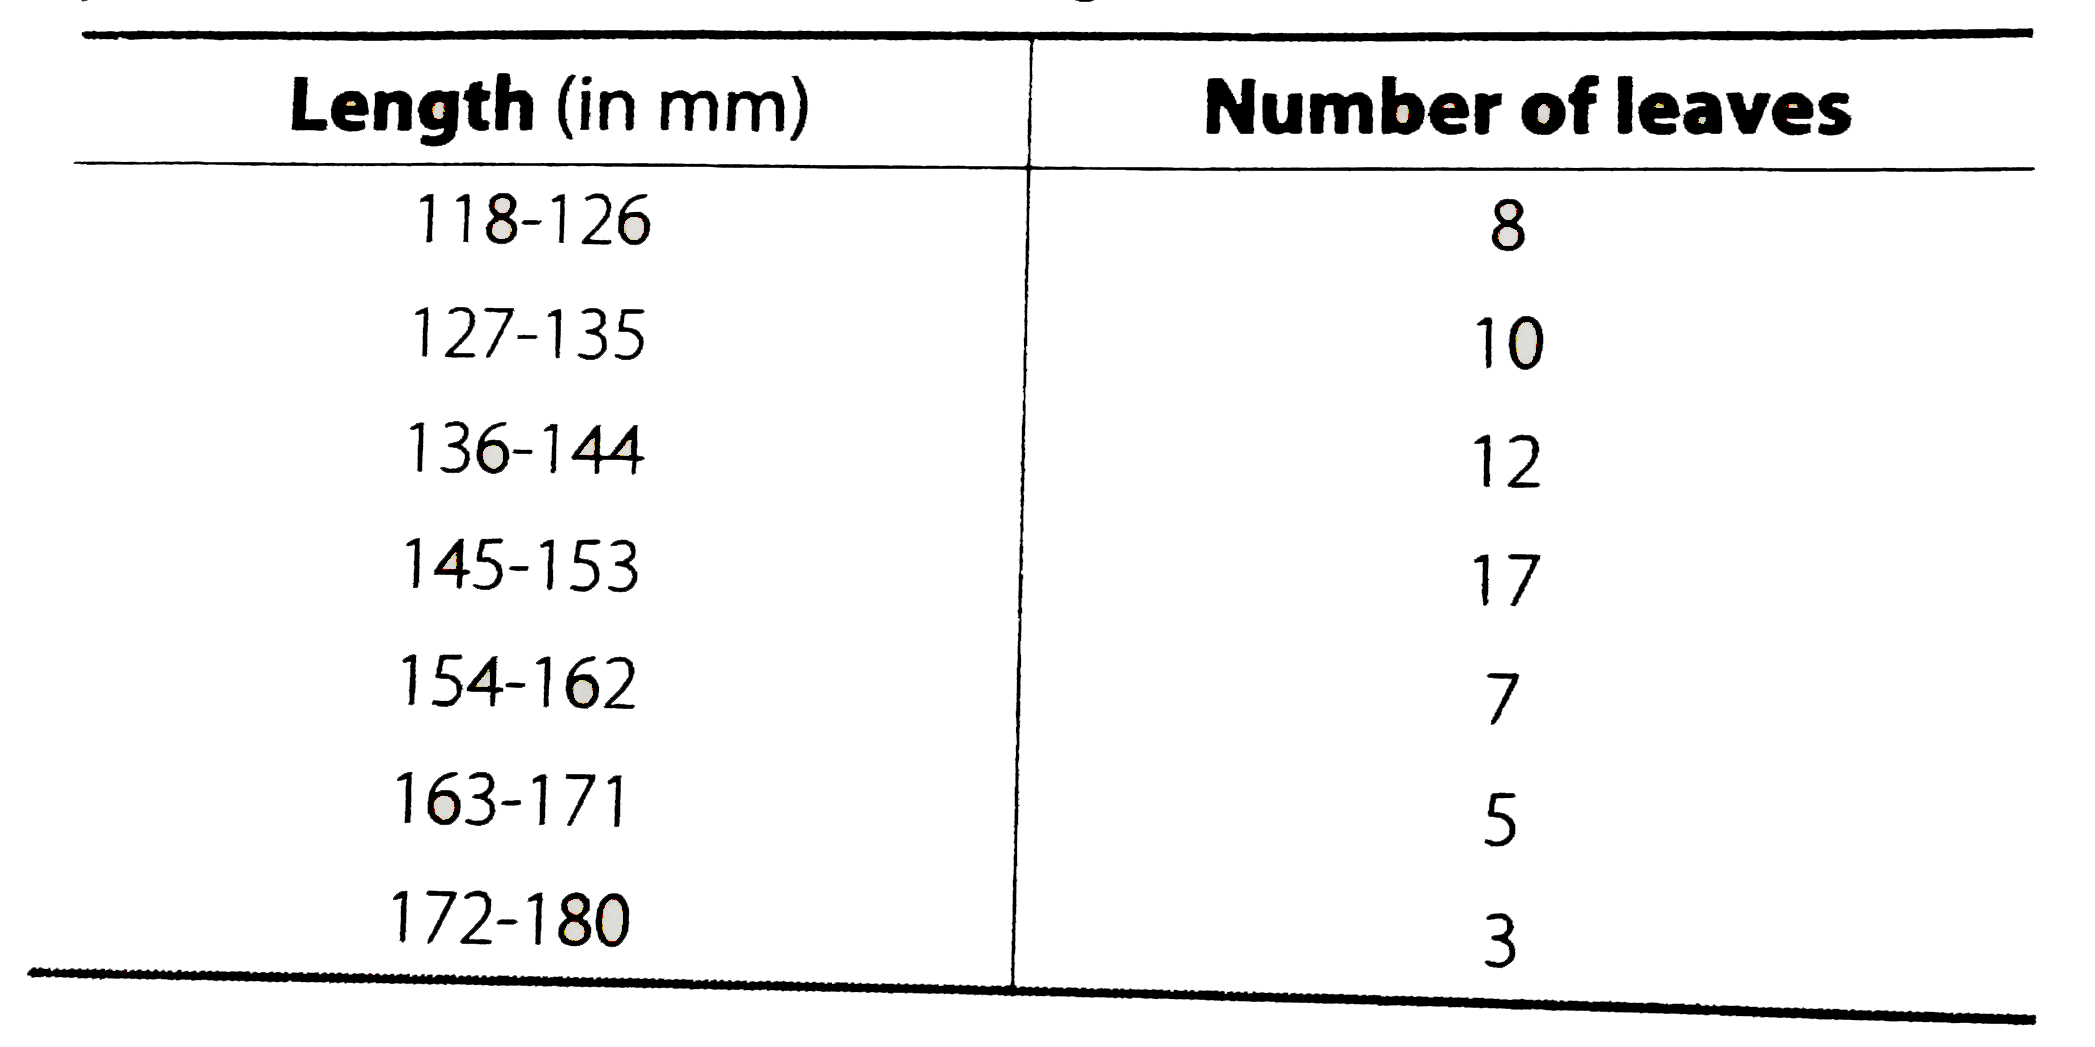
Draw a histrogram to represent the data above.
View SolutionDraw the histogram to represent the following data.

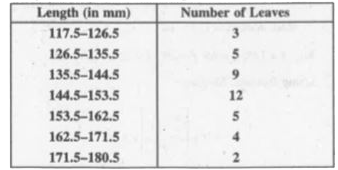
View SolutionThe lengths of 40 leaves of a plant are measured correct to the nearest millimeter and the data obtained is represented in the following table :
Find the median length of the leaves.
View SolutionThe length of 40 leaves of a plant are measured correct to one millimetre, and the obtained data is represented in the following table:
Is it correct to conclude that the maximum number of leaves are 153 mm long? Why?
View SolutionThe lengths of 40 leaves of a plant are measured correct to the nearest millimetre, and the data obtained is represented in the following table :

Find the median length of the leaves.(Hint: The data needs to be converted to continuous classes for finding the median, since the formula assumes continuous classes. The classes then change to 117.5- 126.5,126.5 - 135.5,..171.5 -180.5.)
View SolutionThe length of 40 leaves of a plant are measured correct to nearest millimetres. The data obtained is as follows :

Draw histogram to represent the given data.
View Solution
