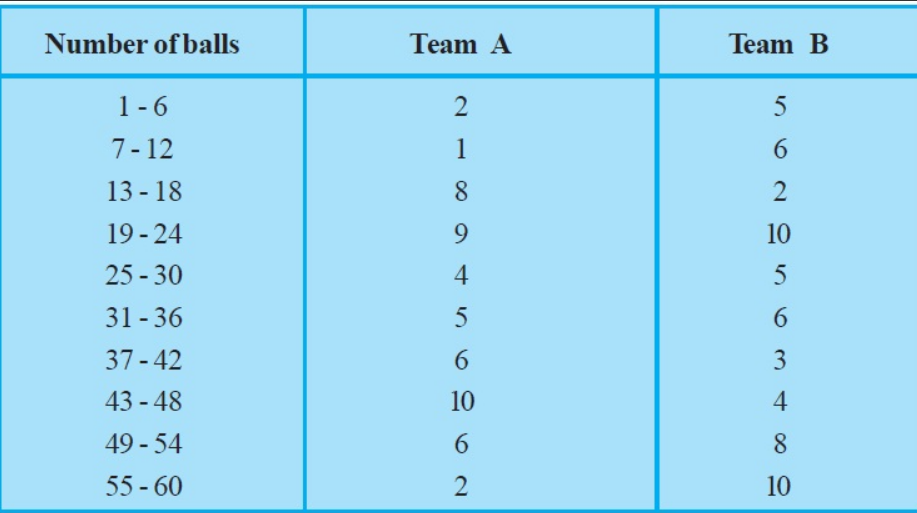
The runs scored by two teams A and B on the first 60 balls in a cricket match are given below:

Represent the data of both the teams on the same graph by frequency polygon.
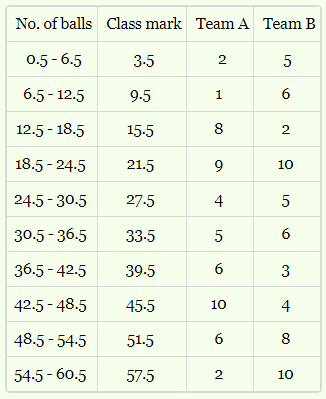
Class interval are not continuous. Because of gap of 1, 0.5 has to added and subtracted from upper and lower class limits.

The polygon graph is

Topper's Solved these Questions
- STATISTICSBOOK - NCERTCHAPTER - STATISTICSEXERCISE - EXERCISE 14.1
2 Videos
- STATISTICSBOOK - NCERTCHAPTER - STATISTICSEXERCISE - Exercise 14.2
9 Videos
- QUADRILATERALSBOOK - NCERTCHAPTER - QUADRILATERALSEXERCISE - SOLVED EXAMPLES
8 Videos
- SURFACE AREAS AND VOLUMESBOOK - NCERTCHAPTER - SURFACE AREAS AND VOLUMESEXERCISE - EXERCISE 13.8
10 Videos
Similar Questions
The runs scored by two teams A and B on the first 60 balls in a cricket match are given below:

Represent the data of both the teams on the same graph by frequency polygon.
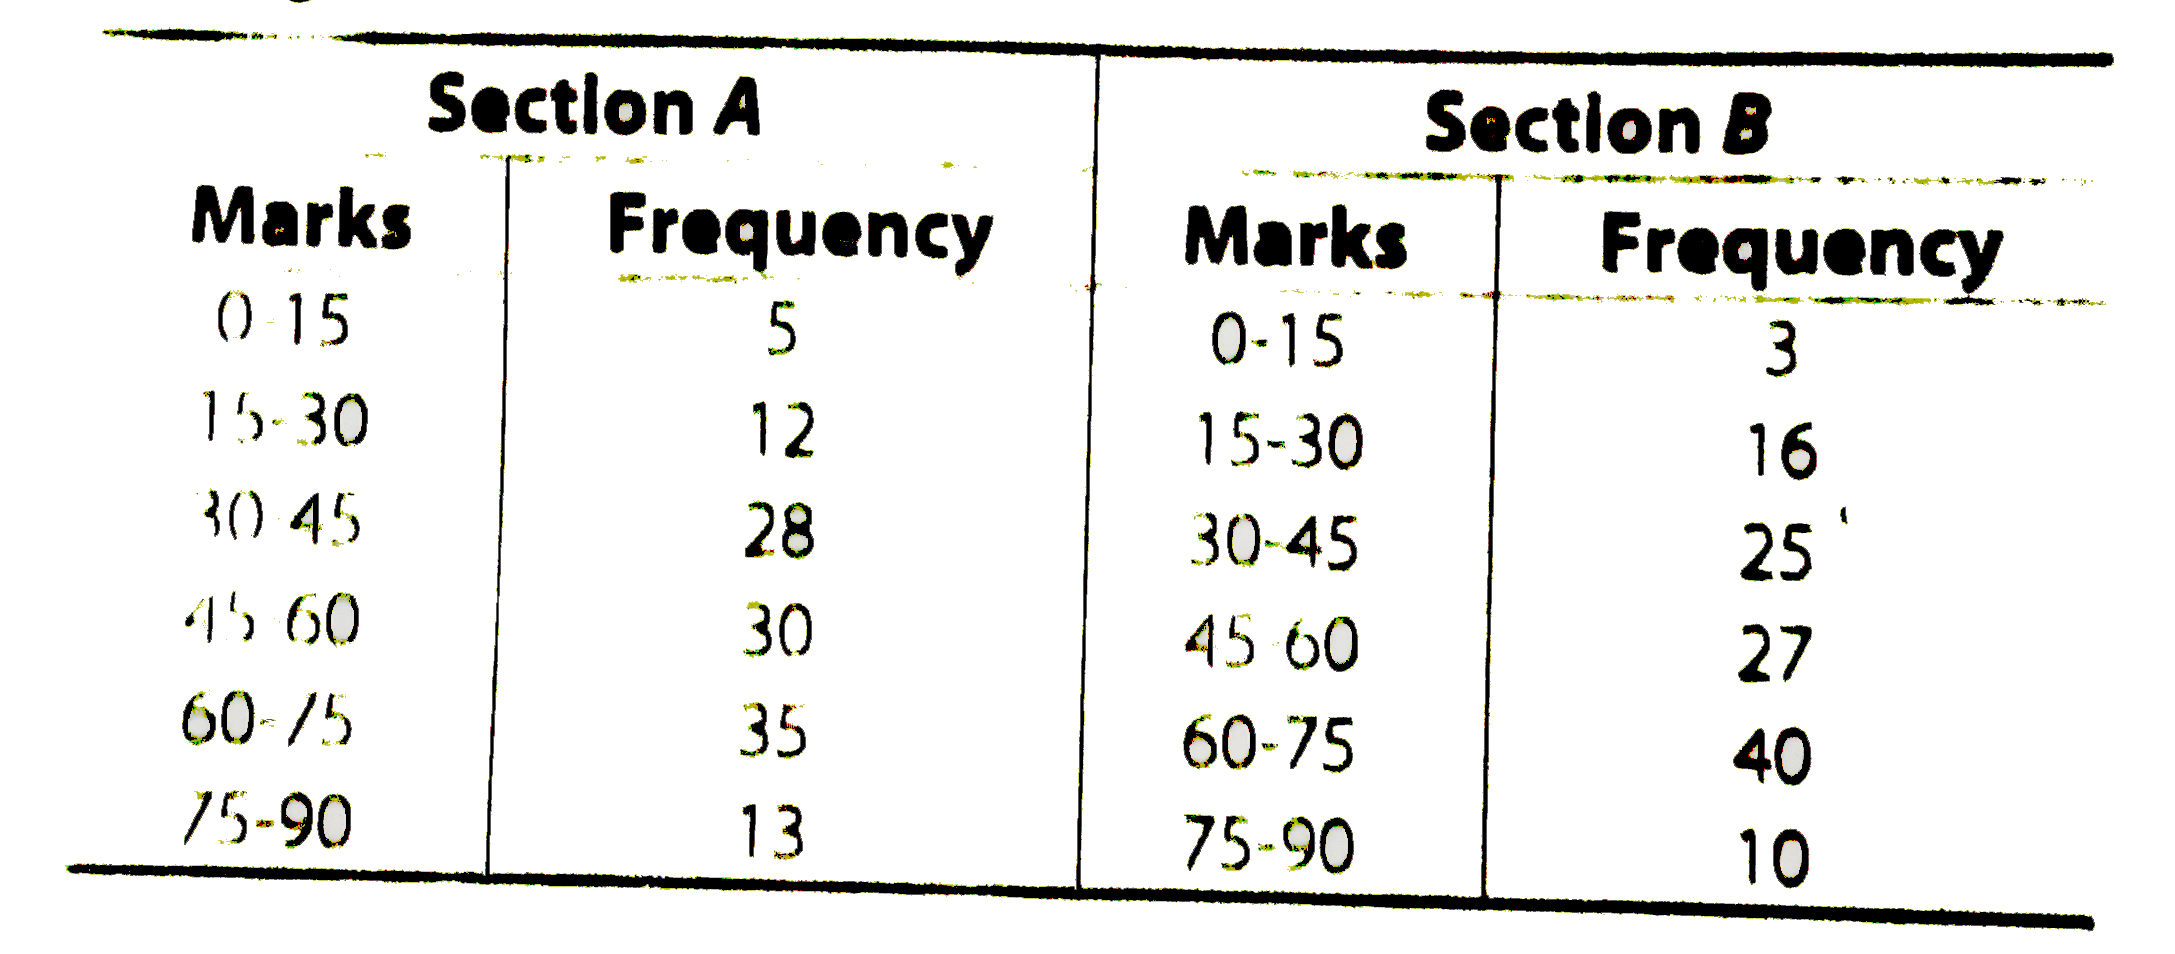
View SolutionFollowing table gives the distribution of students of sections A and B of a class according to the marks obtained by them.

Represent the marks of the students of both the sections on the same graph by two frequency polygons. What do you observe?
View Solution
Knowledge Check
Calculate median score in a cricket match between two teams:
 A40B41C42DNone
In a one-day cricket match the captain of one of the teams scored 30 runs more than the average runs scored by the remaining six batsmen of that team who batted in the match. If the total runs scored by all the batsmen of that team were 310, how many runs did the captain score? (a) 50 (b) 60 (c) 70 (d) Cannot be determined (e) None of these
A60B70C50DCannot be determinedIn a one-day cricket match the captain of one of the teams scored 30 runs more than the average runs scored by the remaining six batsmen of that team who batted in the match. If the total runs scored by all the batsmen of that team were 310, how many runs did the captain score? (a) 50 (b) 60 (c) 70 (d) Cannot be determined (e) None of these
A60B70C50DCannot be determined
The runs scored by a cricket team in first 10 overs are given below:

Draw a line graph representing the above data.
View SolutionThe following table gives the distribution of students of two sections according to the marks obtained by them. Represent the marks of the students of botht the sections on the same graph by two frequency polygon. From the two polygons compare the performance of the two sections.
View SolutionThe following table gives the distribution of students of two sections according to the marks obtained by them

Represent the marks of the students of both the sections on the same graph by two frquency polygons. From the two polygons compare the performance of the two sections.
View SolutionThe sales of a shopkeeper in the first week of january 2012, are given below :

Draw a graph representing the above data.
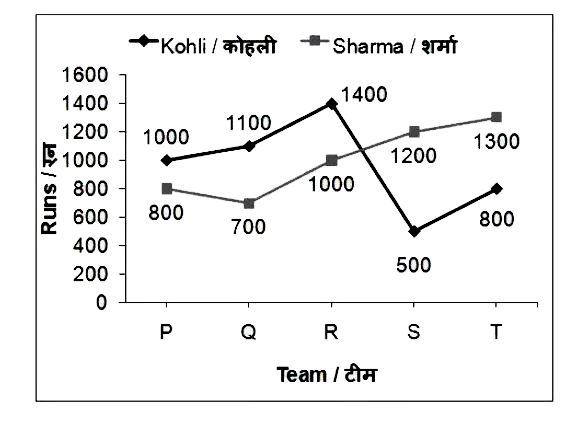
View SolutionThe line chart given below represents the runs scored by Kohli and Sharma against 5 teams.

What is the difference between the total runs scored by Kohli against the teams Q and R and total runs scored by Sharma against the teams Q and R?
View Solution
