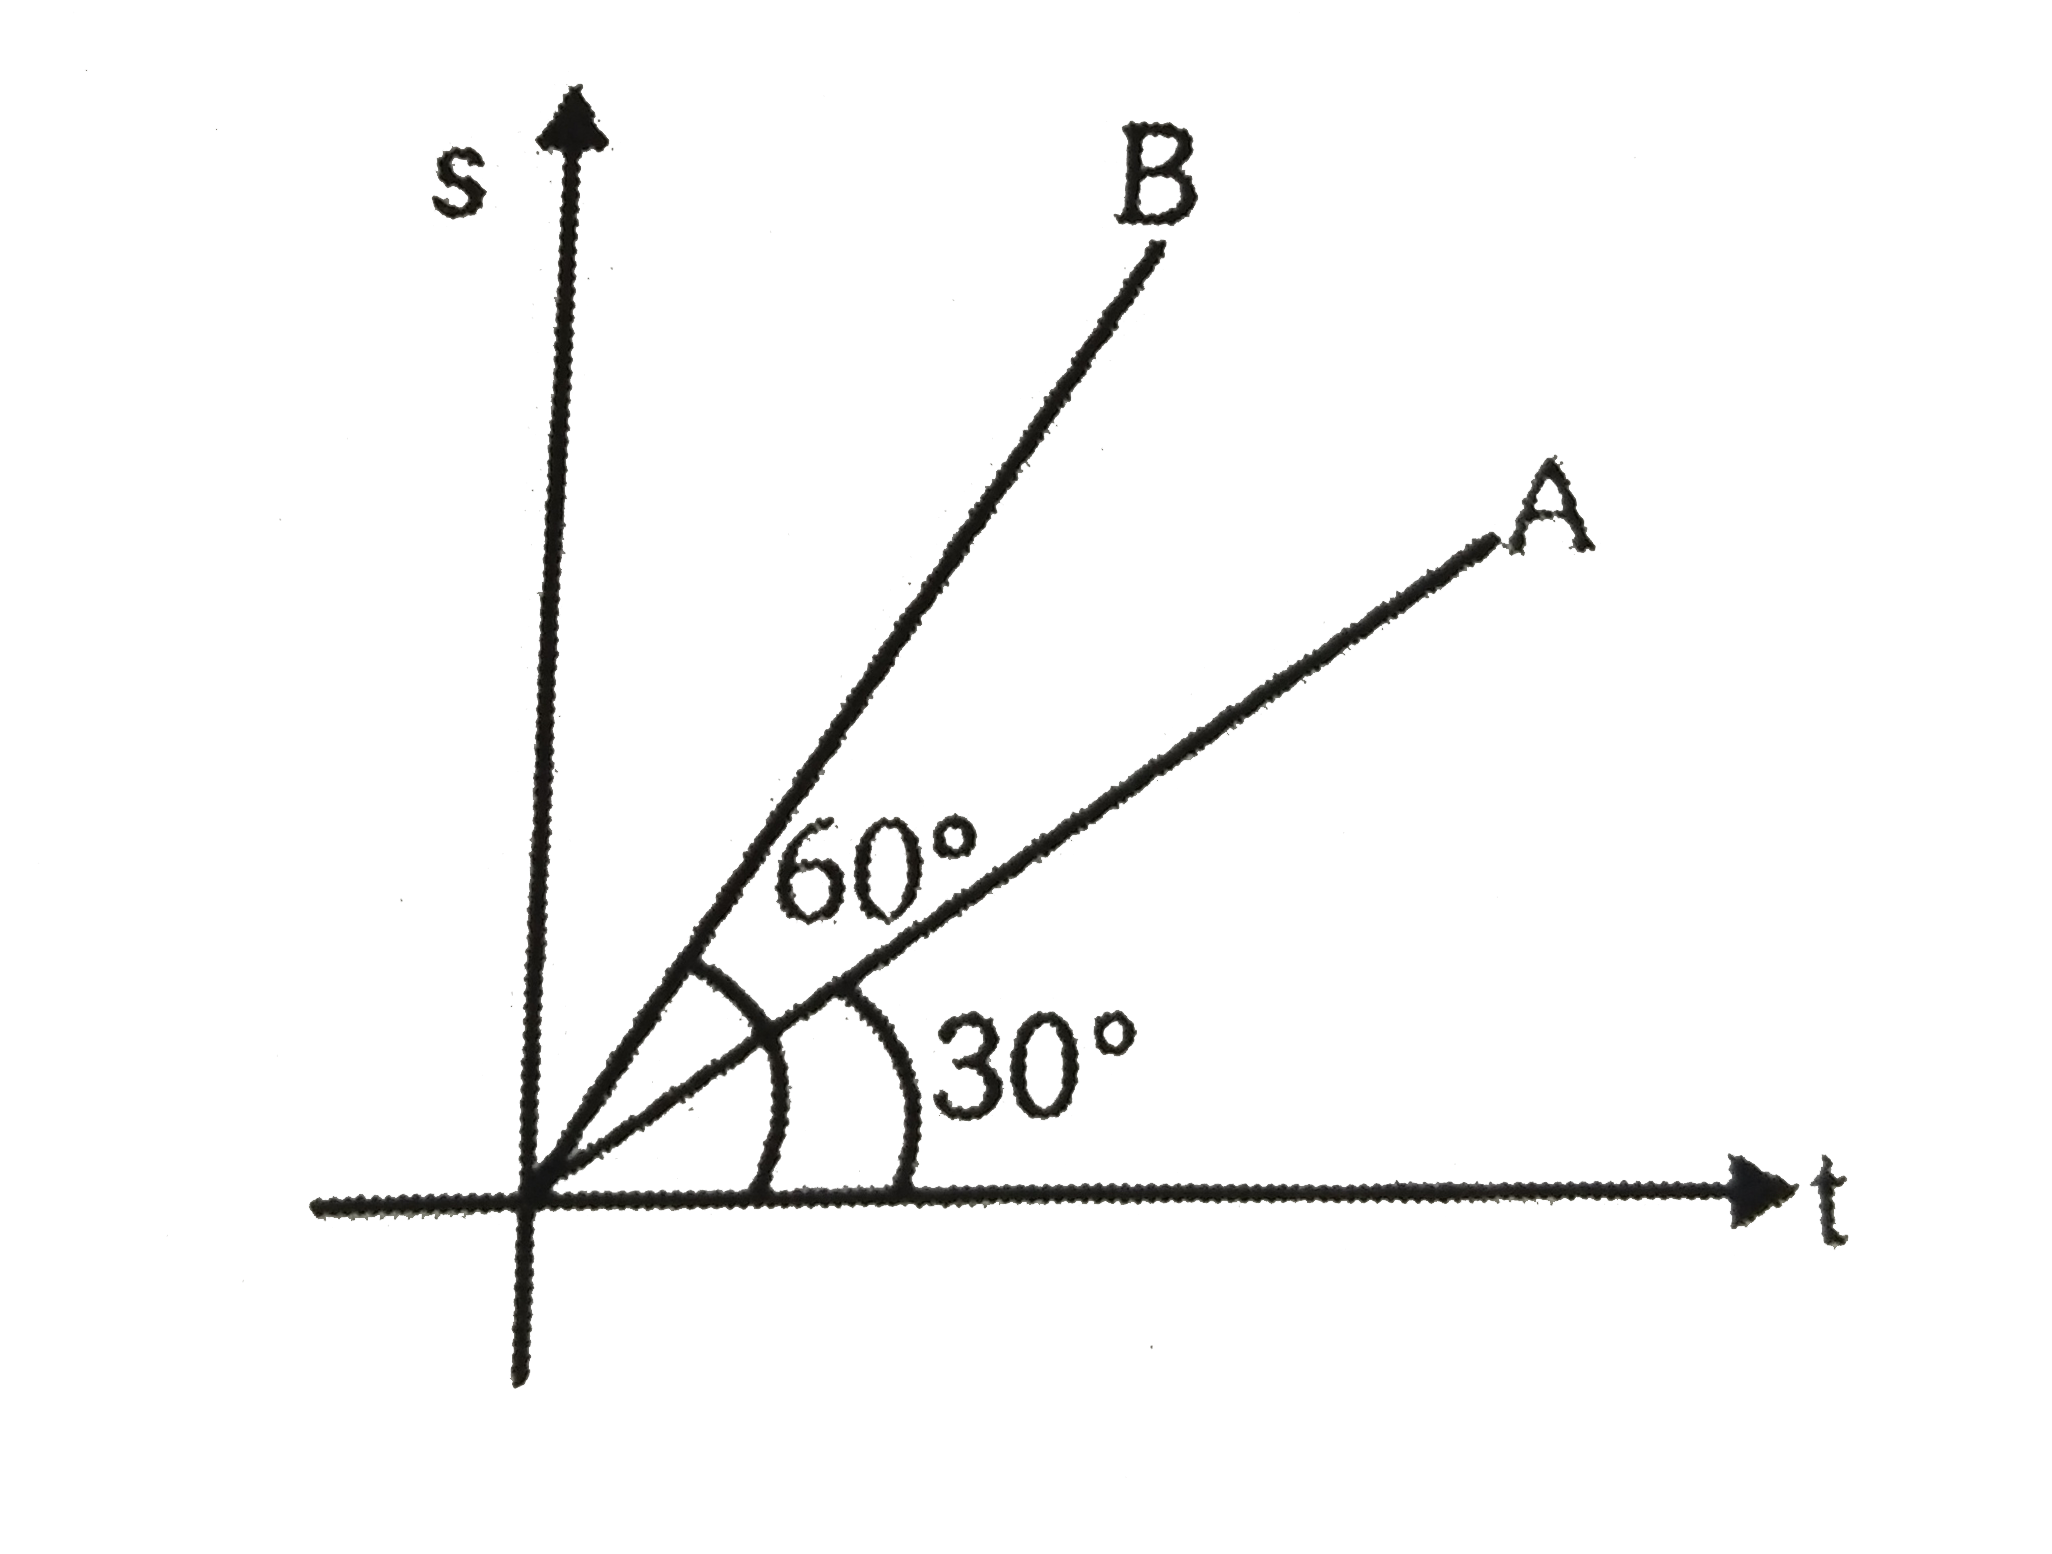
s-t graph of two particles A and B are shown in fig. Find the ratio of velocity of A to velocity of B.
Video Solution
Text Solution
Velocity = Slope of s - t curve
So vAvB=Slope of ASlope of B=tan30∘tan60∘=13
|
Topper's Solved these Questions
- KINEMATICS (MOTION ALONG A STRAIGHT LINE AND MOTION IN A PLANE)BOOK - ALLENCHAPTER - KINEMATICS (MOTION ALONG A STRAIGHT LINE AND MOTION IN A PLANE)EXERCISE - BEGINNER S BOX-6
9 Videos
- KINEMATICS (MOTION ALONG A STRAIGHT LINE AND MOTION IN A PLANE)BOOK - ALLENCHAPTER - KINEMATICS (MOTION ALONG A STRAIGHT LINE AND MOTION IN A PLANE)EXERCISE - BEGINNER S BOX-7
8 Videos
- KINEMATICS (MOTION ALONG A STRAIGHT LINE AND MOTION IN A PLANE)BOOK - ALLENCHAPTER - KINEMATICS (MOTION ALONG A STRAIGHT LINE AND MOTION IN A PLANE)EXERCISE - BEGINNER S BOX-4
6 Videos
- KINEMATICSBOOK - ALLENCHAPTER - KINEMATICSEXERCISE - Integer Type Question
3 Videos
- MISCELLANEOUSBOOK - ALLENCHAPTER - MISCELLANEOUSEXERCISE - SUBJECTIVE QUESTION
9 Videos
Similar Questions
Knowledge Check
The displacement time graphs of two bodies A and B are shown in figure. The ratio of velocity of A to velocity of B,vA/vB is:
 A1√3B√3C13D3
The velocity - time graph for two bodies A and B are shown in figure. Then, the acceleration of A and B are in the ratio
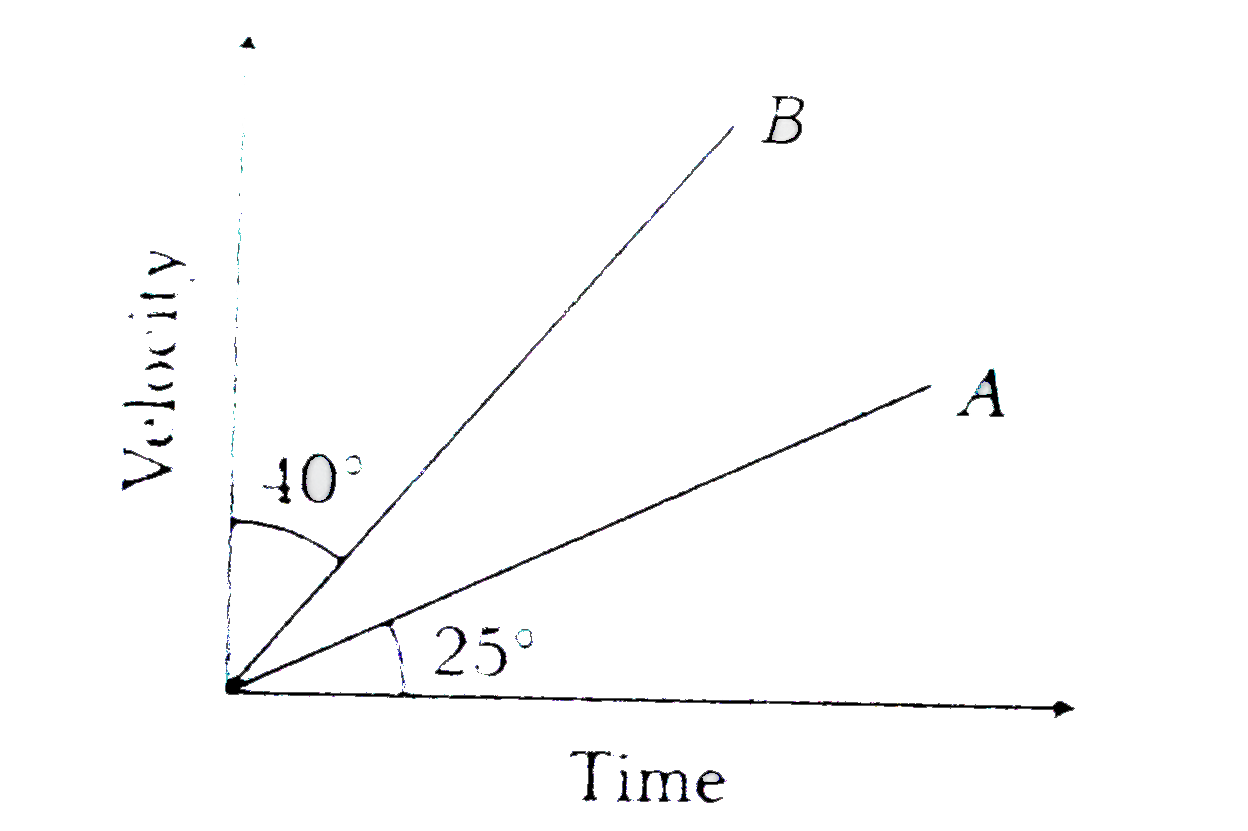 Asin25∘ to sin50∘Btan25∘ to tan40∘Ccos25∘ to cos50∘Dtan25∘ to tan50∘
The velocity − time graph of a particle is as shown in figure
 AIt moves with a constant acceleration throughoutBIt moves with an acceleration of constant magnitude but changing direction at the end of every two secondCThe displacement of the particle is zeroDThe velocity becomes zero at t=4 second
The displacement-time graph for two particles is as shown. Find the ratio of their velocities.
View Solutions-t graph of a particle in motion is shown in Fig. Calculate
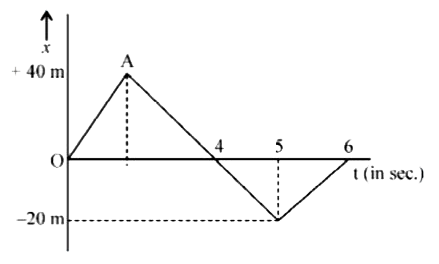
Average speed
View SolutionThe displacement-time graph of two particles A and B are straight line making angle of 60∘ and 45∘ with x-axis respectively. Then find the ratio of velocity of A and velocity of B.
View Solutions-t graph of a particle in motion is shown in Fig. Calculate
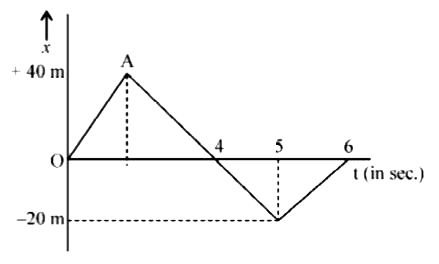
Displacement
View SolutionAcceleration-time graph of a particle moving in a straight line is as shown in figure. At time t=0, velocity of the particle is zero. Find
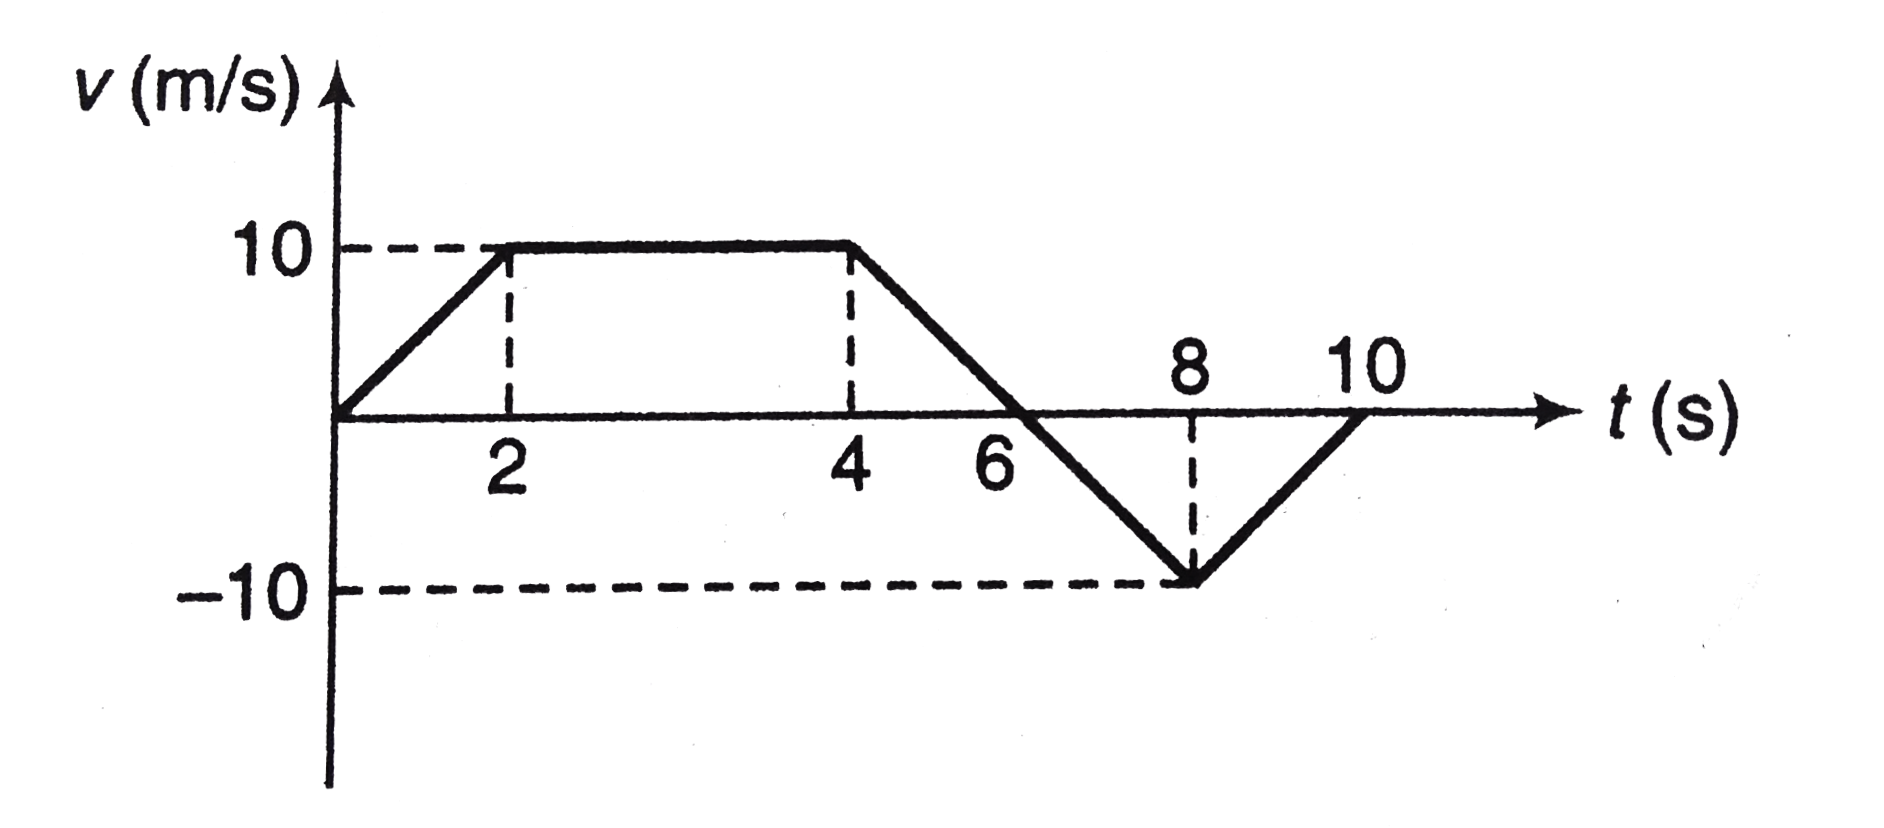
(a) average acceleration in a time interval from t=6s to t=12s,
(b) velocity of the particle at t=14s.
View Solution
