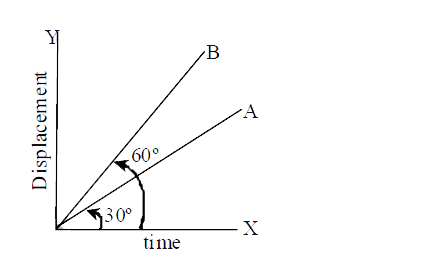
The displacement-time graph for two particles is as shown. Find the ratio of their velocities.
To find the ratio of the velocities of two particles based on their displacement-time graph, we can follow these steps:
1. Understand the Displacement-Time Graph:
- The displacement-time graph shows how the displacement (S) of two particles changes over time (t). The slope of the graph at any point gives the velocity of the particle.
2. Identify the Slopes:
- Let’s denote the first particle's displacement-time graph as S1 and the second particle's graph as S2.
- The slope of the graph S1 is denoted as M1 and the slope of the graph S2 is denoted as M2.
3. Calculate the Velocities:
- The velocity V1 of the first particle can be found using the slope M1. If the angle θ1 that the slope makes with the time axis is 30 degrees, then:
V1=tan(30∘)=1√3
- Similarly, for the second particle, if the angle θ2 is 60 degrees, then:
V2=tan(60∘)=√3
4. Find the Ratio of Velocities:
- To find the ratio of the velocities V1V2:
V1V2=1√3√3=13
5. Final Answer:
- The ratio of the velocities of the two particles is:
V1:V2=1:3
- The displacement-time graph shows how the displacement (S) of two particles changes over time (t). The slope of the graph at any point gives the velocity of the particle.
- Let’s denote the first particle's displacement-time graph as S1 and the second particle's graph as S2.
- The slope of the graph S1 is denoted as M1 and the slope of the graph S2 is denoted as M2.
- The velocity V1 of the first particle can be found using the slope M1. If the angle θ1 that the slope makes with the time axis is 30 degrees, then:
V1=tan(30∘)=1√3
- Similarly, for the second particle, if the angle θ2 is 60 degrees, then:
V2=tan(60∘)=√3
- To find the ratio of the velocities V1V2:
V1V2=1√3√3=13
- The ratio of the velocities of the two particles is:
V1:V2=1:3
Topper's Solved these Questions
Similar Questions
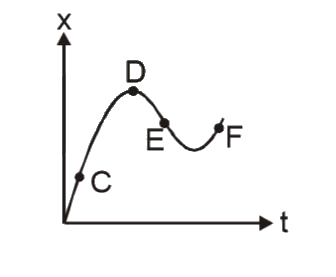
The displacement-time graph of a moving particle is shown in the figure. The velocity of the particle is zero at the point ______.

View SolutionThe displacement-time graph for a particle moving in a straight line is as shown in the figure. Determine the velocity of the particle at t=1s,3s and 6s. Sketch the velocity-time graph.
View Solution
Knowledge Check
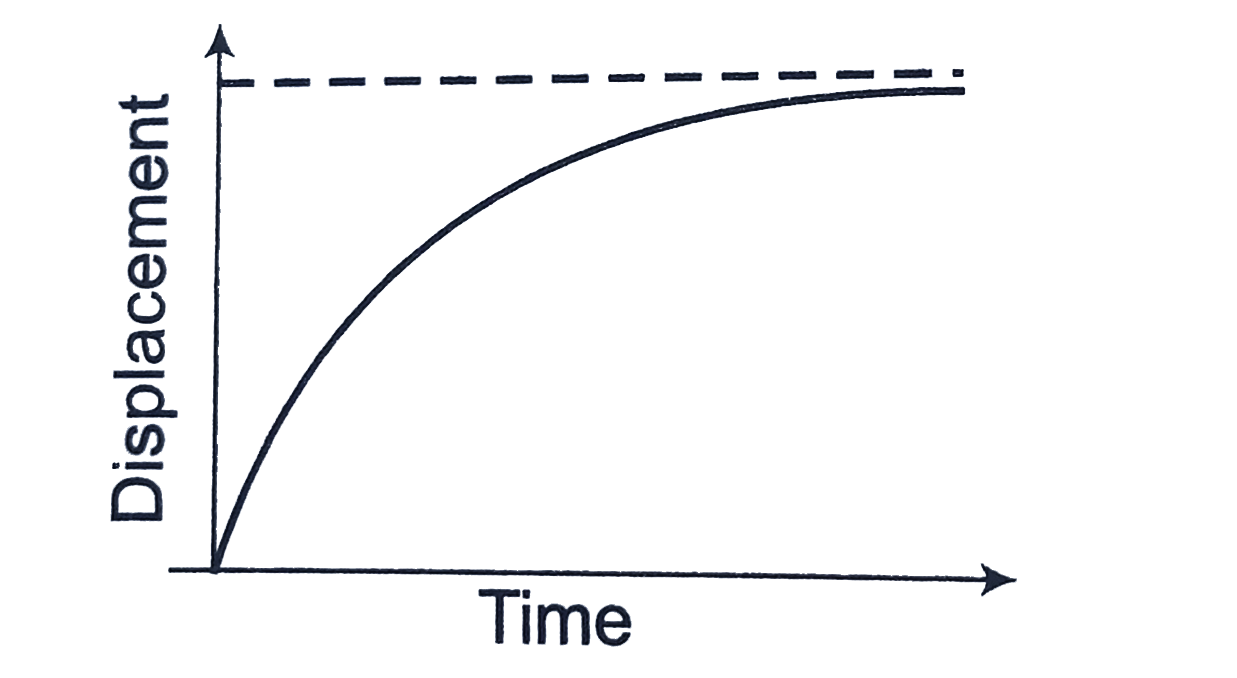
The displacement-time graph of a particle is as shown below. It indicates that
 Athe particle starts with a certain velocity but the motion is retarded and finally the particle stopsBthe velocity of the particle is constant throufgoutCthe acceleration of the particle is constant throughoutDthe particle starts with a velocity, the motion is accelerated and finally the particle moves with a constant velocity
From the adjoining displacement-time graph for two particles A & B the ratio of velocitiesvA:vB will betime
 A1:2B1:√3C√3:1D1:3
The displacement time graphs of two bodies A and B are shown in figure. The ratio of velocity of A to velocity of B,vA/vB is:
 A1√3B√3C13D3
If the displacement-time graph for a particle is parallel to time-axis, how much is the velocity of the particle ?
View SolutionThe velocity − time graph of a particle is as shown in figure

View SolutionThe velocity -displacement graph of a particle is as shown in the figure. Which of the following graphs correctly represents the variation of acceleration with displacement?

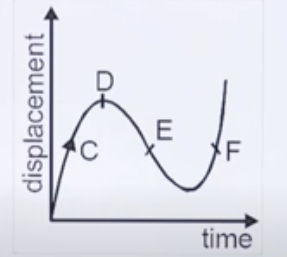
View SolutionThe displacement-time graph of a moving particle is shown below. The instantaneous velocity of the particle is negative at the point
View SolutionThe displacement-time graph of a moving particle is shown below. The instantaneous velocity of the particle is negative at the point

View Solution


