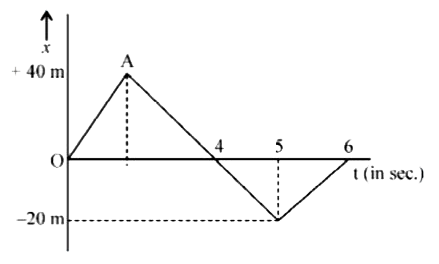
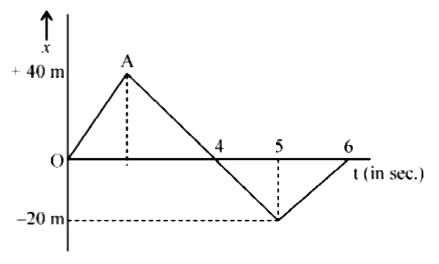
Position-time graph of a particle in motion is shown in fig. Calculate -
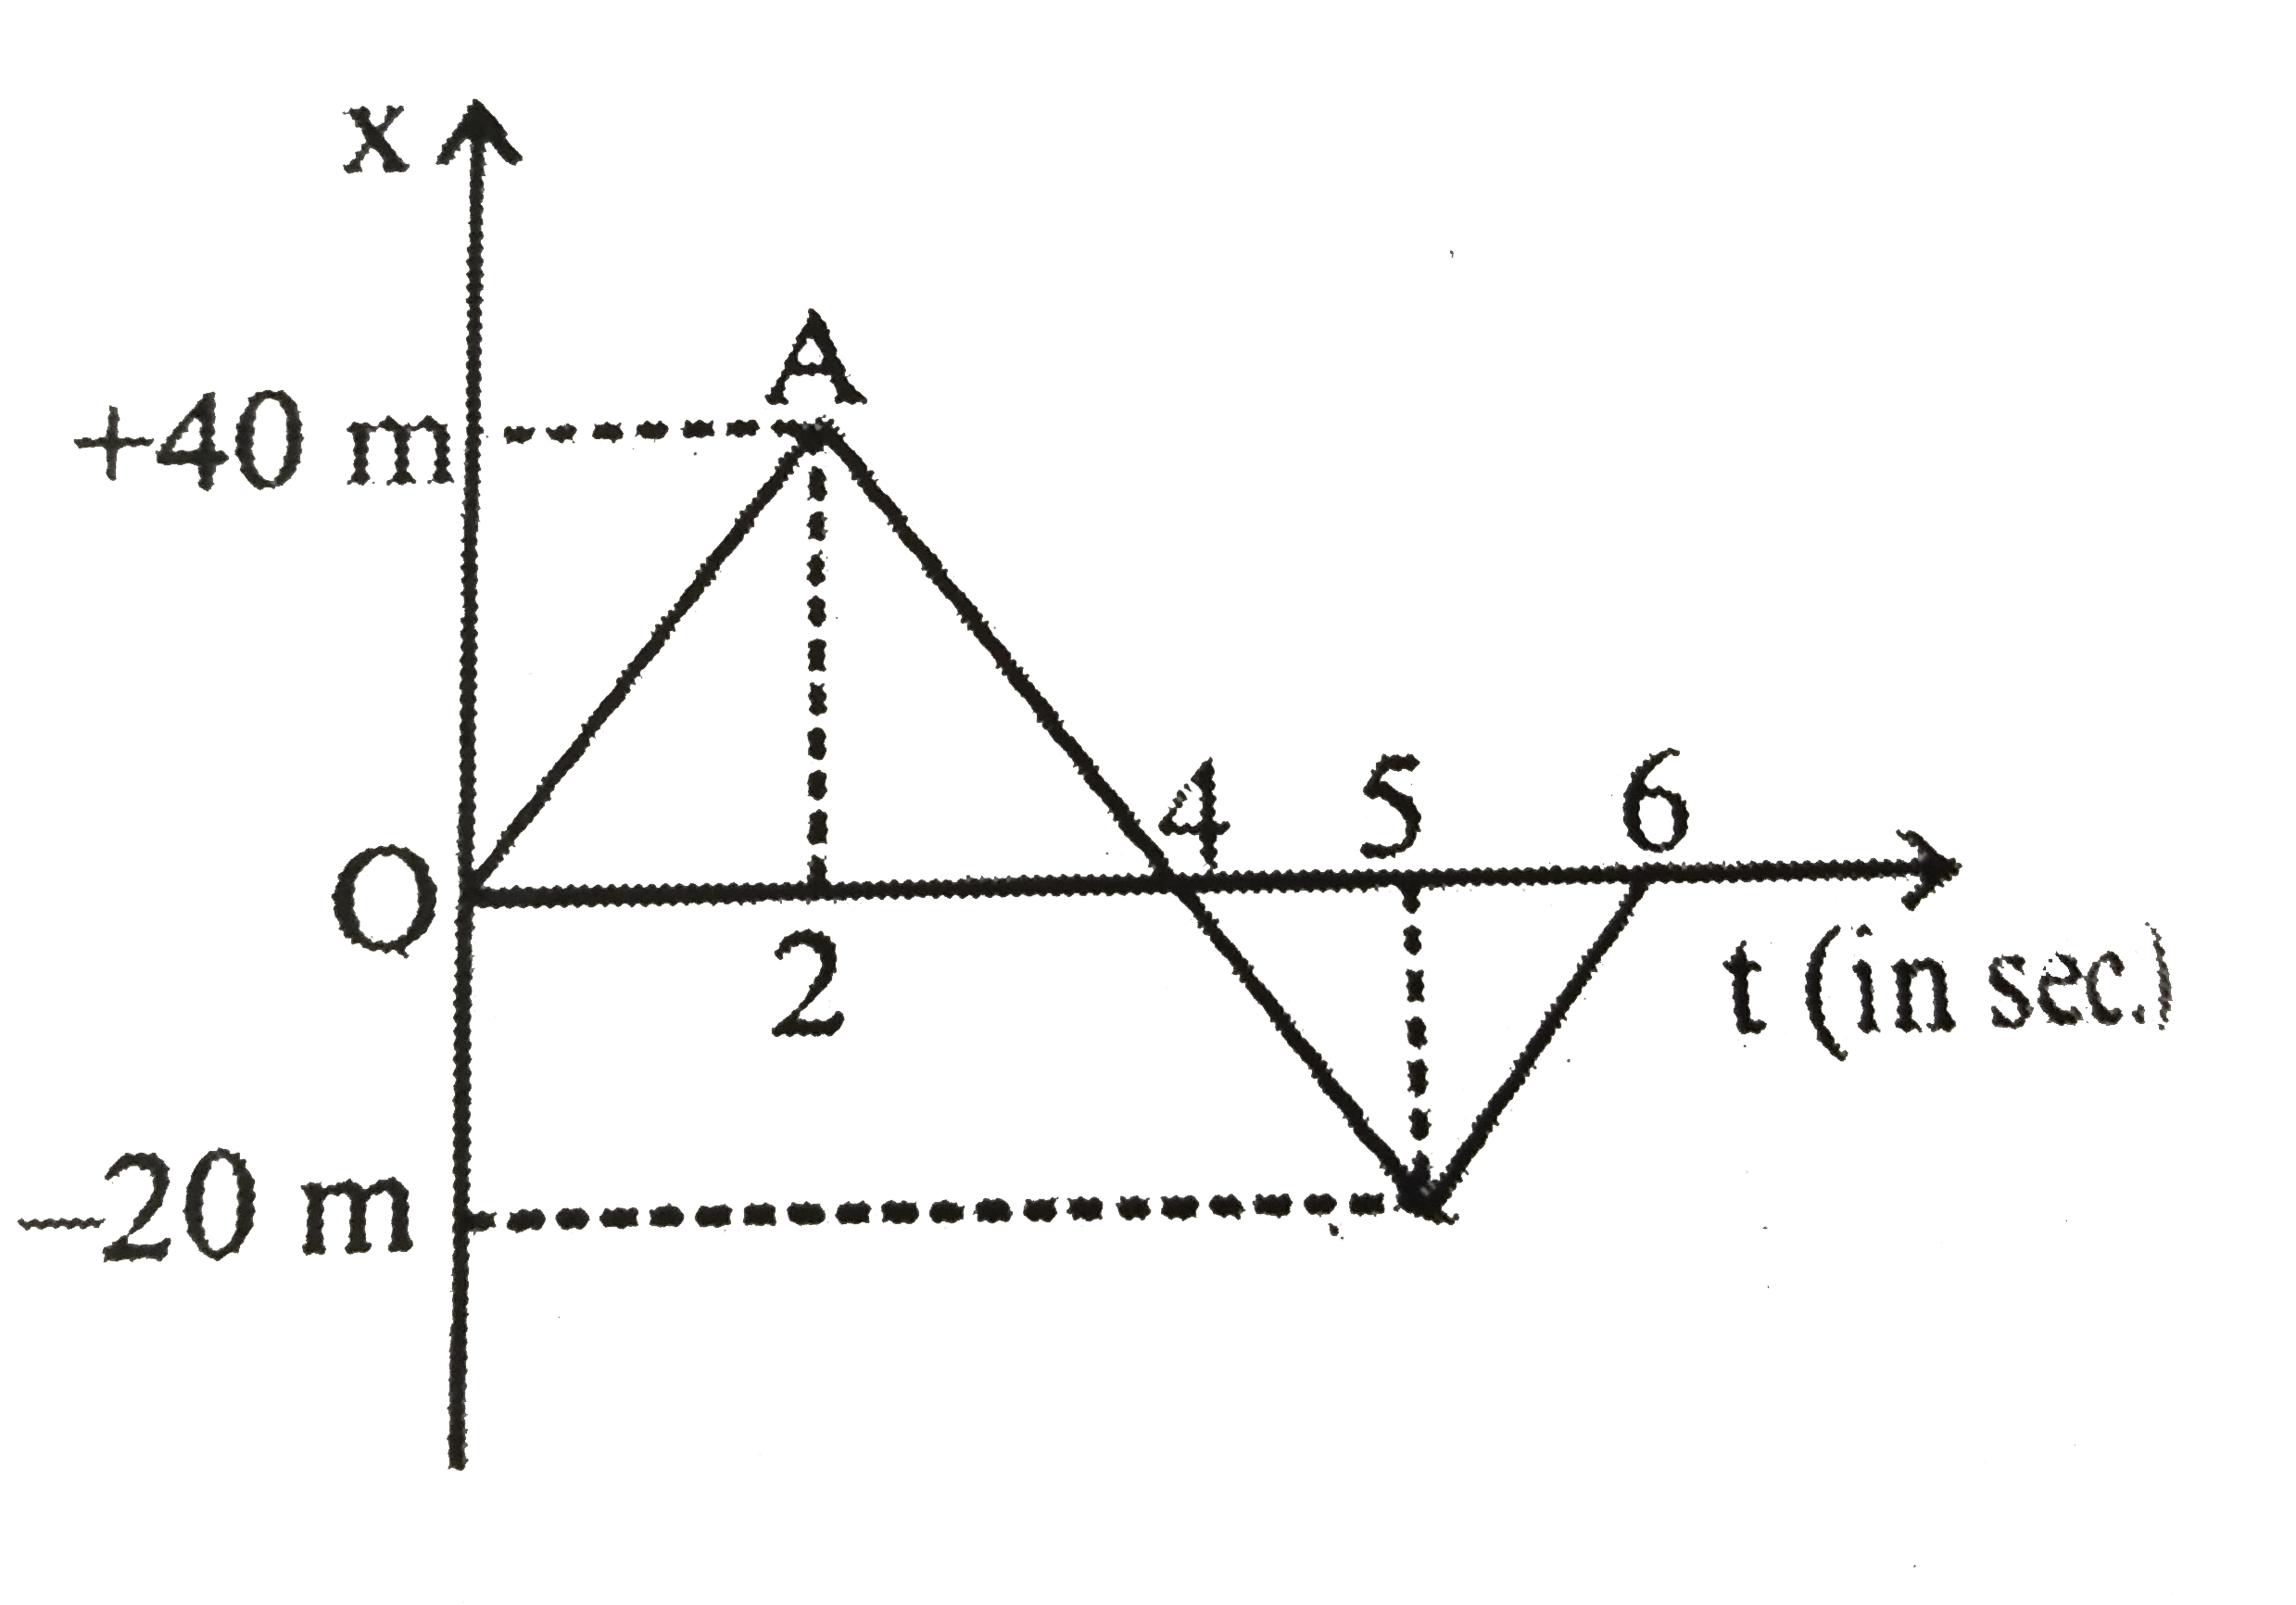
(i) Total distance covered
(ii) Displacement
(iii) Average speed
(iv) Average velocity.
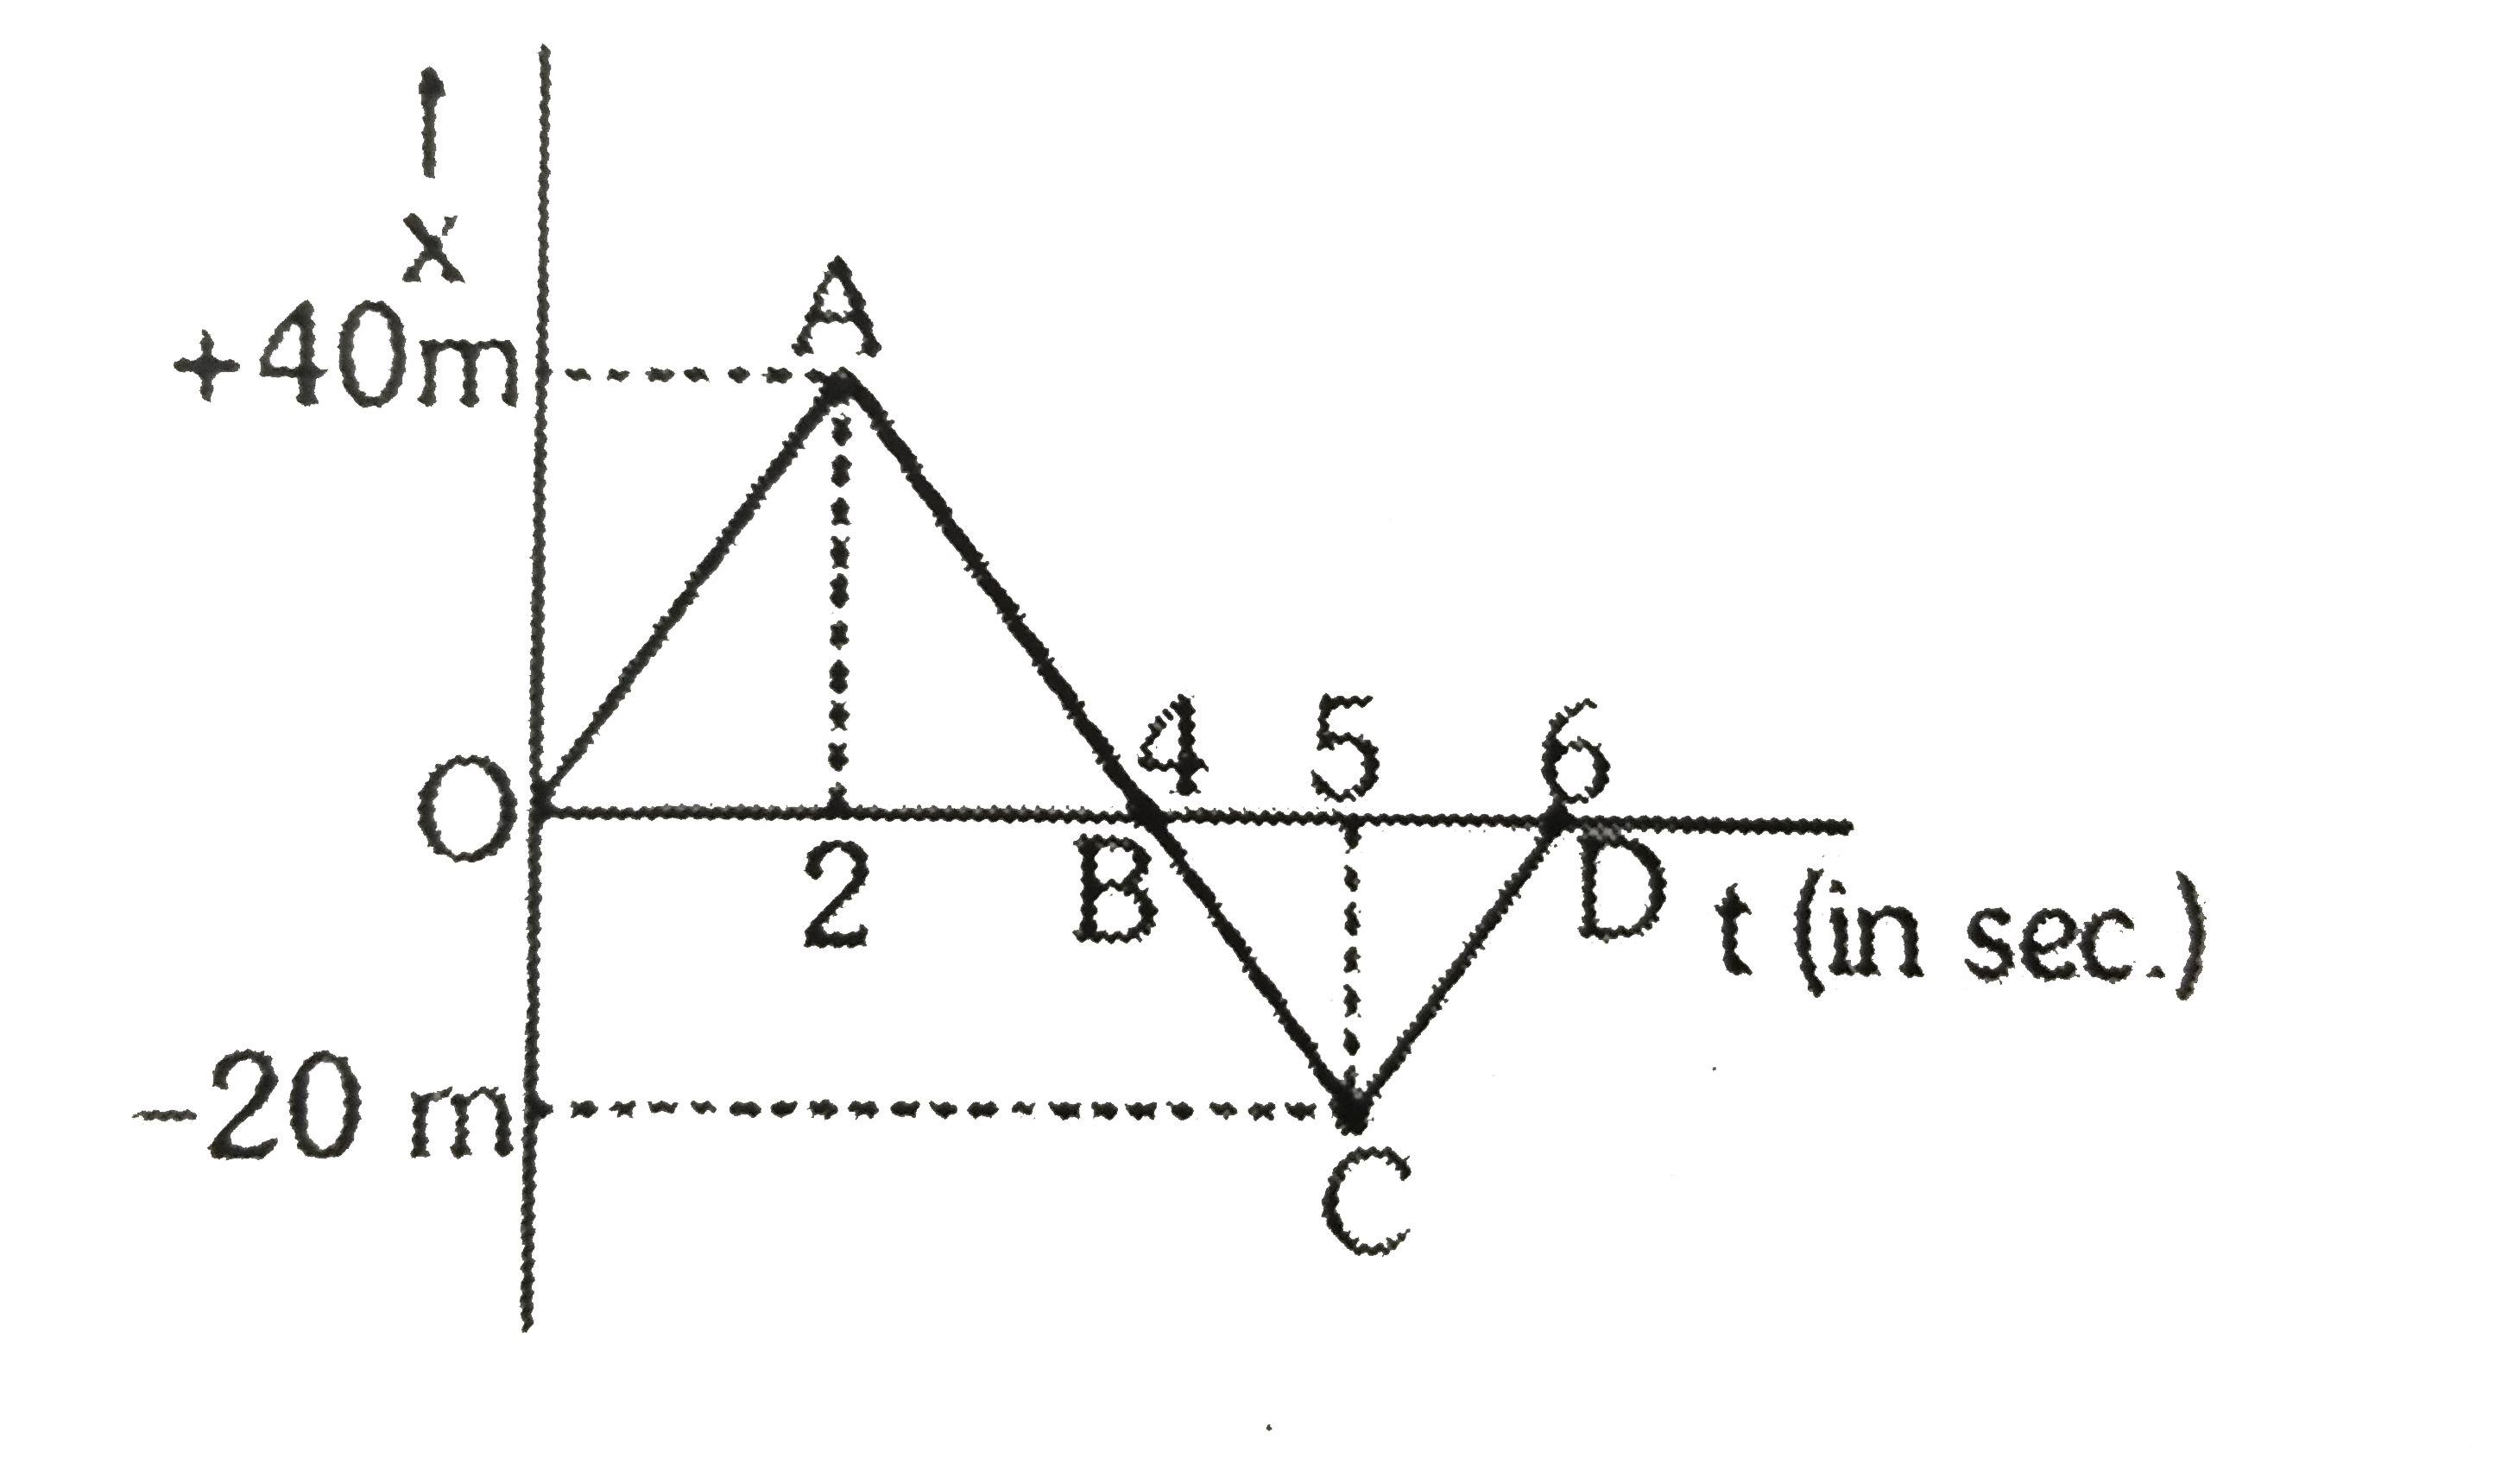
(i) Total distance tavelled ltBrgt =xOA+xAB+xBC+xCD
=40+40+20+20=120 m
(ii) Displacement = final position - initial position
=xD−xO=0−0=0
(iii) Average speed = Total distanceTotal time=1206=20m/s
(iv) Average velocity = displacementTime=06=0m/s
Topper's Solved these Questions
- KINEMATICS (MOTION ALONG A STRAIGHT LINE AND MOTION IN A PLANE)BOOK - ALLENCHAPTER - KINEMATICS (MOTION ALONG A STRAIGHT LINE AND MOTION IN A PLANE)EXERCISE - BEGINNER S BOX-6
9 Videos
- KINEMATICS (MOTION ALONG A STRAIGHT LINE AND MOTION IN A PLANE)BOOK - ALLENCHAPTER - KINEMATICS (MOTION ALONG A STRAIGHT LINE AND MOTION IN A PLANE)EXERCISE - BEGINNER S BOX-7
8 Videos
- KINEMATICS (MOTION ALONG A STRAIGHT LINE AND MOTION IN A PLANE)BOOK - ALLENCHAPTER - KINEMATICS (MOTION ALONG A STRAIGHT LINE AND MOTION IN A PLANE)EXERCISE - BEGINNER S BOX-4
6 Videos
- KINEMATICSBOOK - ALLENCHAPTER - KINEMATICSEXERCISE - Integer Type Question
3 Videos
- MISCELLANEOUSBOOK - ALLENCHAPTER - MISCELLANEOUSEXERCISE - SUBJECTIVE QUESTION
9 Videos
Similar Questions
Knowledge Check
Position - time graph for a particle is shown in figure. Starting from t = 0, at what time t, the average velocity is zer?
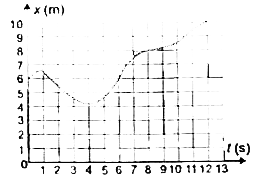 A1 sB3 sC6 sD7 s
velocity time graph of a particle is shown in figure. Find displacement of the particle.
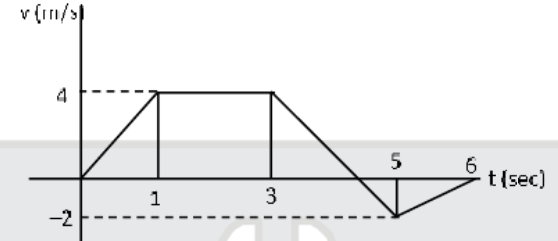 A7B11C5D15
s-t graph of a particle in motion is shown in Fig. Calculate
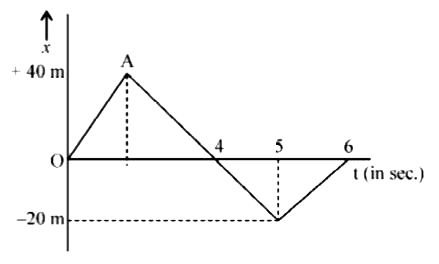
Displacement
View Solutions-t graph of a particle in motion is shown in Fig. Calculate
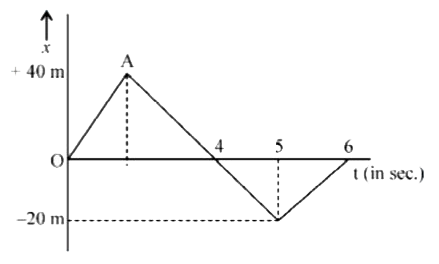
Average velocity
View SolutionA cyclist moving an a circular track of radius 50m completes one revolution in 2minutes. What is his (i) distance covered (ii) dislacement (iii) average speed (iv) average velocity, in one full revolution.
View SolutionA particle moves on straight line according to the velocity-time graph shown in fig. Calculate -
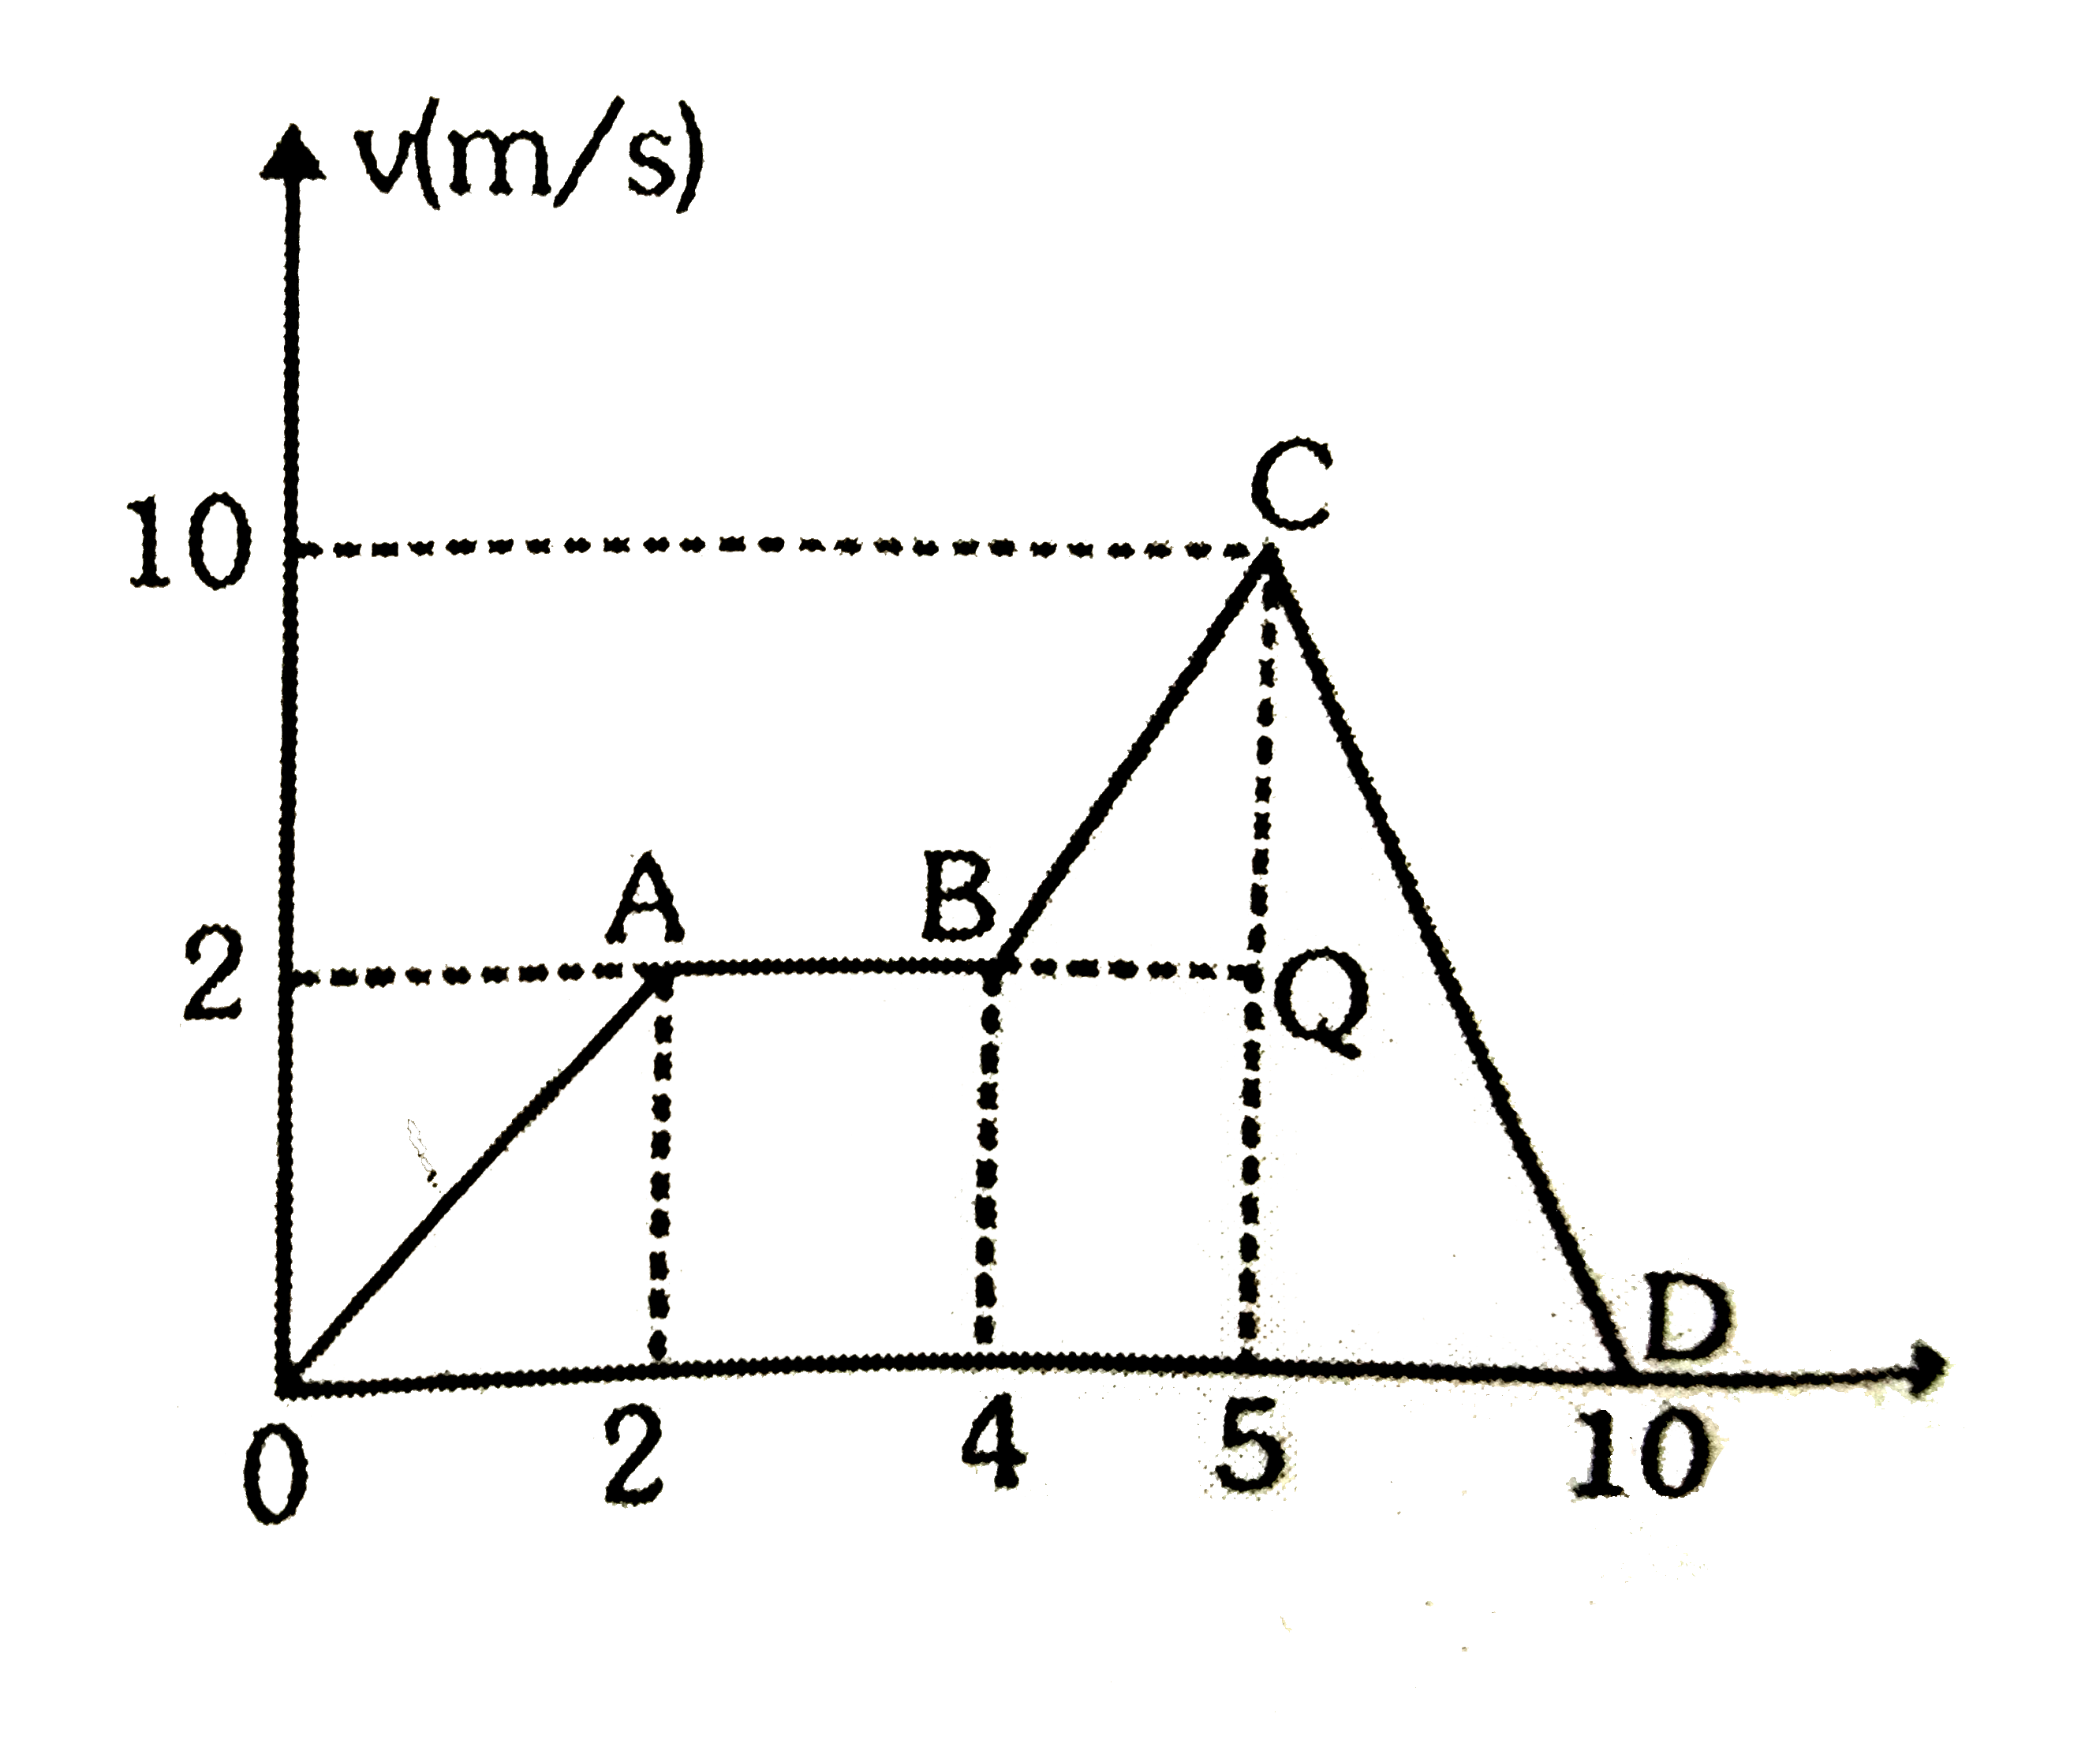
(i) Total distance covered
(ii) Average speed
(iii) In which part of the graph the acceleration is maximum and also find its value.
(iv) Retardation
View SolutionA cyclist moves along a circular path of radius 70 m. If he completes one round in 11 s, calculate (i) total length of path, (ii) magnitude of the displacement, (iii) average speed, and (iv) magnitude of average velocity.
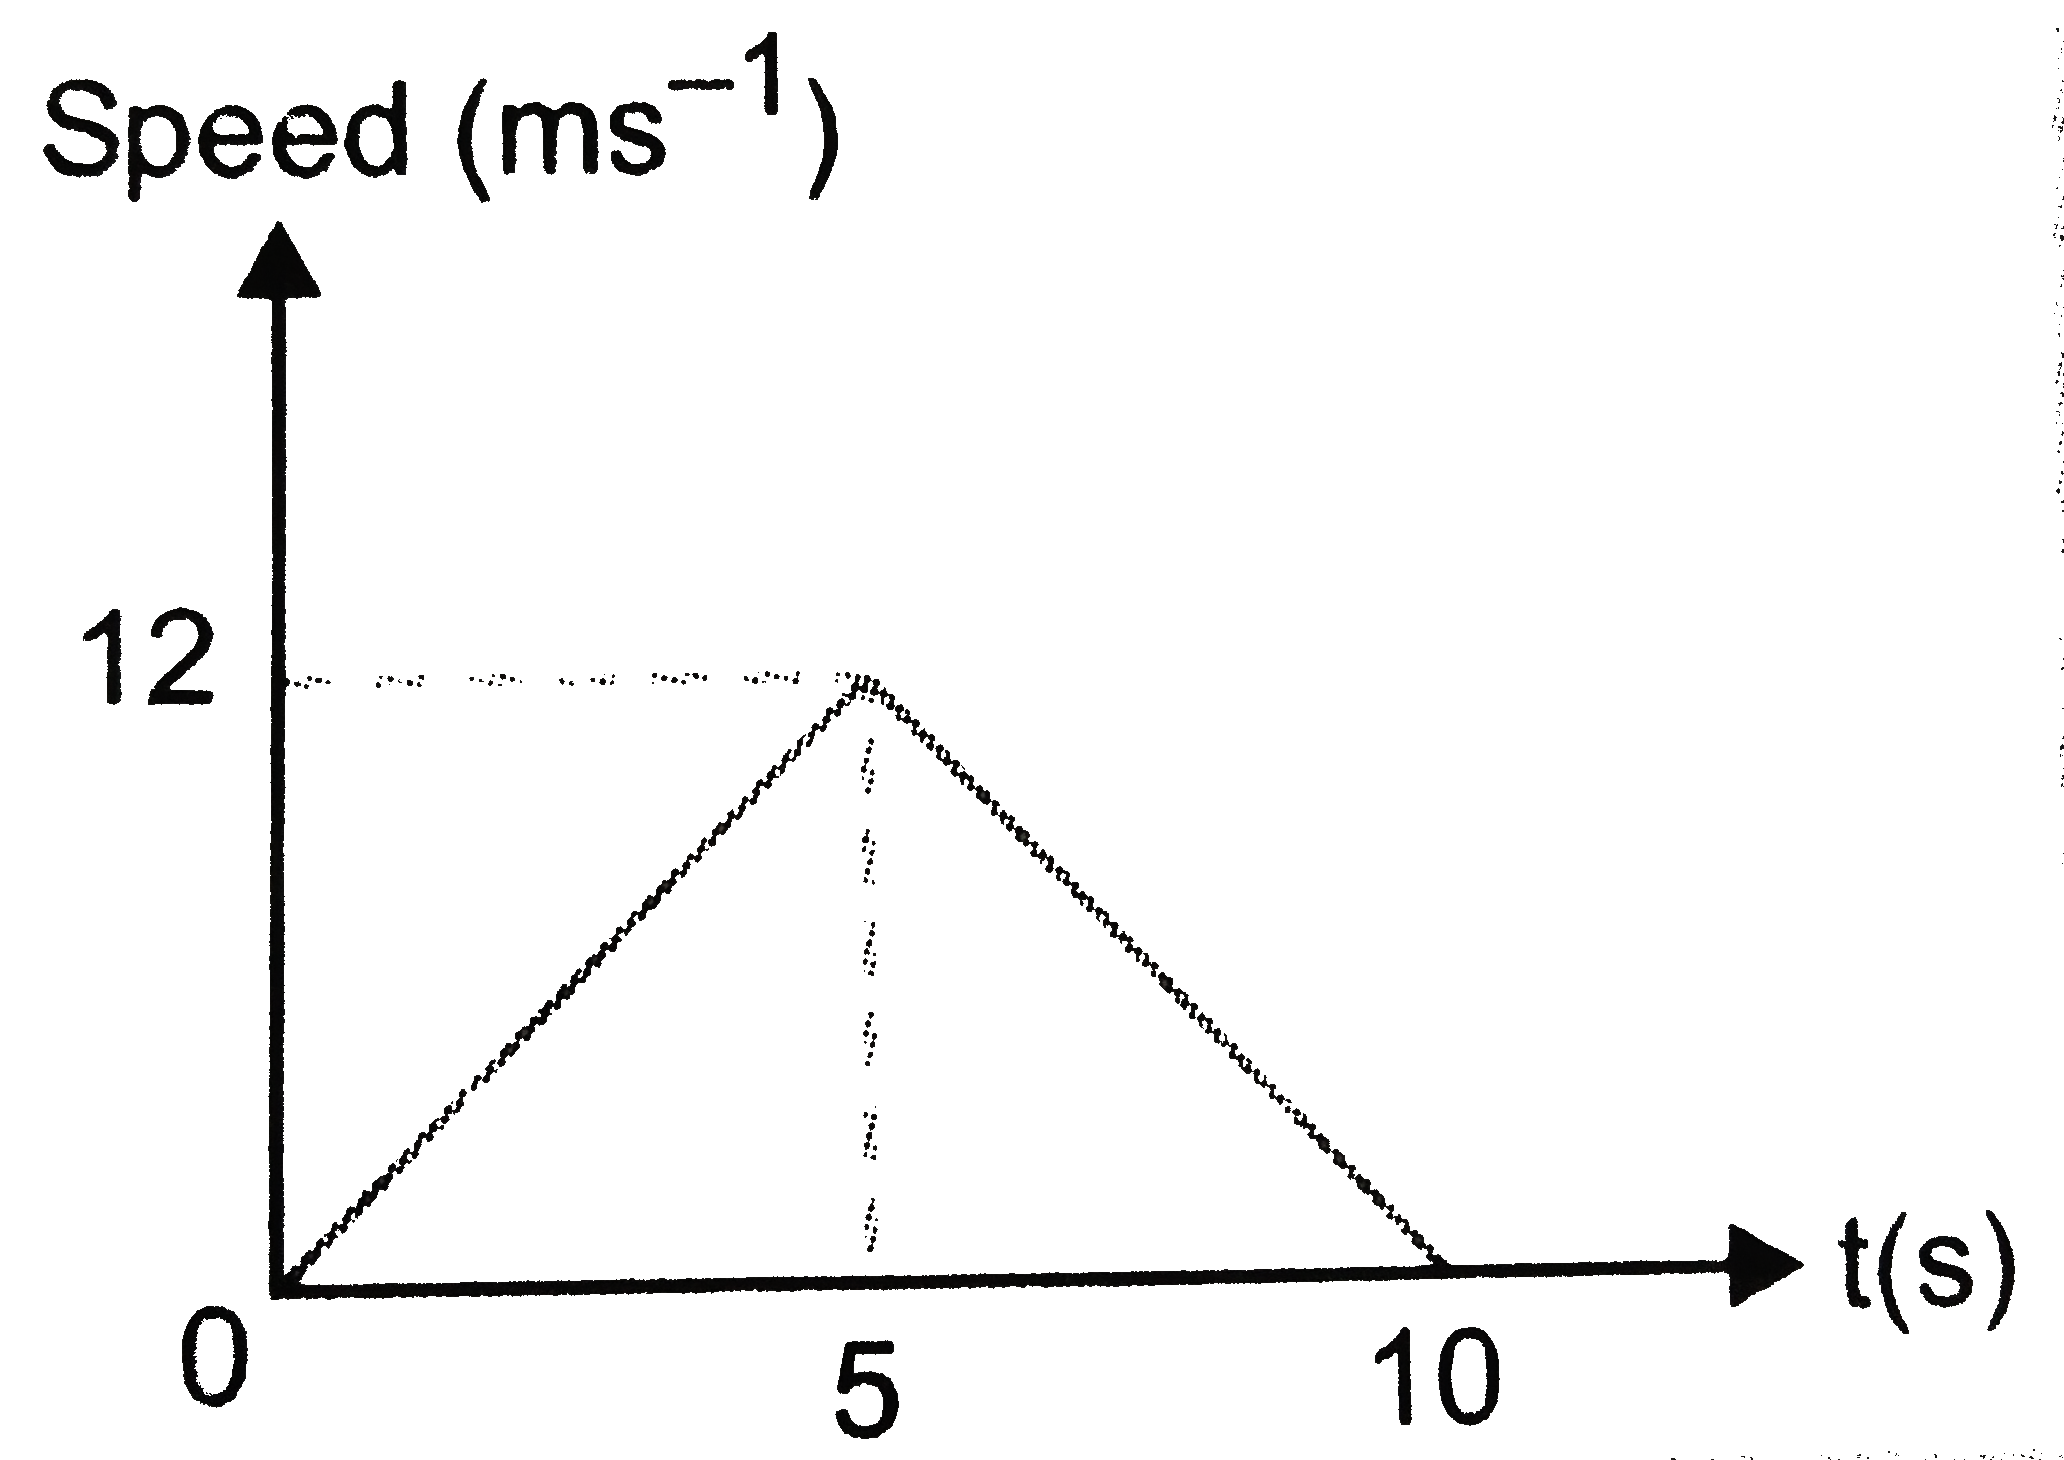
View SolutionThe speed -time graph of a particle moving along a fixed direction id shown ifn Fig. 2 (b) . 31. Fid (i) distance travelled by the particle between 0sec to 10sec (ii) average speed between thid interval (iii) the time when the speed was minimum (iv) the time when the speed was maximum.
 .
.
View Solution

