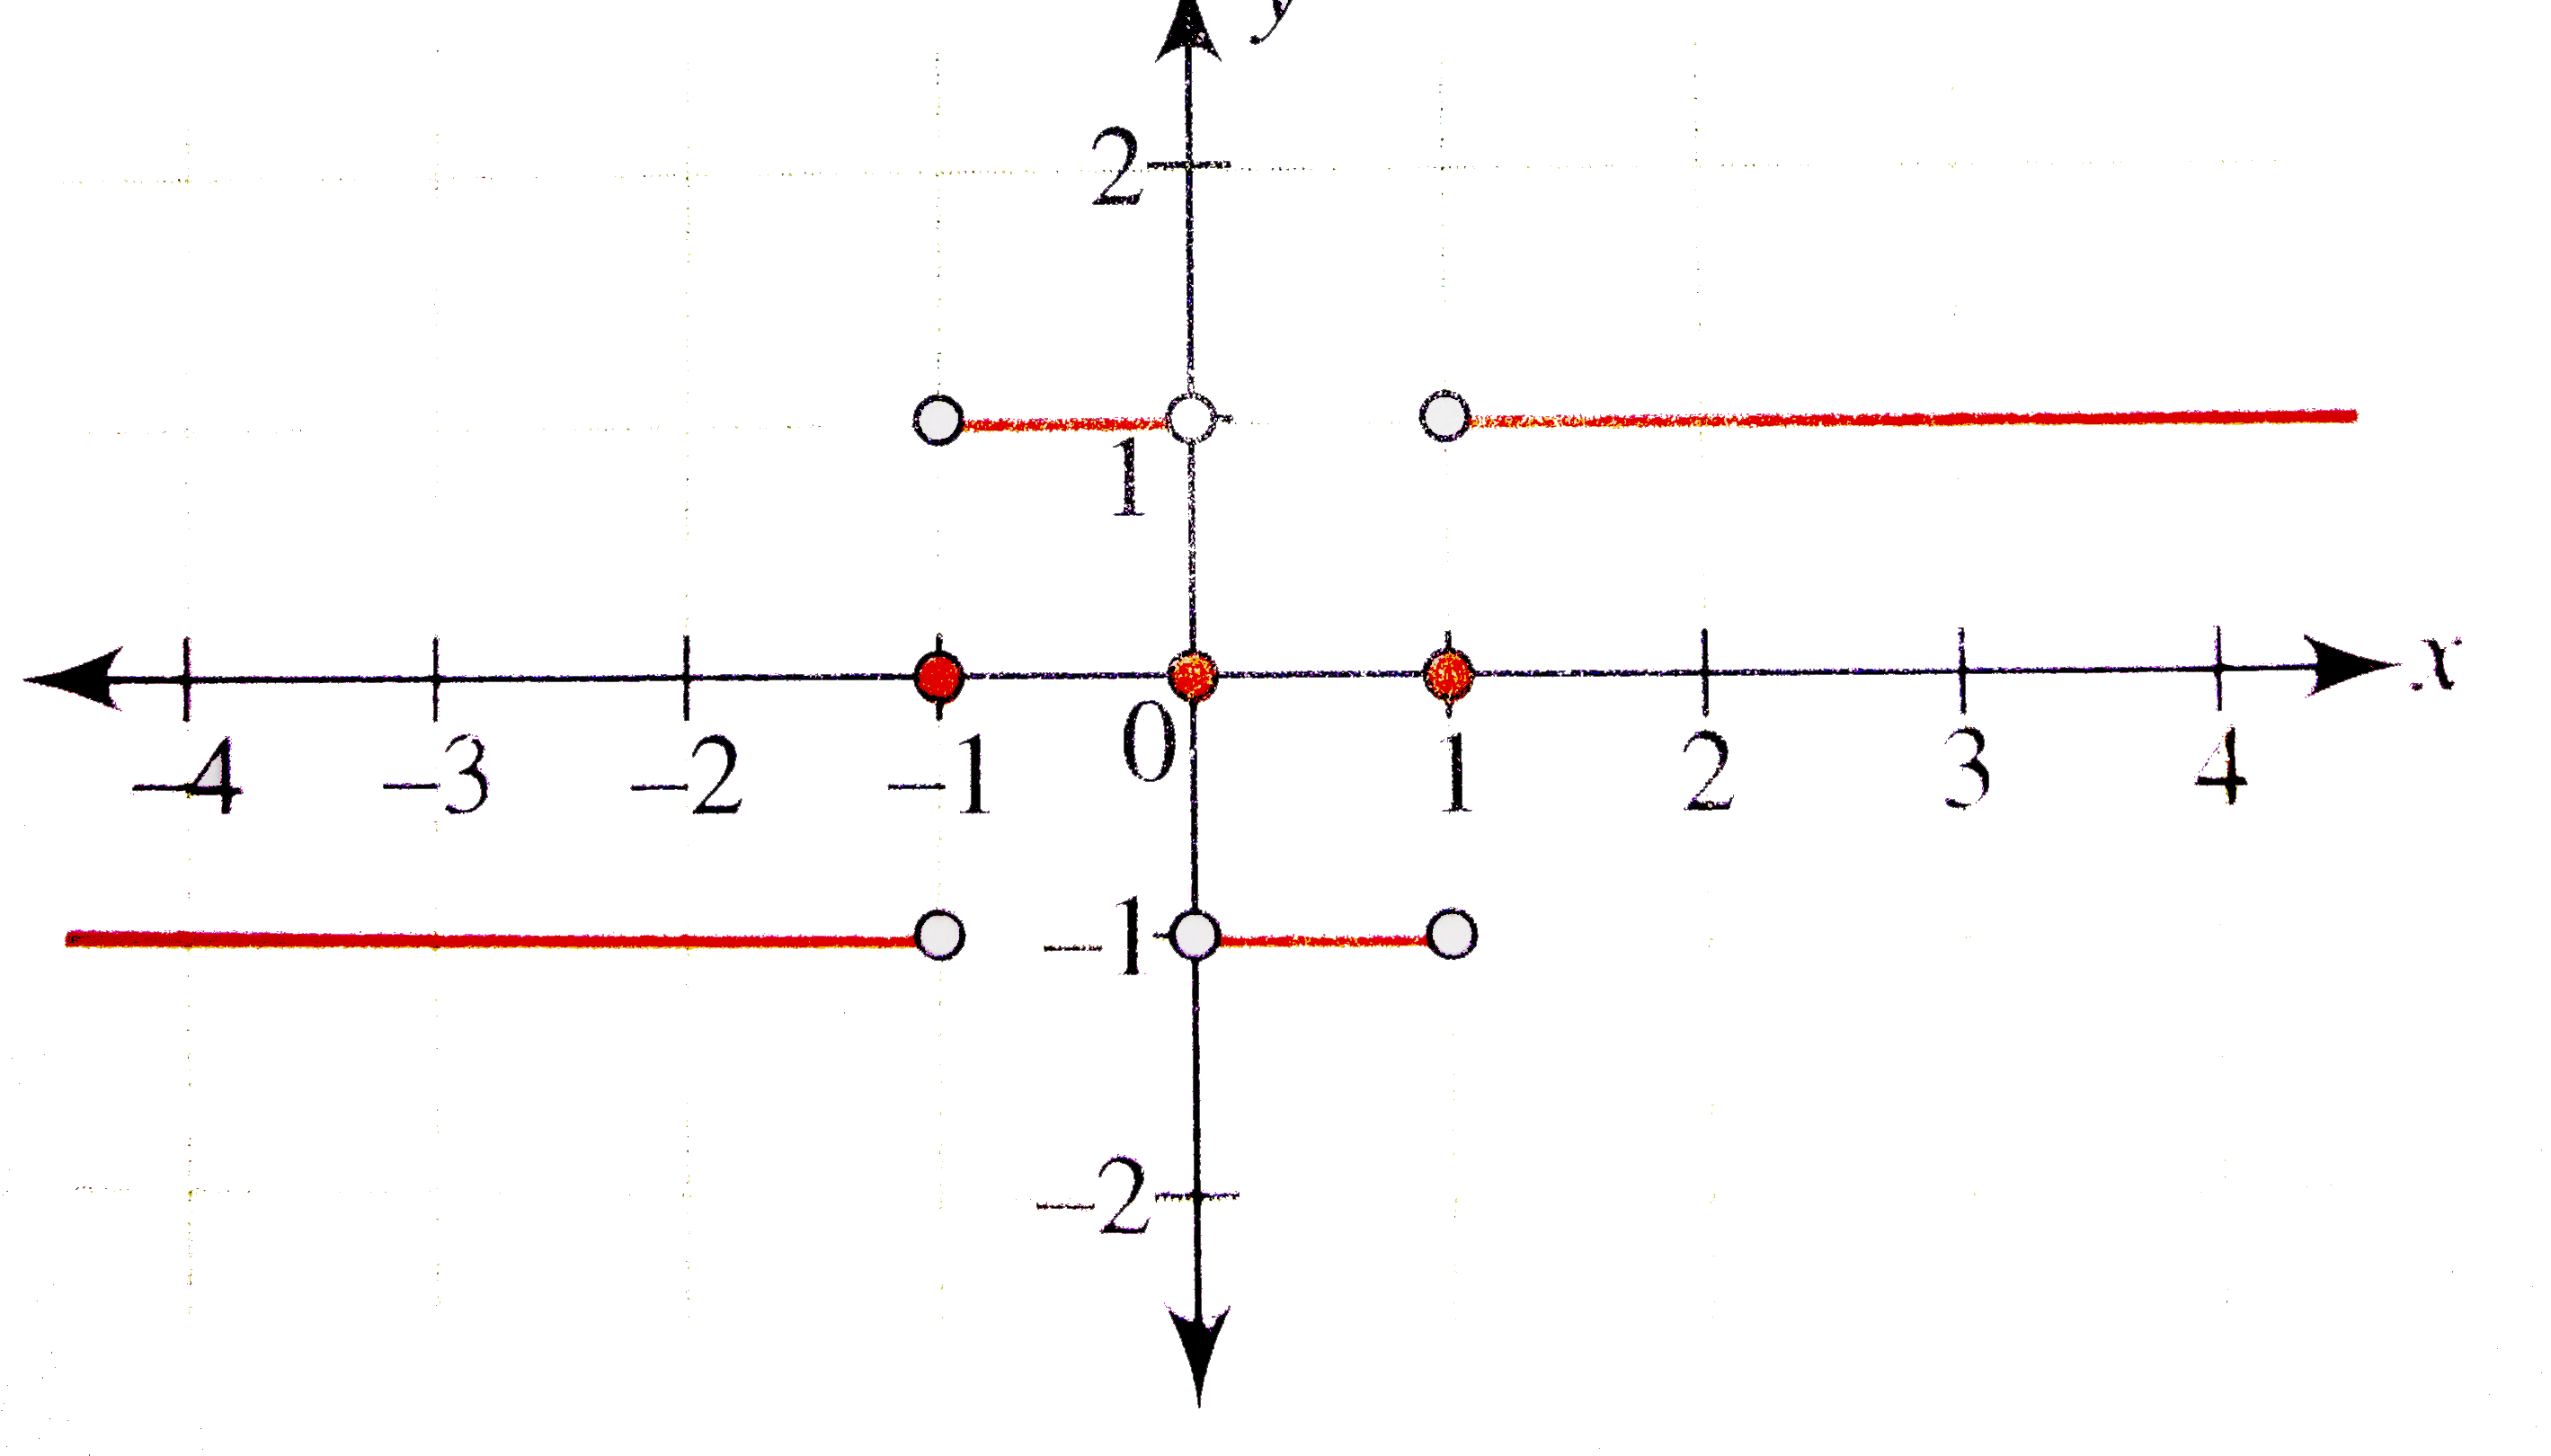
Draw the graph of f(x)=sgn(x3−x).
Video Solution
Text Solution
We need to first find the intervals where x3−x>0andx3−x<0.
Now x3−x=x(x−1)(x+1)
The sign scheme of x3−x is as shown in the following figure.

From the above sign scheme,
y=f(x)=sgn(x3−x)
=⎧⎪⎨⎪⎩1,x∈(−1,0)∪(1,∞)−1,x∈(−∞,−1)∪(0,1)0,x=0,±1
Hence the graph of f(x)=sgn(x3−x) is as shown in the following figure.
|
Topper's Solved these Questions
- GRAPHS OF ELEMENTARY FUNCTIONS Book:CENGAGEChapter:GRAPHS OF ELEMENTARY FUNCTIONS Exercise:Exercise
Explore 34 Videos
- GRAPHS OF POLYNOMIAL AND RATIONAL FUNCTIONSBook:CENGAGEChapter:GRAPHS OF POLYNOMIAL AND RATIONAL FUNCTIONSExercise:Exercise
Explore 13 Videos
- GRAPHS OF TRIGONOMETRIC FUNCTIONSBook:CENGAGEChapter:GRAPHS OF TRIGONOMETRIC FUNCTIONSExercise:Exercise
Explore 22 Videos
Similar Questions
Draw the graph of f(x)=sgn(x−2).
View SolutionDraw the graph of f(x)=sgn(logex).
View SolutionDraw the graph of f(x)=sgn(log0.5x).
View SolutionDraw the graph of f(x)=x|x|.
View SolutionDraw the graph of f(x)=esinx.
View SolutionDraw the graph of f(x)=√sinx.
View SolutionDraw the graph of f(x)=x2−3
View SolutionDraw the graph of f(x)=x3−xx2−1.
View SolutionDraw the graph of f(x)={x3,x2<1x,x2≤1
View SolutionDraw the graph of f(x)=12x43−6x13
View Solution

