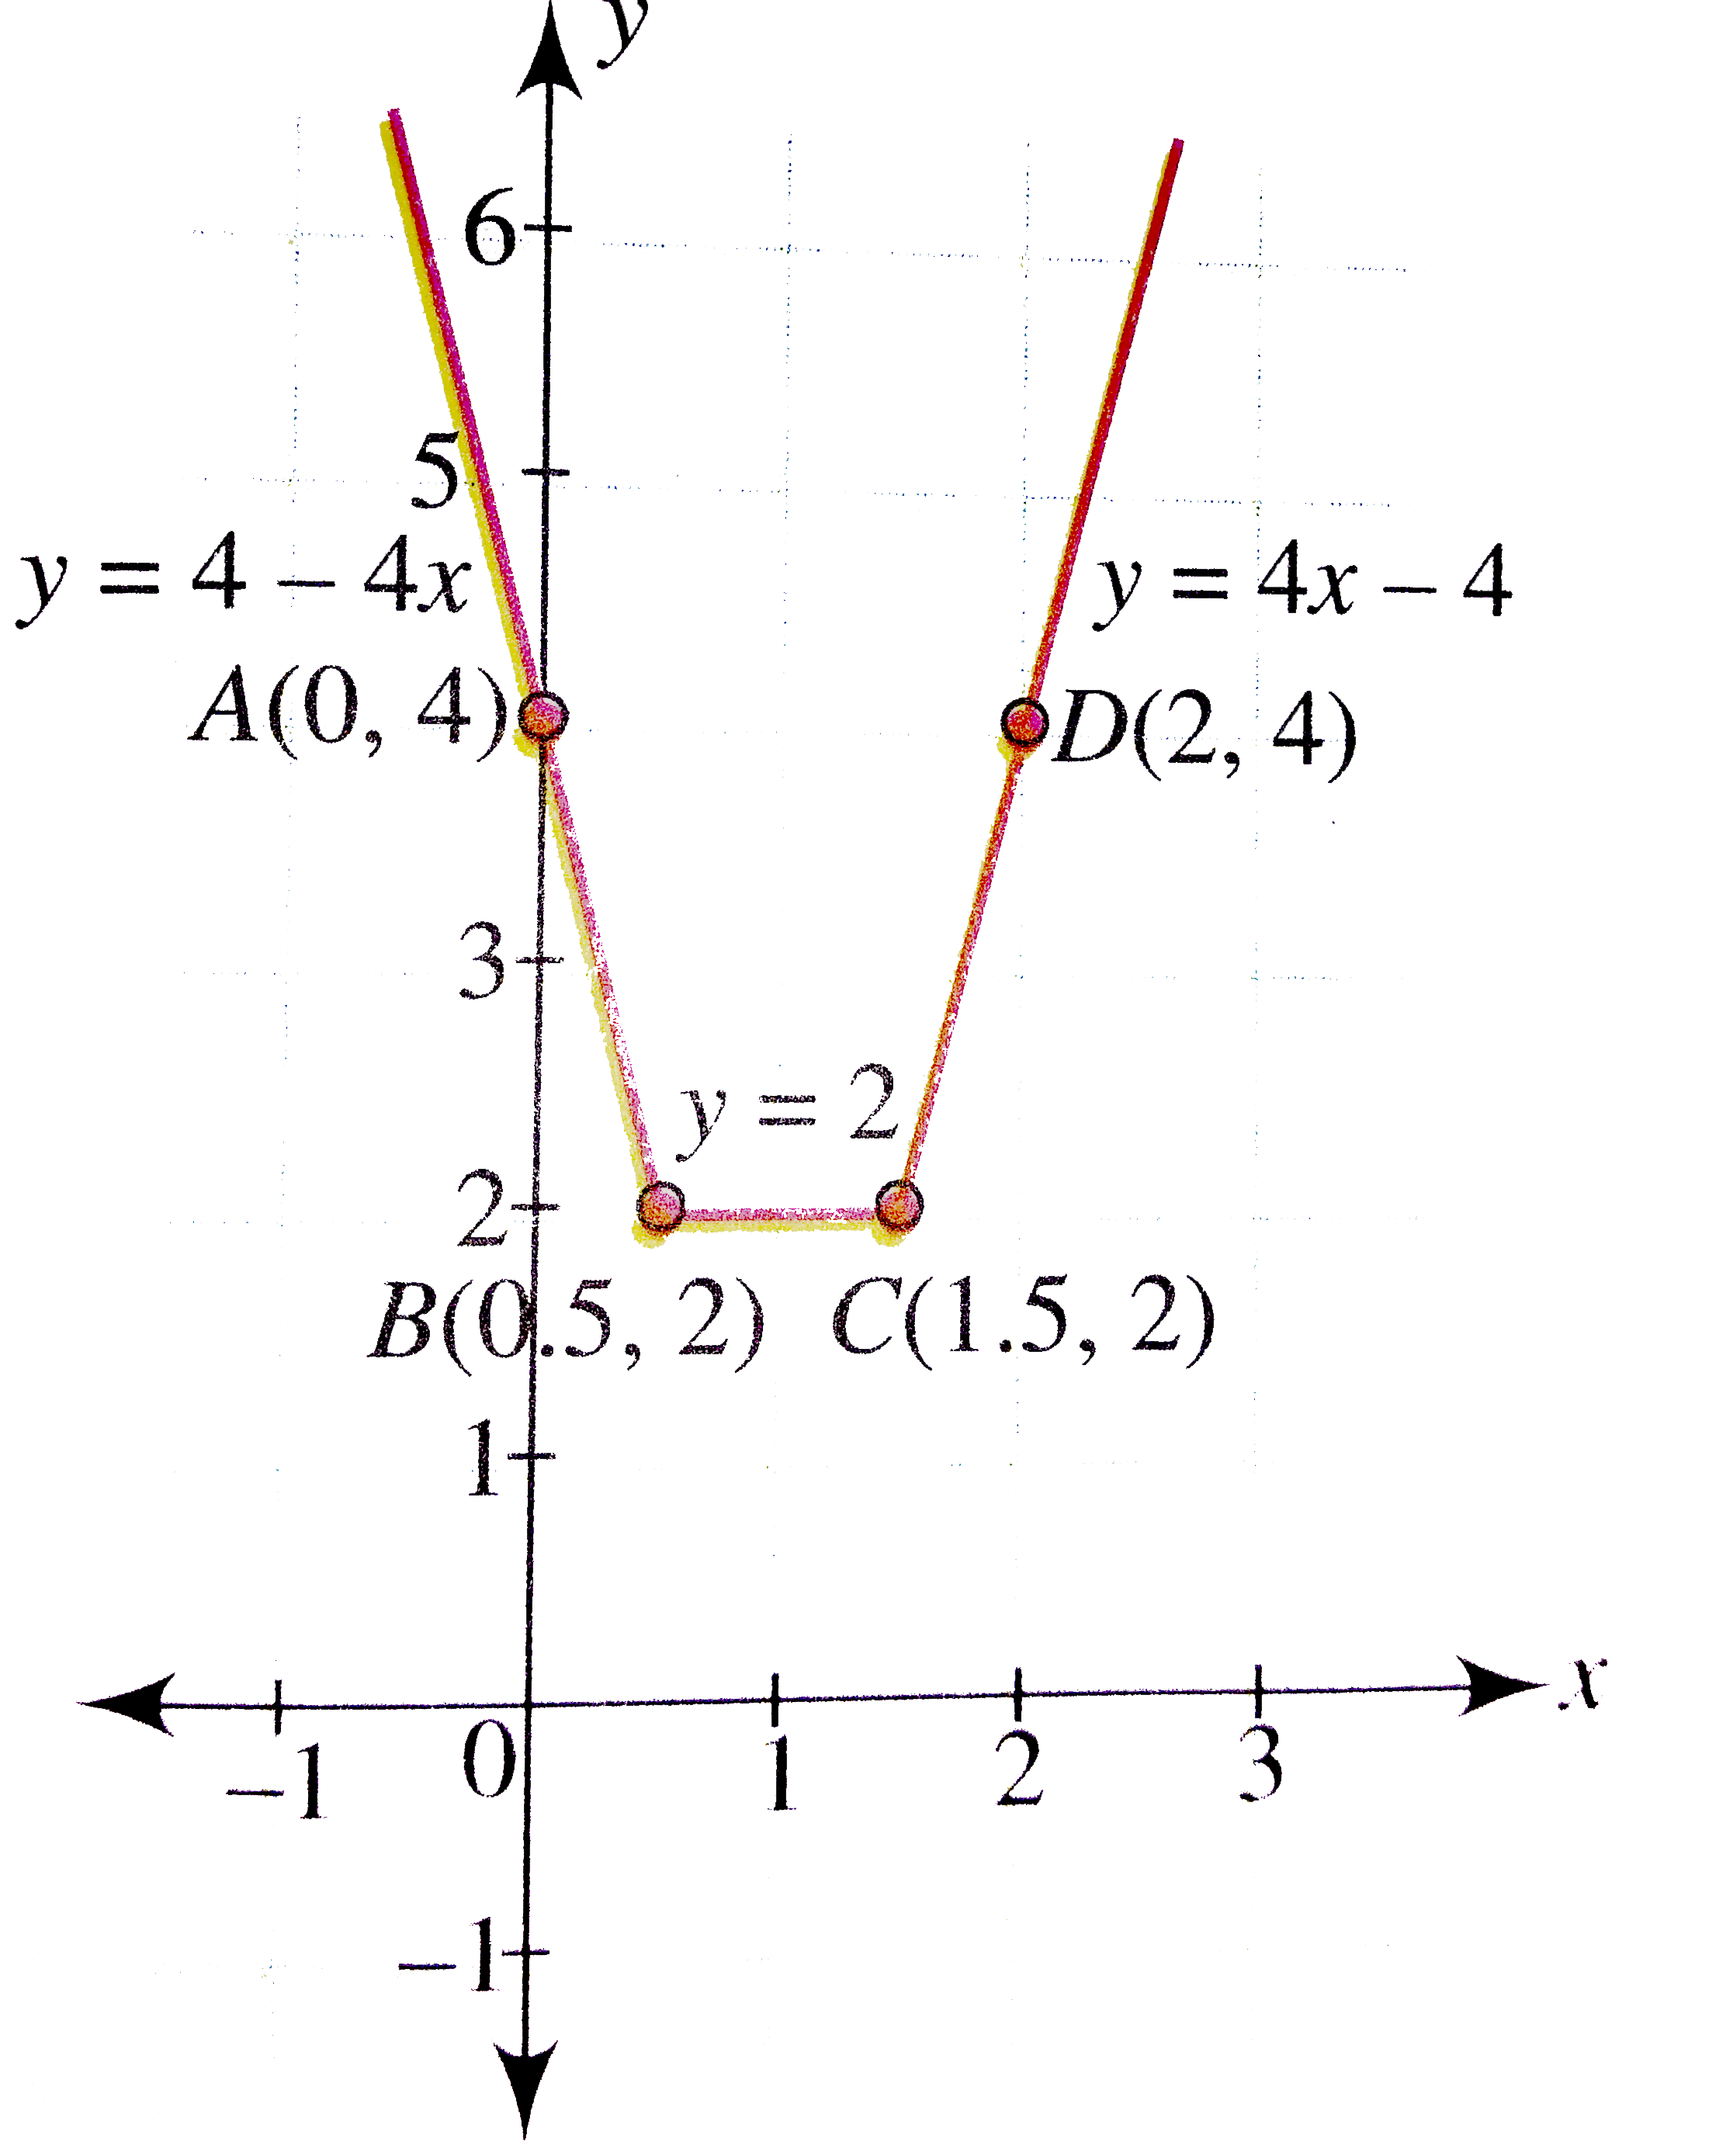
Draw the graph of f(x)=|2x−1|+|2x−3|. Find the range of the function.
Video Solution
Text Solution
Function f(x)=|2x−1|+|2x−3| changes definition where 2x−1=0and2x−3=0orx=1/2andx=3/2.
Thus, we find the function in each of the intervals (−∞,1/2),(1/2,3/2)and(3/2,∞).
∴ f(x)=|2x−1|+|2x−3|=⎧⎪
⎪
⎪
⎪⎨⎪
⎪
⎪
⎪⎩1−2x+3−2x,x<122x−1+3−2x,12≤x≤322x−1+2x−3,x>32
=⎧⎪
⎪
⎪
⎪⎨⎪
⎪
⎪
⎪⎩4−4x,x<122,12≤x≤324x−4,x>32
Now we can draw the graph of each function in respective intervals.
Alternative method :
Since the graph of the function is linear in eah of the reagions (−∞,1/2),(1/2,3/2)and(3/2,∞), we need to check the values of the function at some particular values of x to draw the graph in each region.
f(1/2)=2
f(3/2)2
f(0)=4
f(2)=3+1=4
Thus, we plot the points A(0,4),B(1/2,2),C(3/2,2)andD(2,4). Plotting these points and connecting with the straight line, we have the following graph.

From the graph, the range of the function is [2,∞).
|
Topper's Solved these Questions
- GRAPHS OF ELEMENTARY FUNCTIONS Book:CENGAGEChapter:GRAPHS OF ELEMENTARY FUNCTIONS Exercise:Exercise
Explore 34 Videos
- GRAPHS OF POLYNOMIAL AND RATIONAL FUNCTIONSBook:CENGAGEChapter:GRAPHS OF POLYNOMIAL AND RATIONAL FUNCTIONSExercise:Exercise
Explore 13 Videos
- GRAPHS OF TRIGONOMETRIC FUNCTIONSBook:CENGAGEChapter:GRAPHS OF TRIGONOMETRIC FUNCTIONSExercise:Exercise
Explore 22 Videos
Similar Questions
Knowledge Check
If the sum is 240 and average is 40, find the number of quantities.
A5B2C3D6
Draw the graph of f(x)=x2−3
View SolutionDraw the graph of f(x)=(x−1)|(x−2)(x−3)|.
View SolutionDraw the graph of:
y=f(x)=3sin(2x−1).
View SolutionDraw the graph of f(x)=loge(√1−x2).Find the range of the function .Also find the values of k if (x) has two distinct real roots.
View SolutionDraw the graph of the function f(x)=2x−|x|
View SolutionFind the range of function f(x)=1+3cos2x
View SolutionDraw the graph of f(x)=1x2−2x+2.
View Solution

