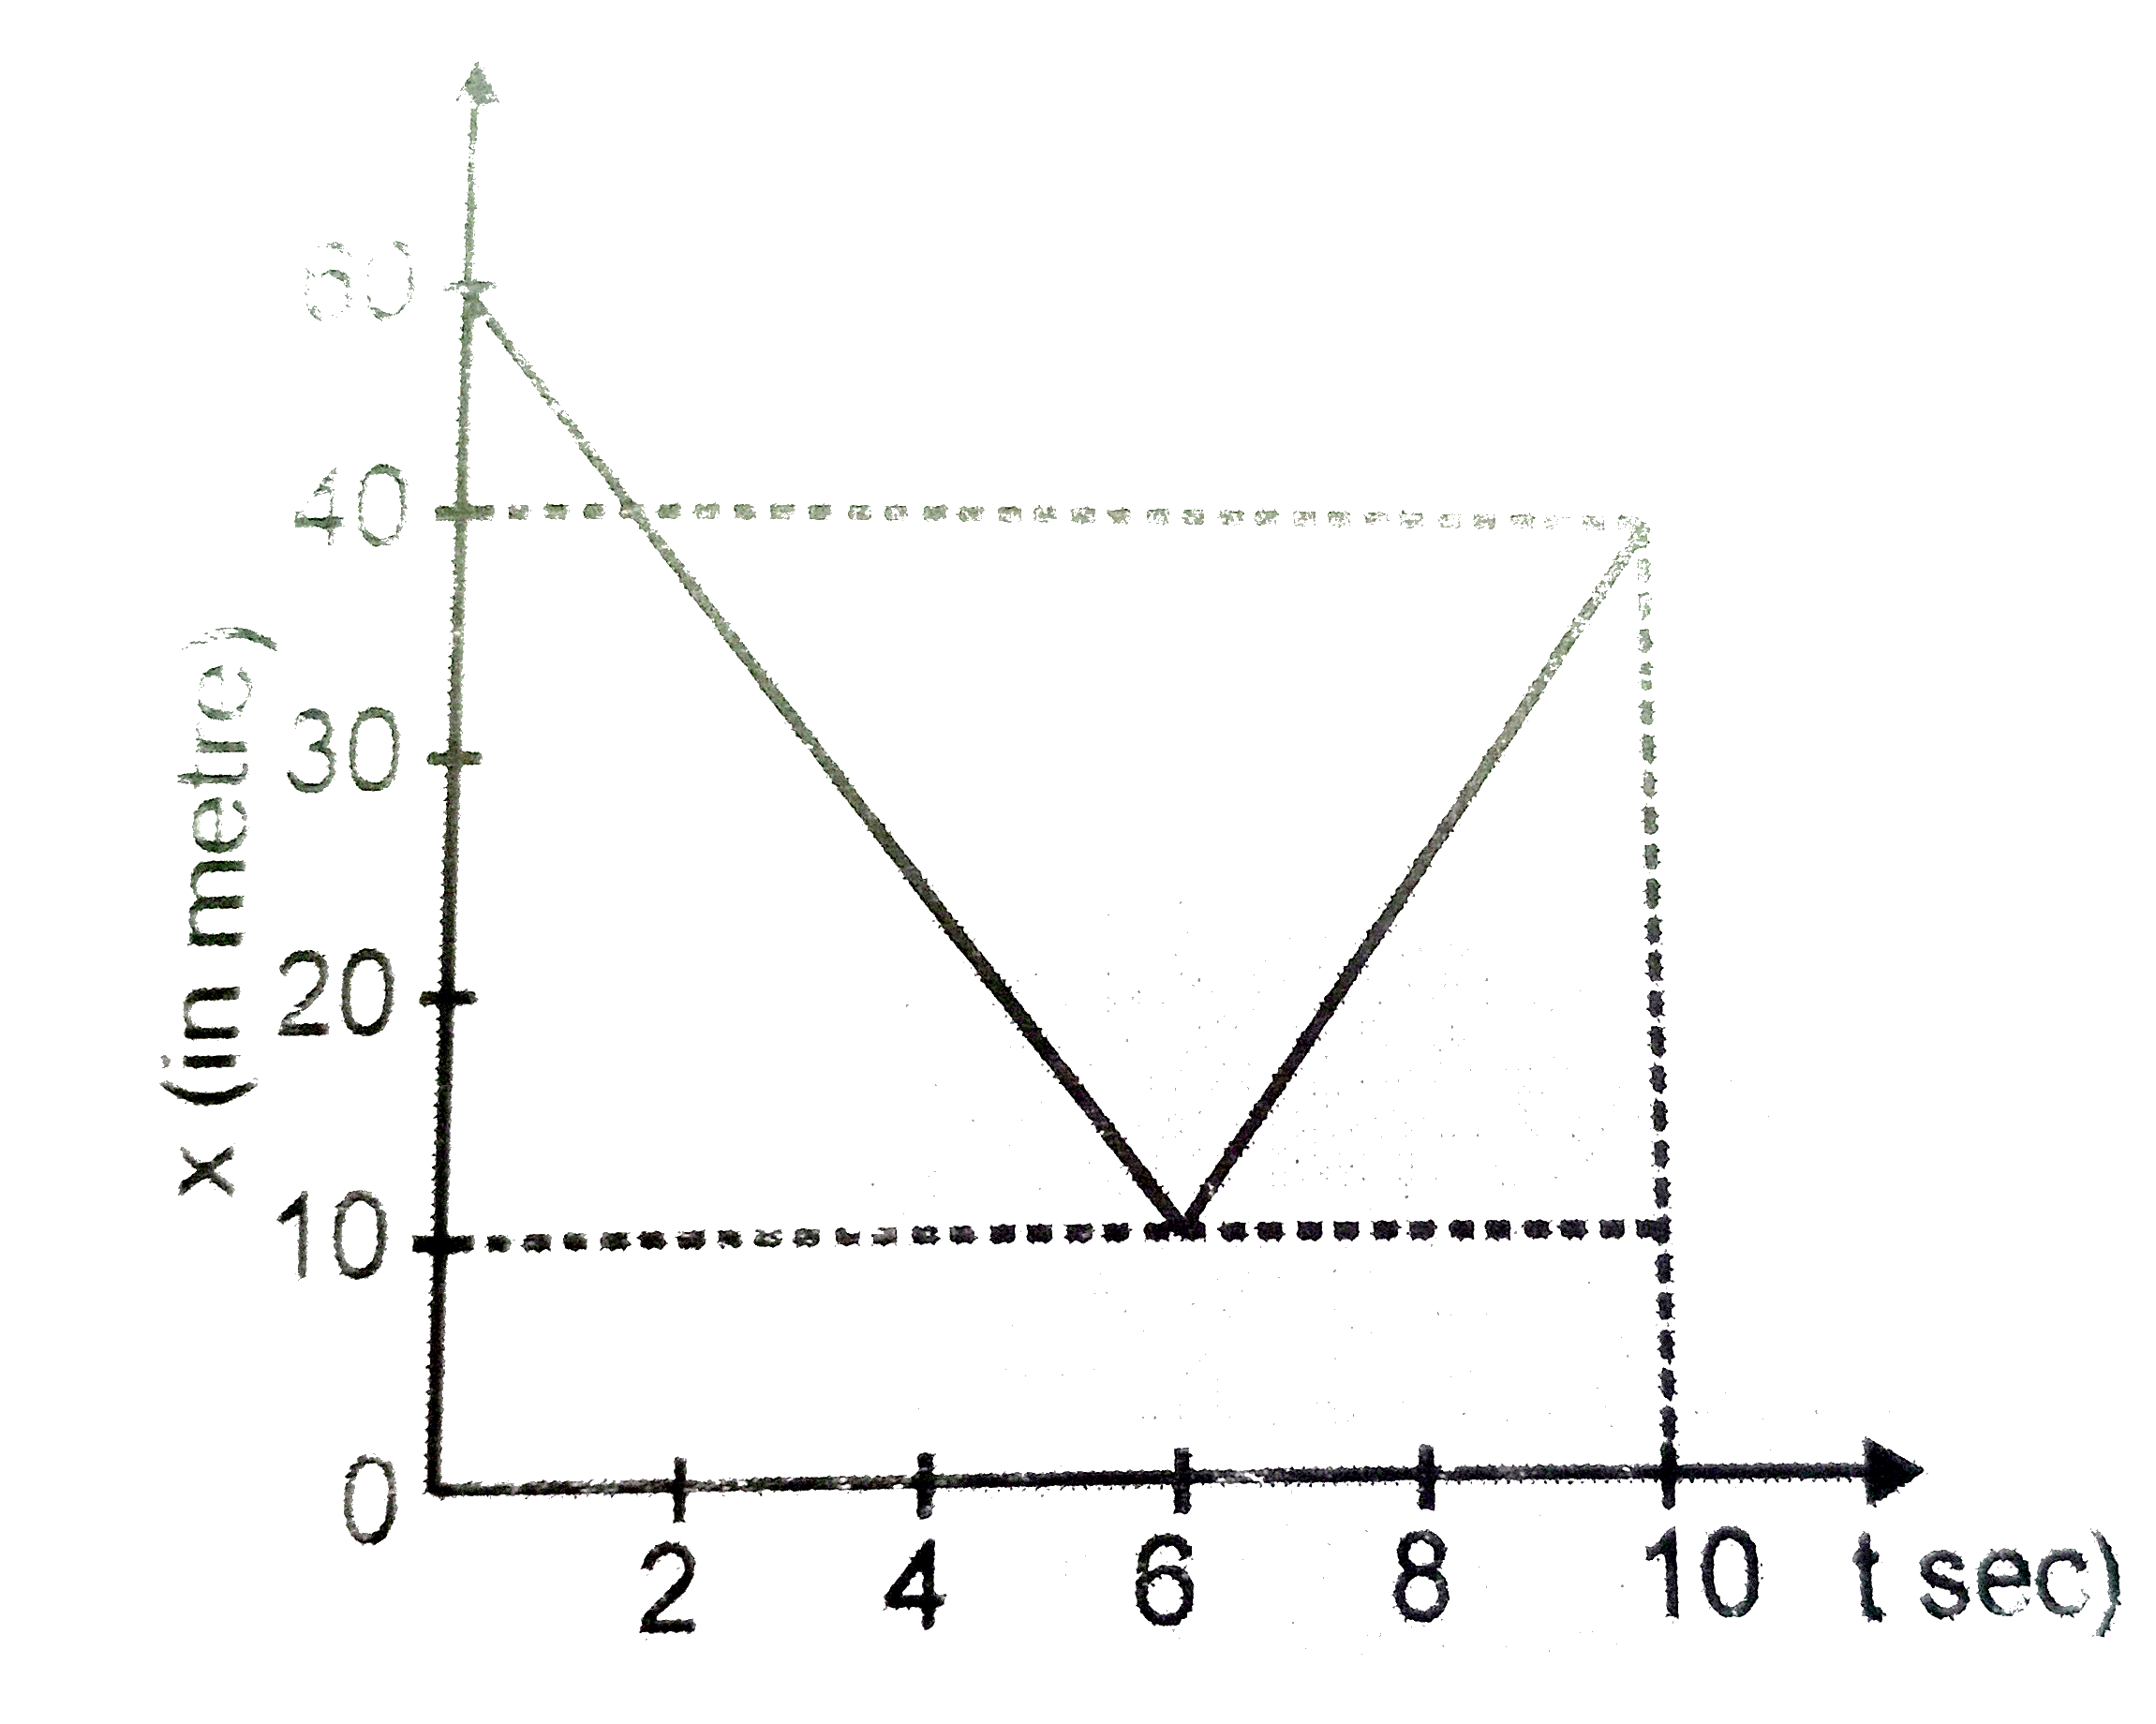
The fig. shows the displacement time graph of a particle moving on a straight line path. What is the magnitude of average velocity of the particle over 10 seconds?
2ms−1
4ms−1
6ms−1
8ms−1
The correct Answer is:A
Displacement=Final position-initial position
=40−60=−20m
∣∣→vavg∣∣=|Displacement|time=2010=2m/s
Topper's Solved these Questions
- MOTION IN A PALNEBook:ALLENChapter:MOTION IN A PALNEExercise:EXERCISE-3
Explore 41 Videos
- MOTION IN A PALNEBook:ALLENChapter:MOTION IN A PALNEExercise:SOLVED EXAMPLE
Explore 28 Videos
- MOTION IN A PALNEBook:ALLENChapter:MOTION IN A PALNEExercise:EXERCISE-1
Explore 99 Videos
- KINEMATICS-2DBook:ALLENChapter:KINEMATICS-2DExercise:Exercise (O-2)
Explore 48 Videos
- NEWTON'S LAWS OF MOTION & FRICTIONBook:ALLENChapter:NEWTON'S LAWS OF MOTION & FRICTIONExercise:EXERCISE (JA)
Explore 4 Videos
Similar Questions
Knowledge Check
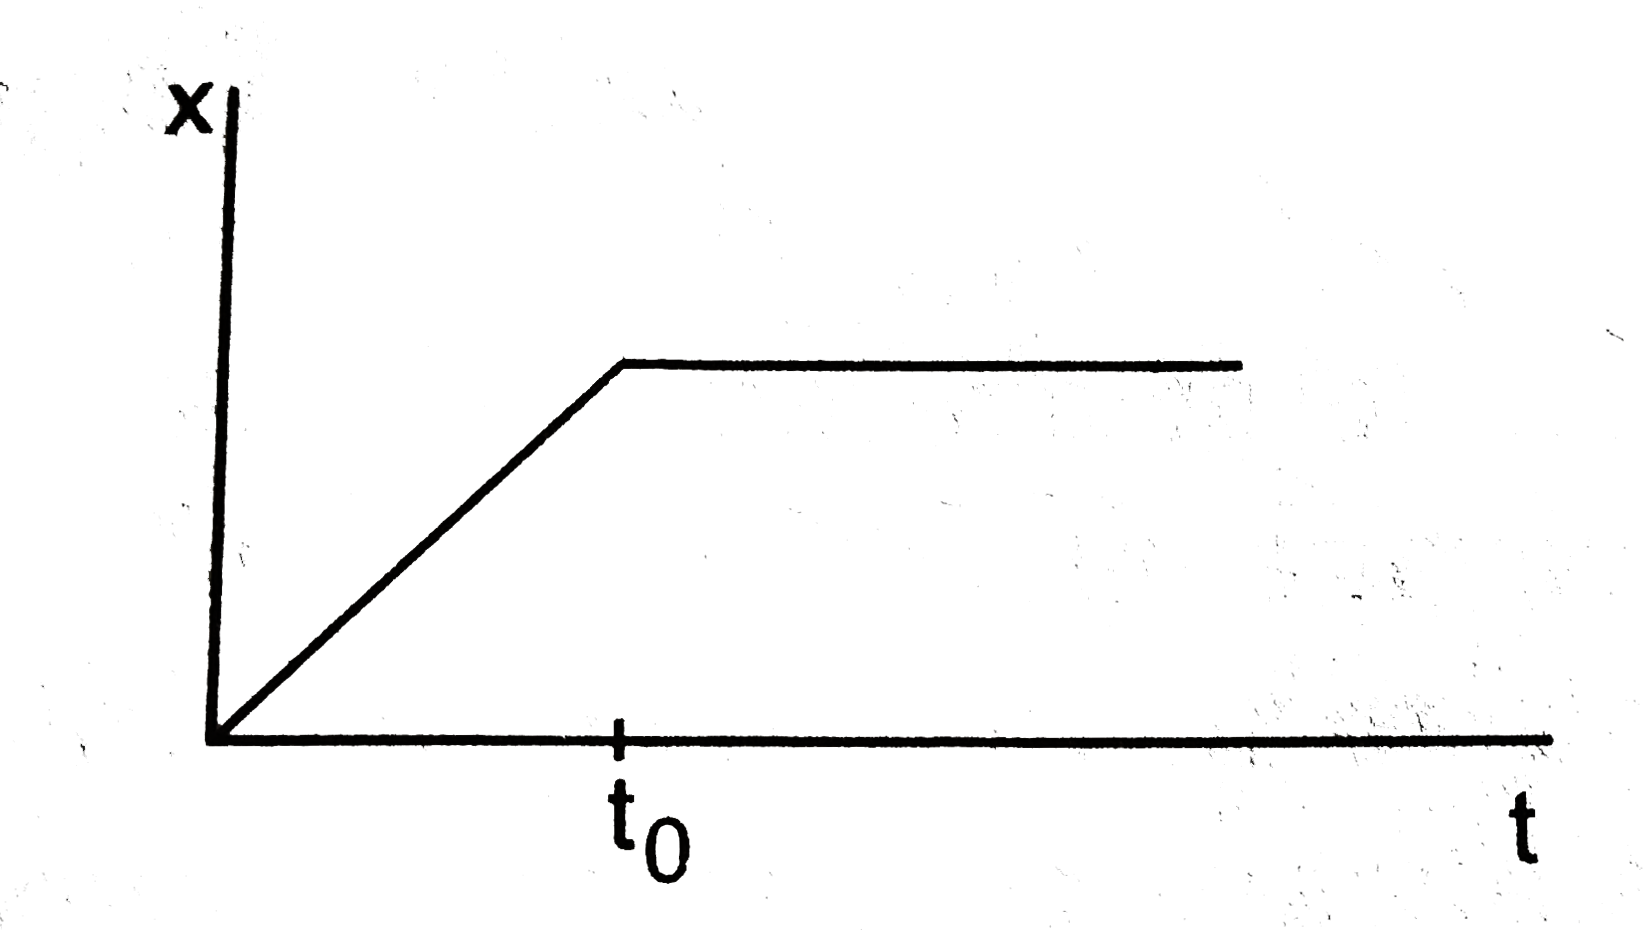
Figure show the displacement - time graph of a particle moving on the x-axis
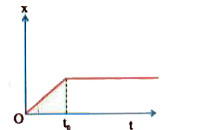 Athe particle is continuously going in positive X directionBthe particle is at restCthe velocity increases up to a time t0 and then becomes constant.Dthe particle moves at constant velocity up to a time t0 and then stops.
Displacement time graph of a particle moving in a straight line is a shown in figure.
 Ain region A acceleration is positiveBin region B acceleration is negativeCin region C acceleration is positiveDin region D acceleration is negative
Velocity displacement graph of a particle moving in a straight line is as shown in figure.
 Amagnitude of acceleration of particle is decreasingBmagnitude of acceleration of particlre is increasingCacceleration versus displacement graph straight lineDacceleration versus displacement graph is parabola
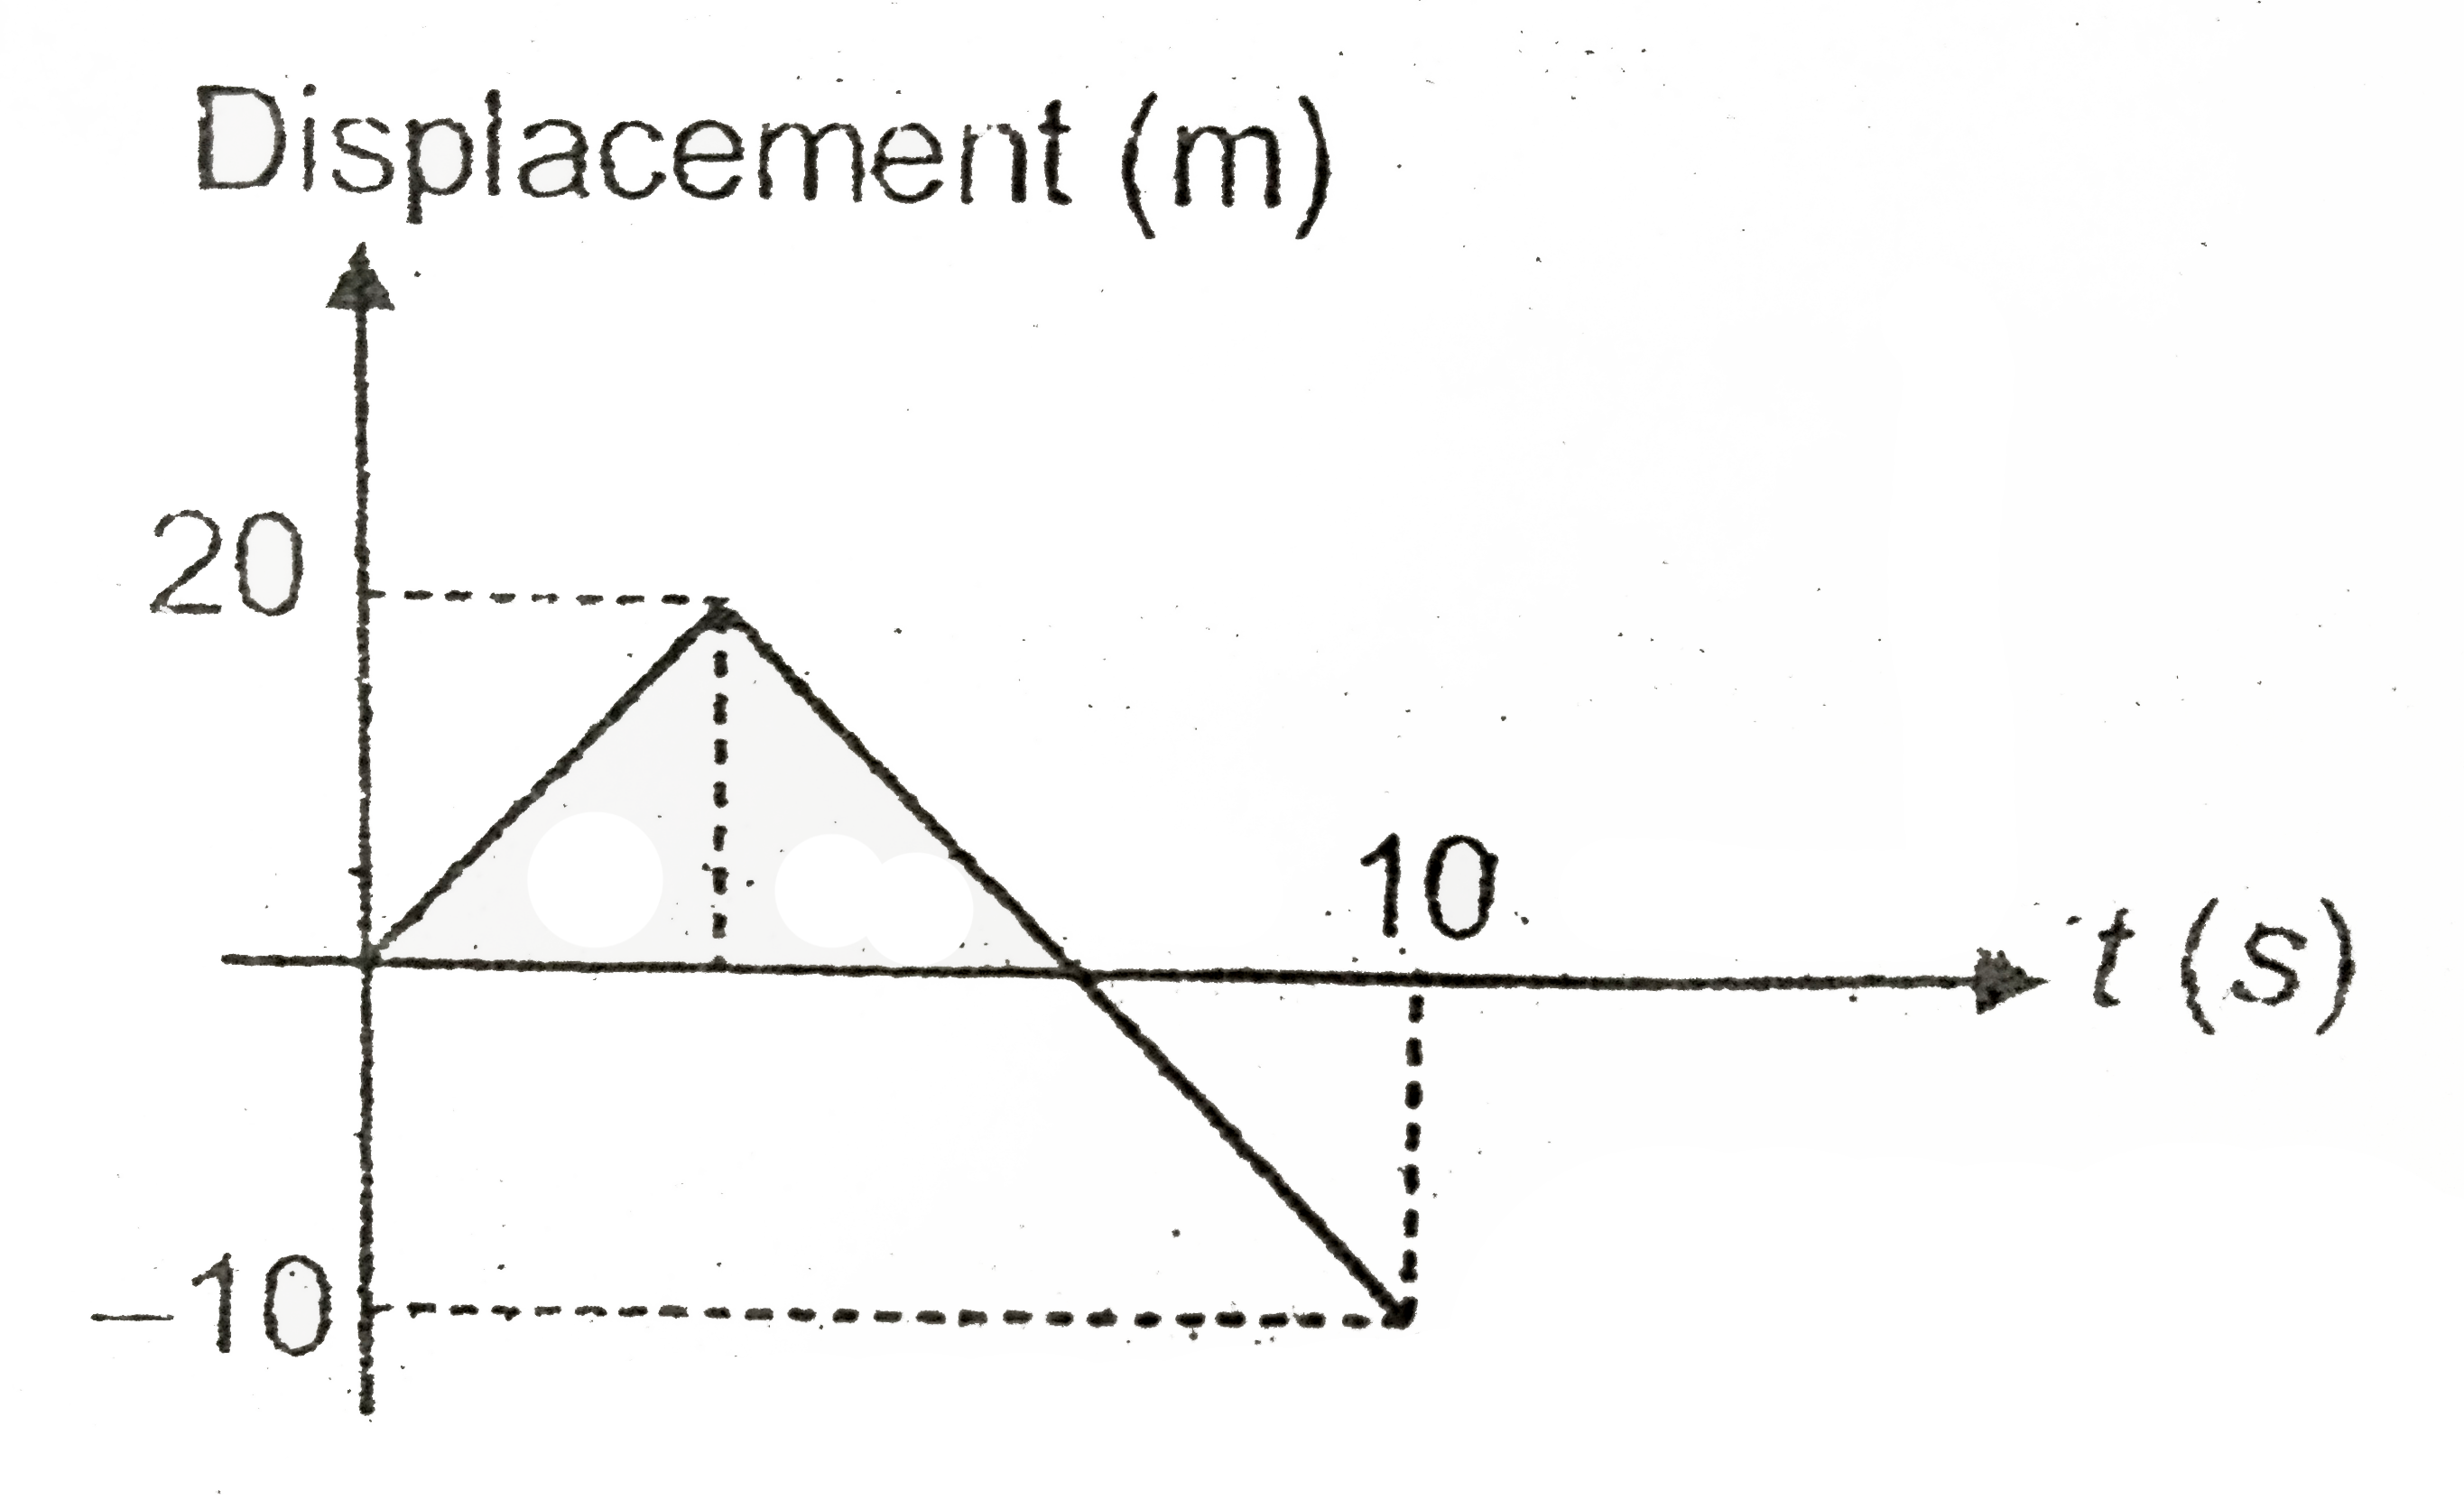
The diagram shows the displacement - time graph for a particle moving in a straight line. The distance (in m) coverted by the particle in the time interval t=0 to t=5s is
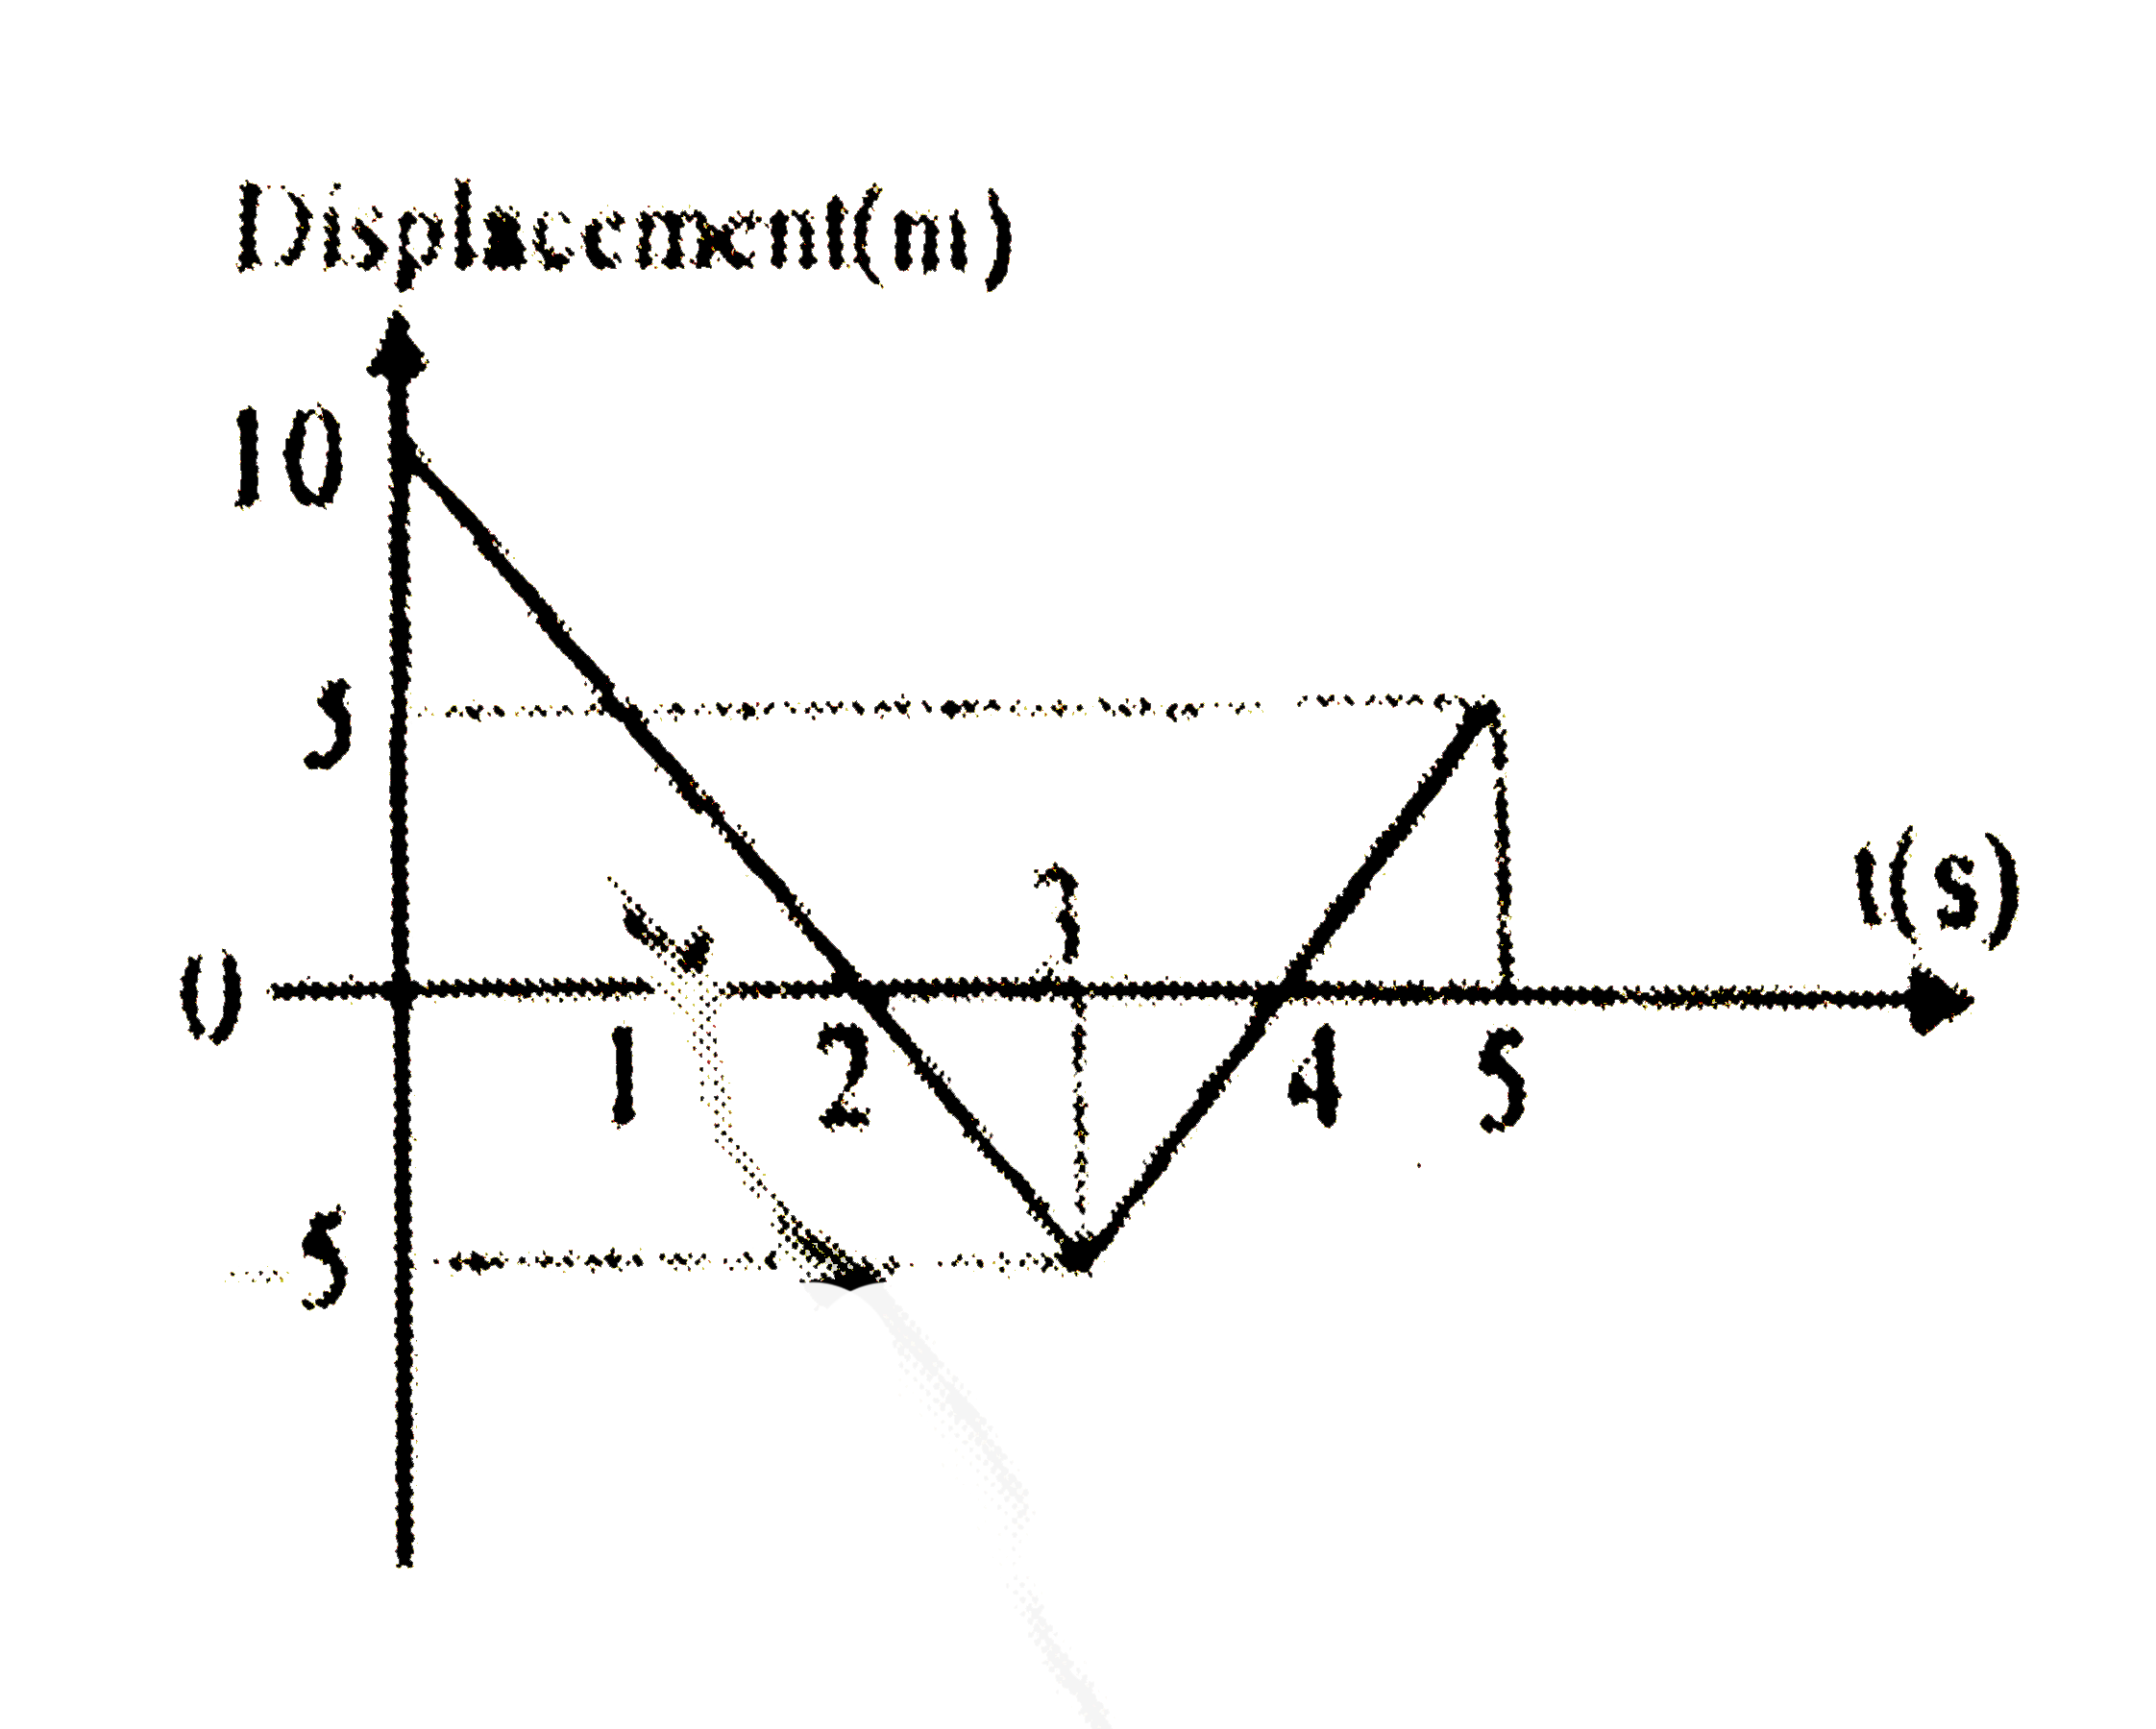
View SolutionThe diagram shows the displacement-time graph for a particle moving in a straight line. Find the average velocity for the interval from t=0 to t=5s.
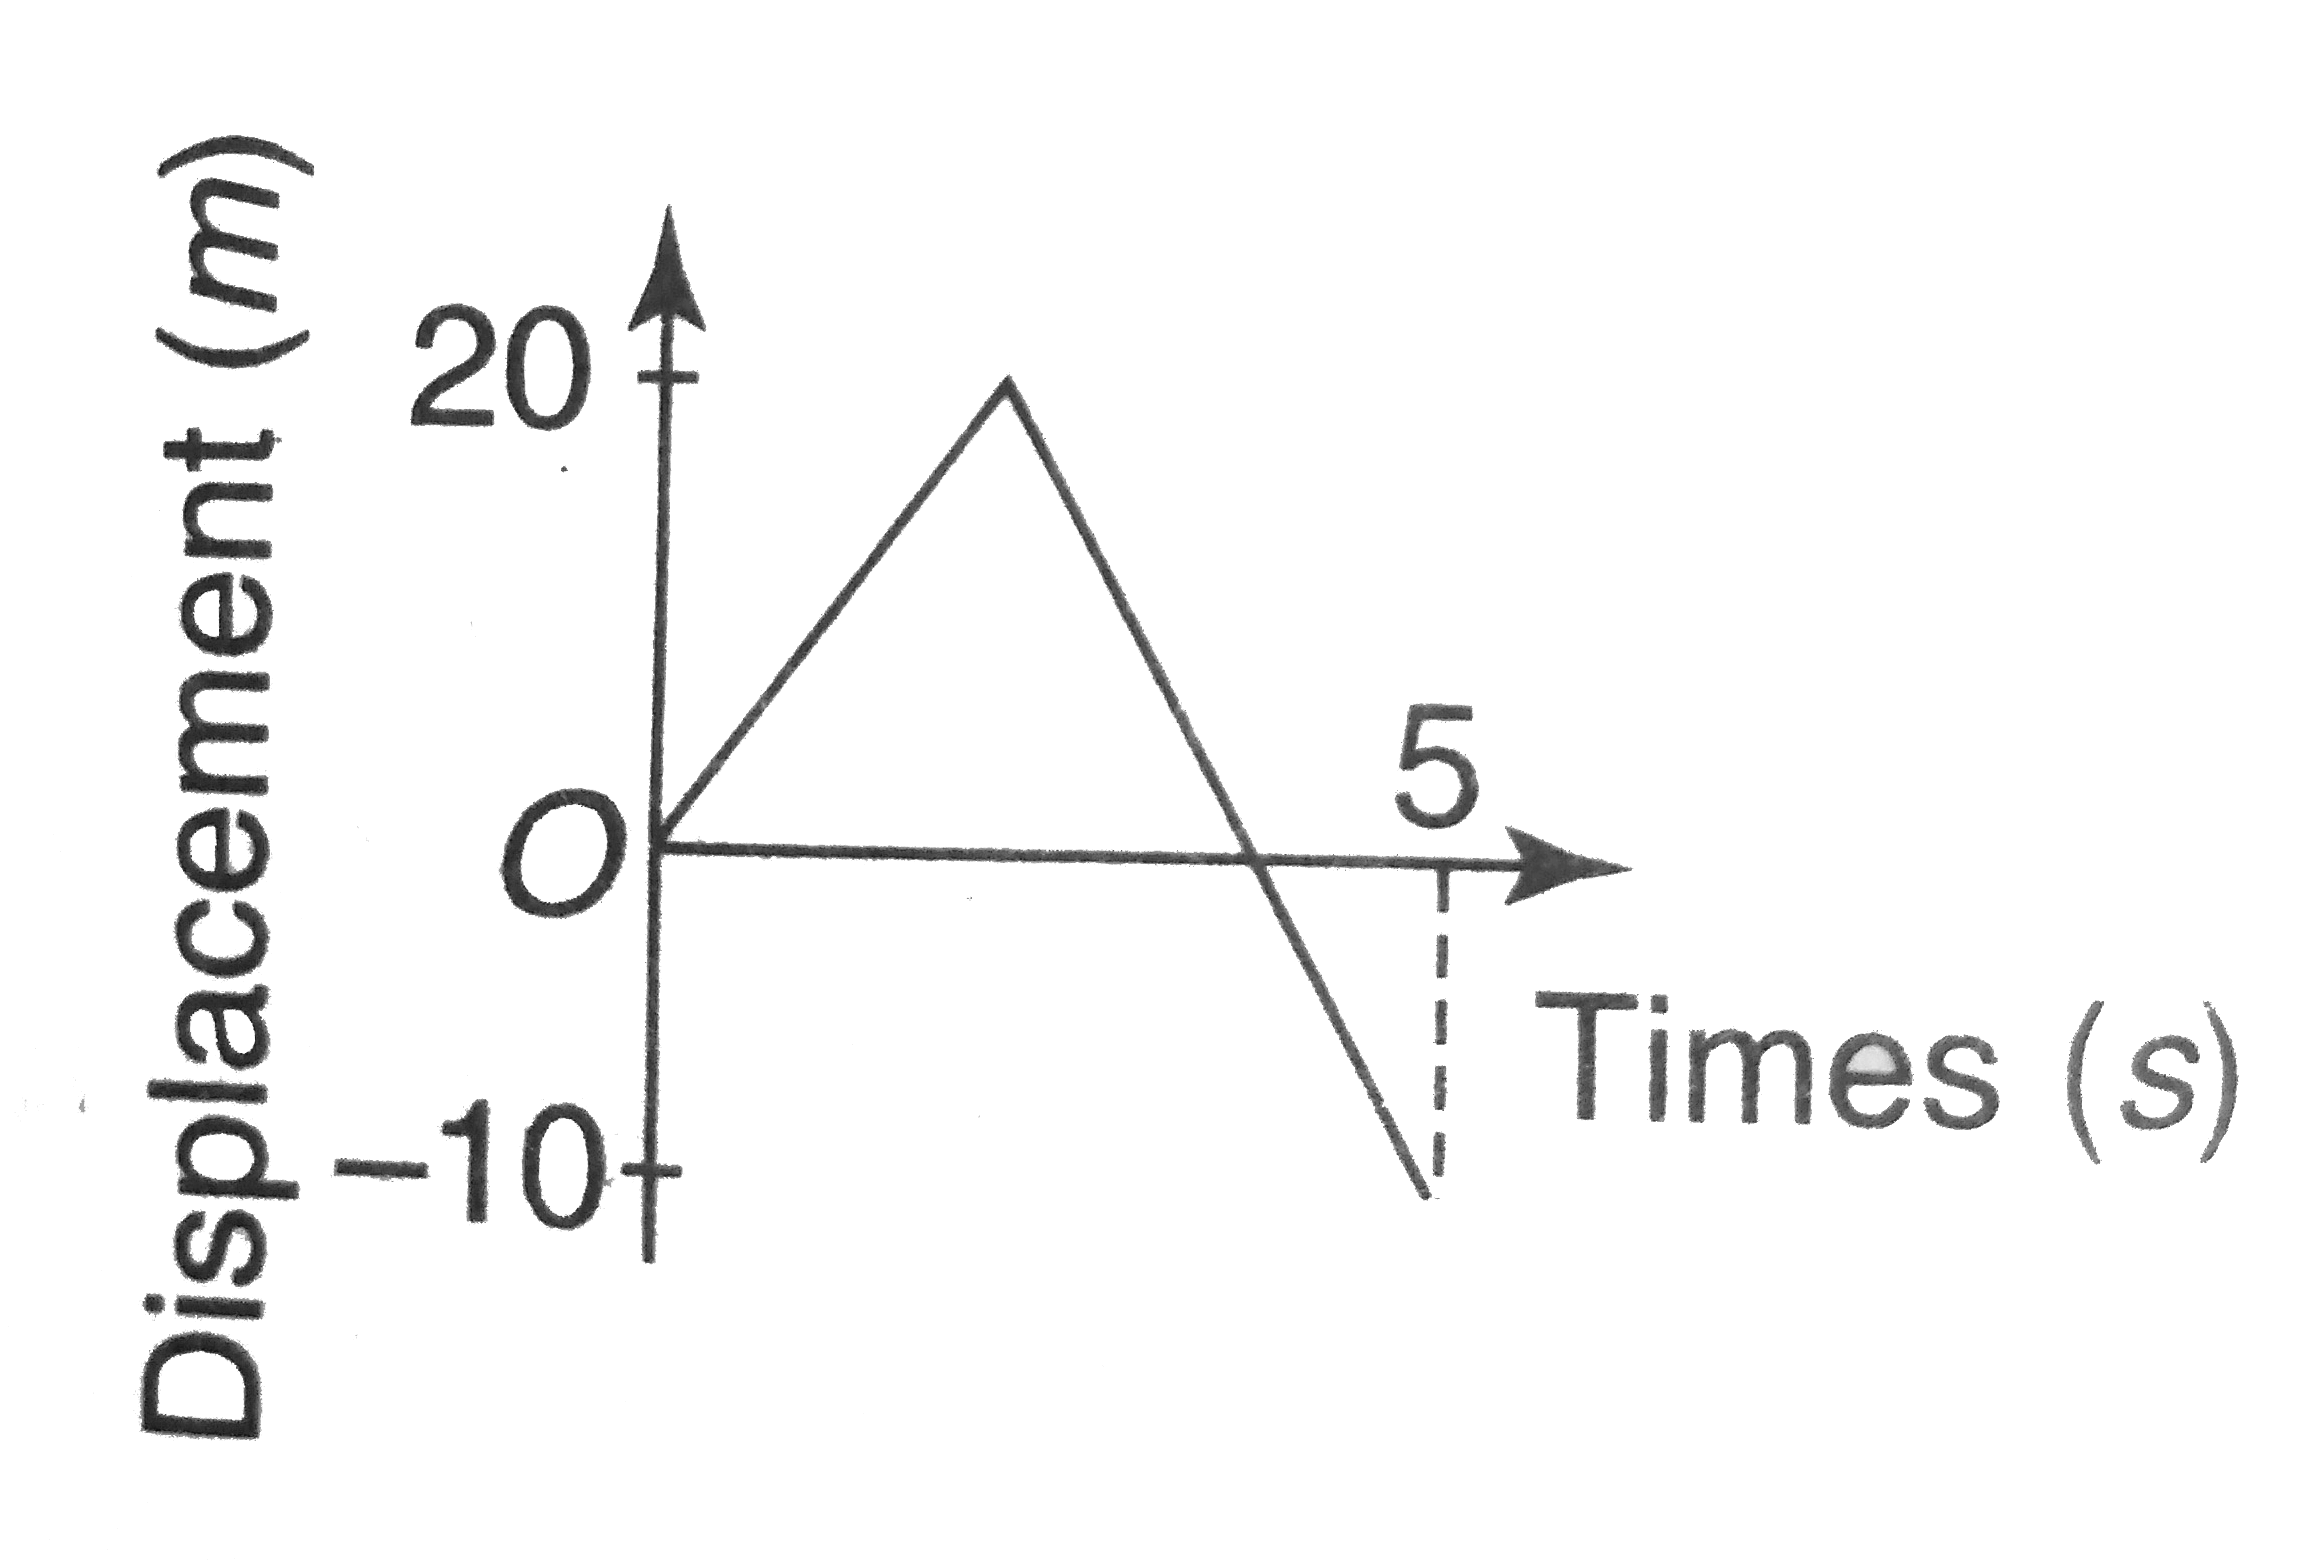
View SolutionThe diagram shows the displacement-time graph for a particle moving in a straight line. Find the average velocity for the interval from t=0 to t=5s.

View SolutionThe distance-time graph of a particle moving along a curved path is a straight line .
View SolutionVelocity versus displacement graph of a particle moving in a straight line as shown in figure.
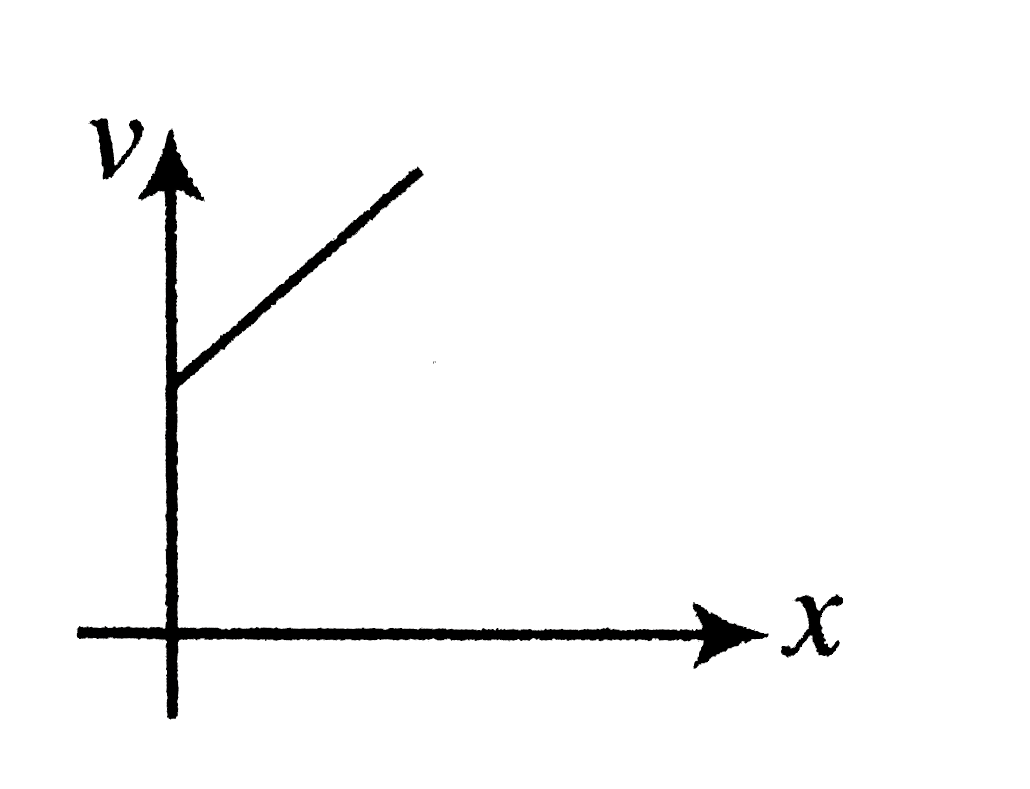
The acceleration of the particle.
View Solution


