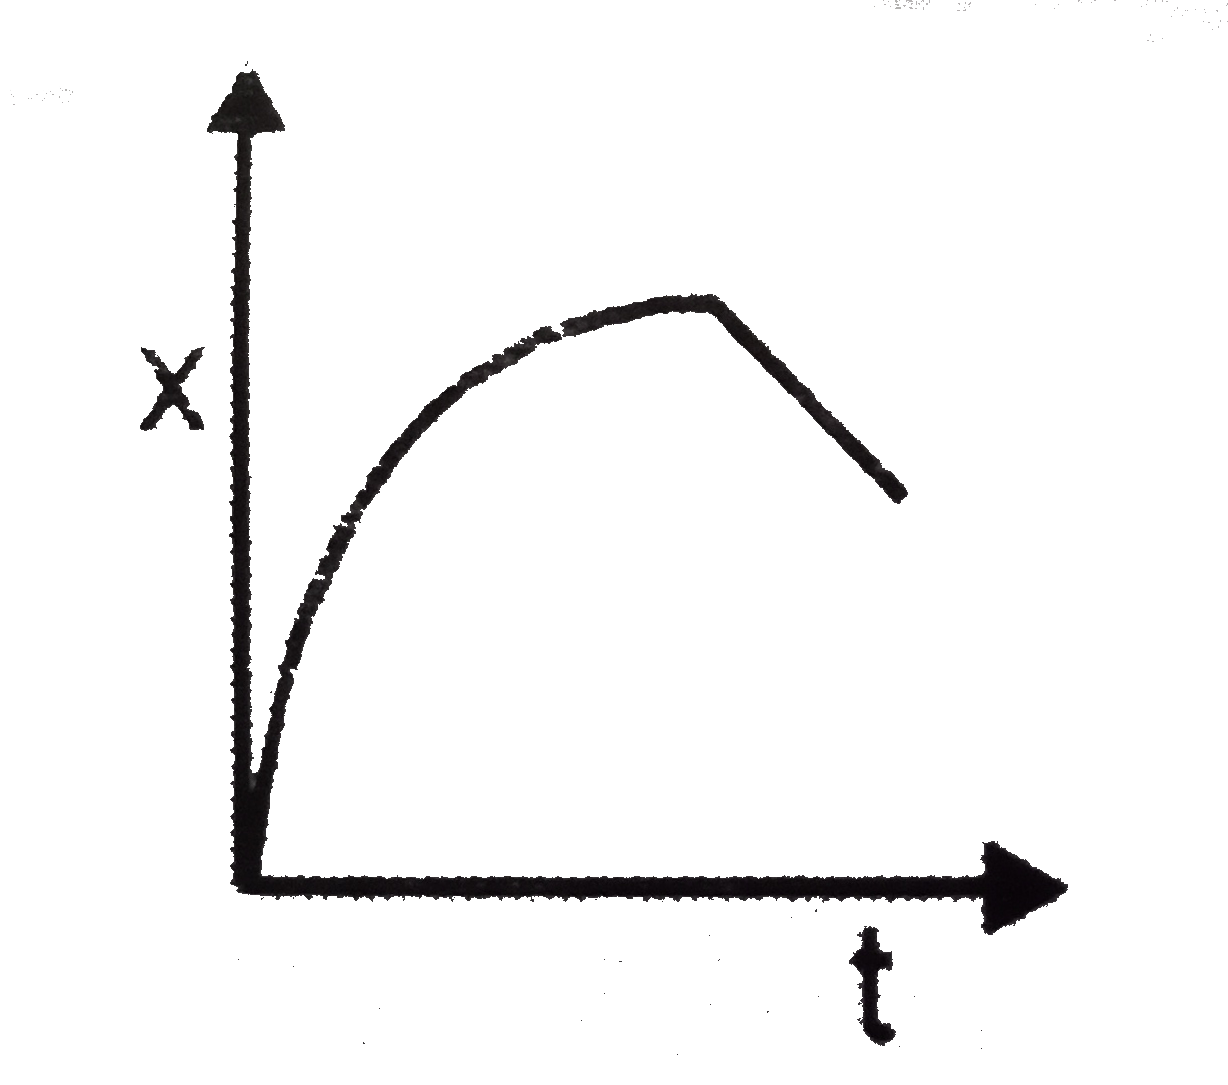
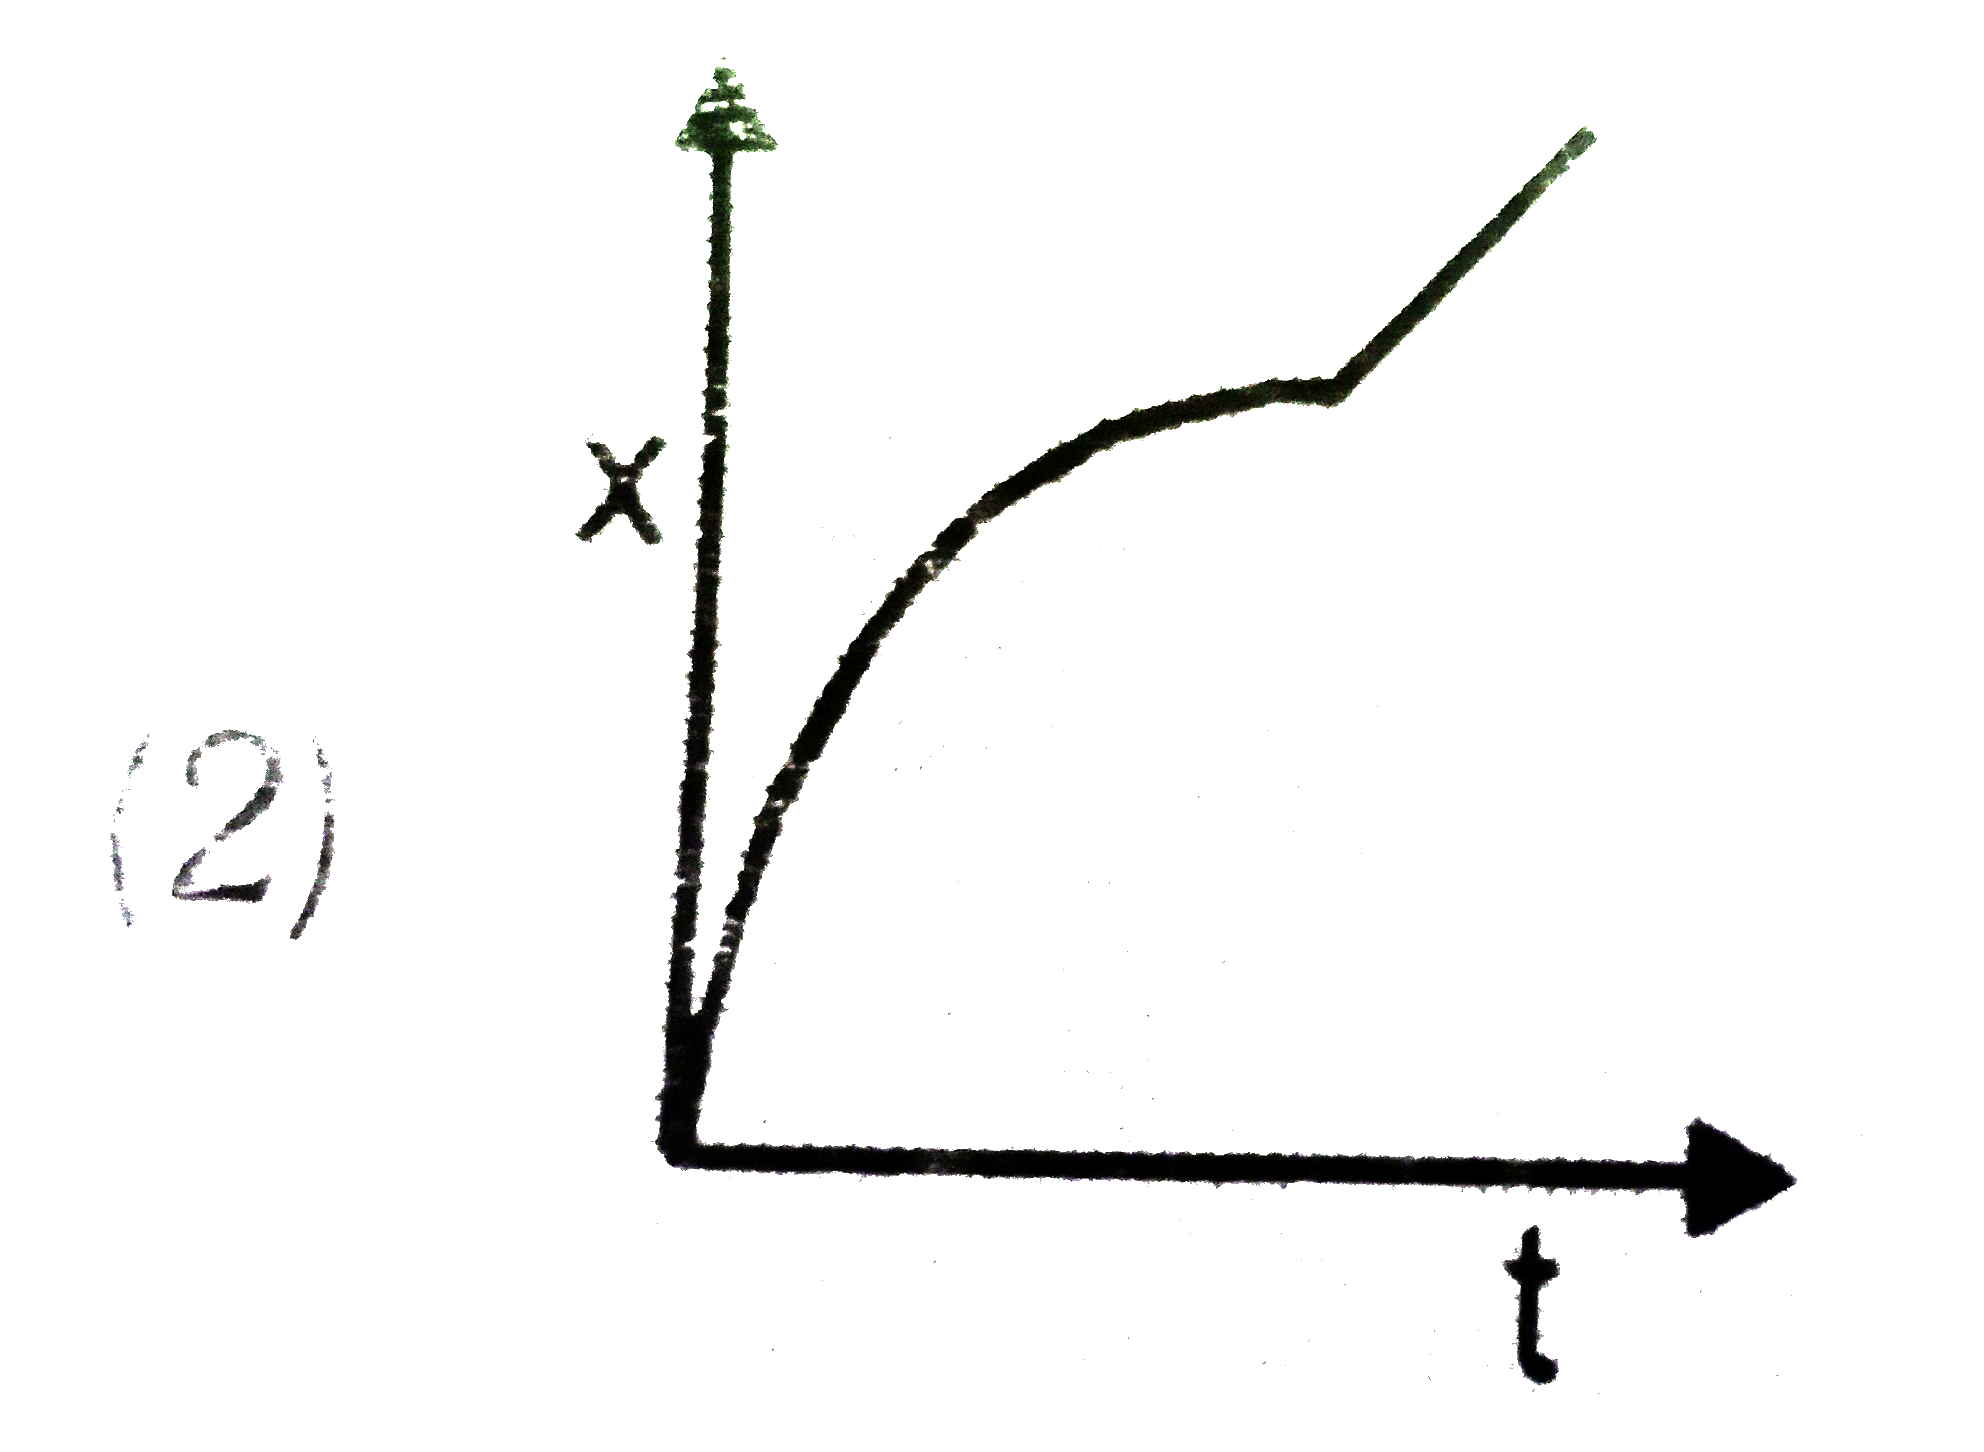
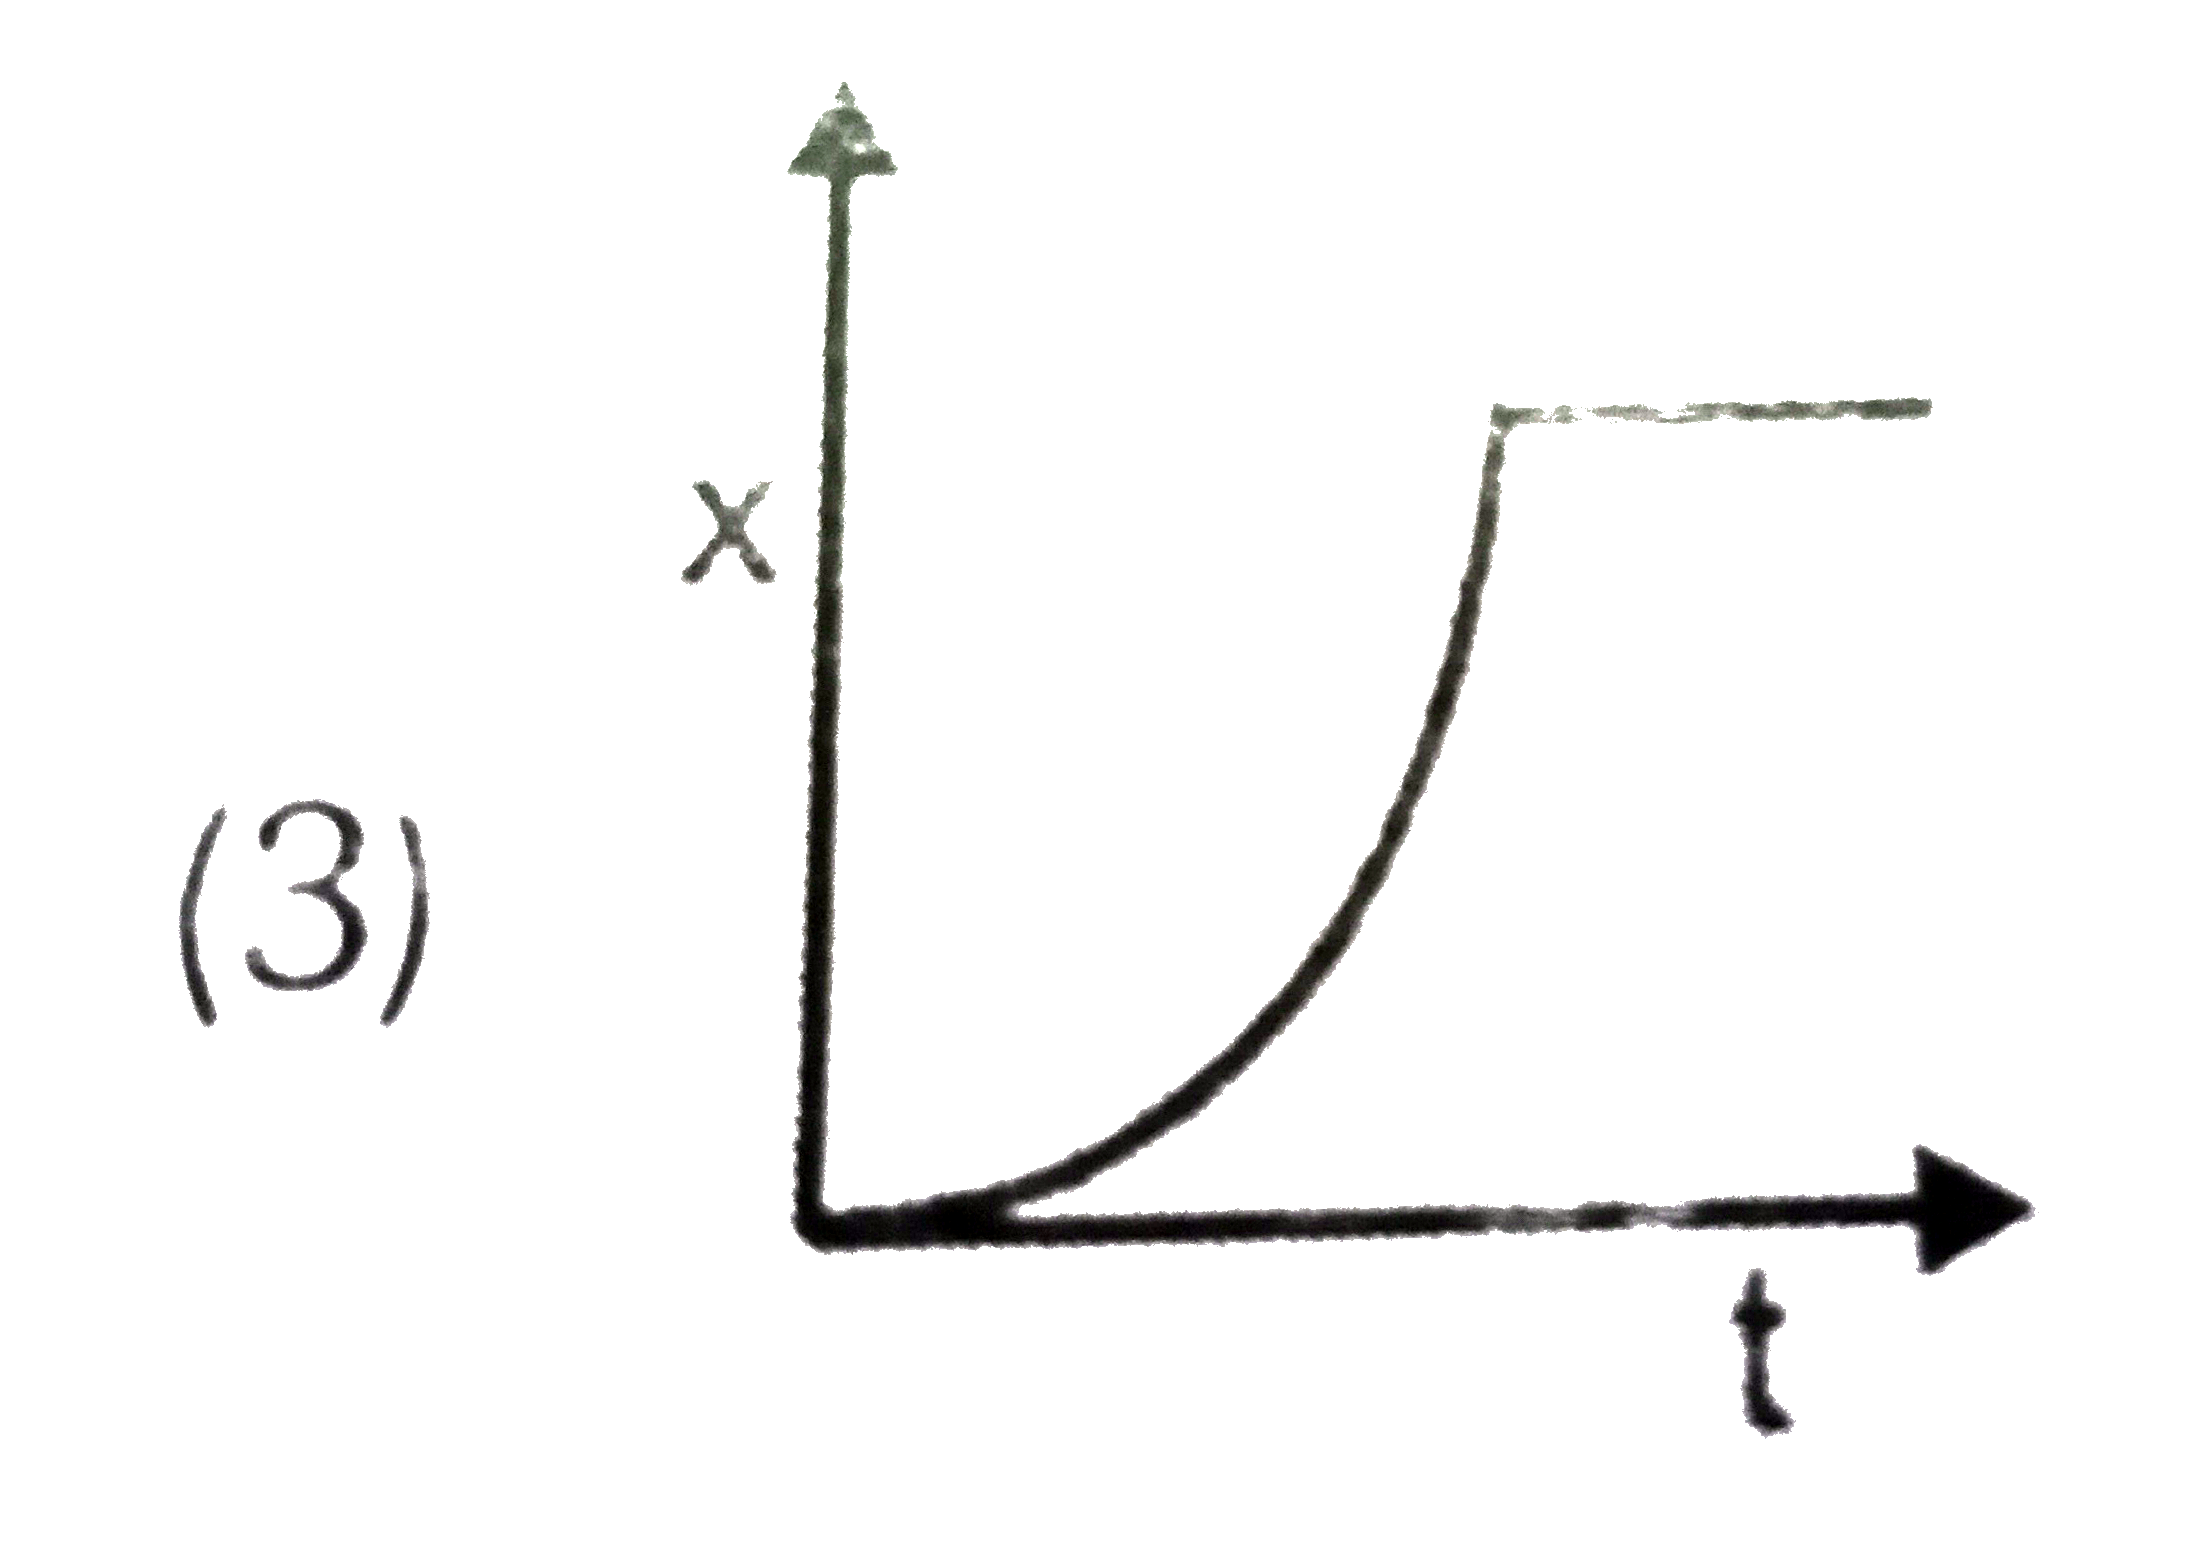
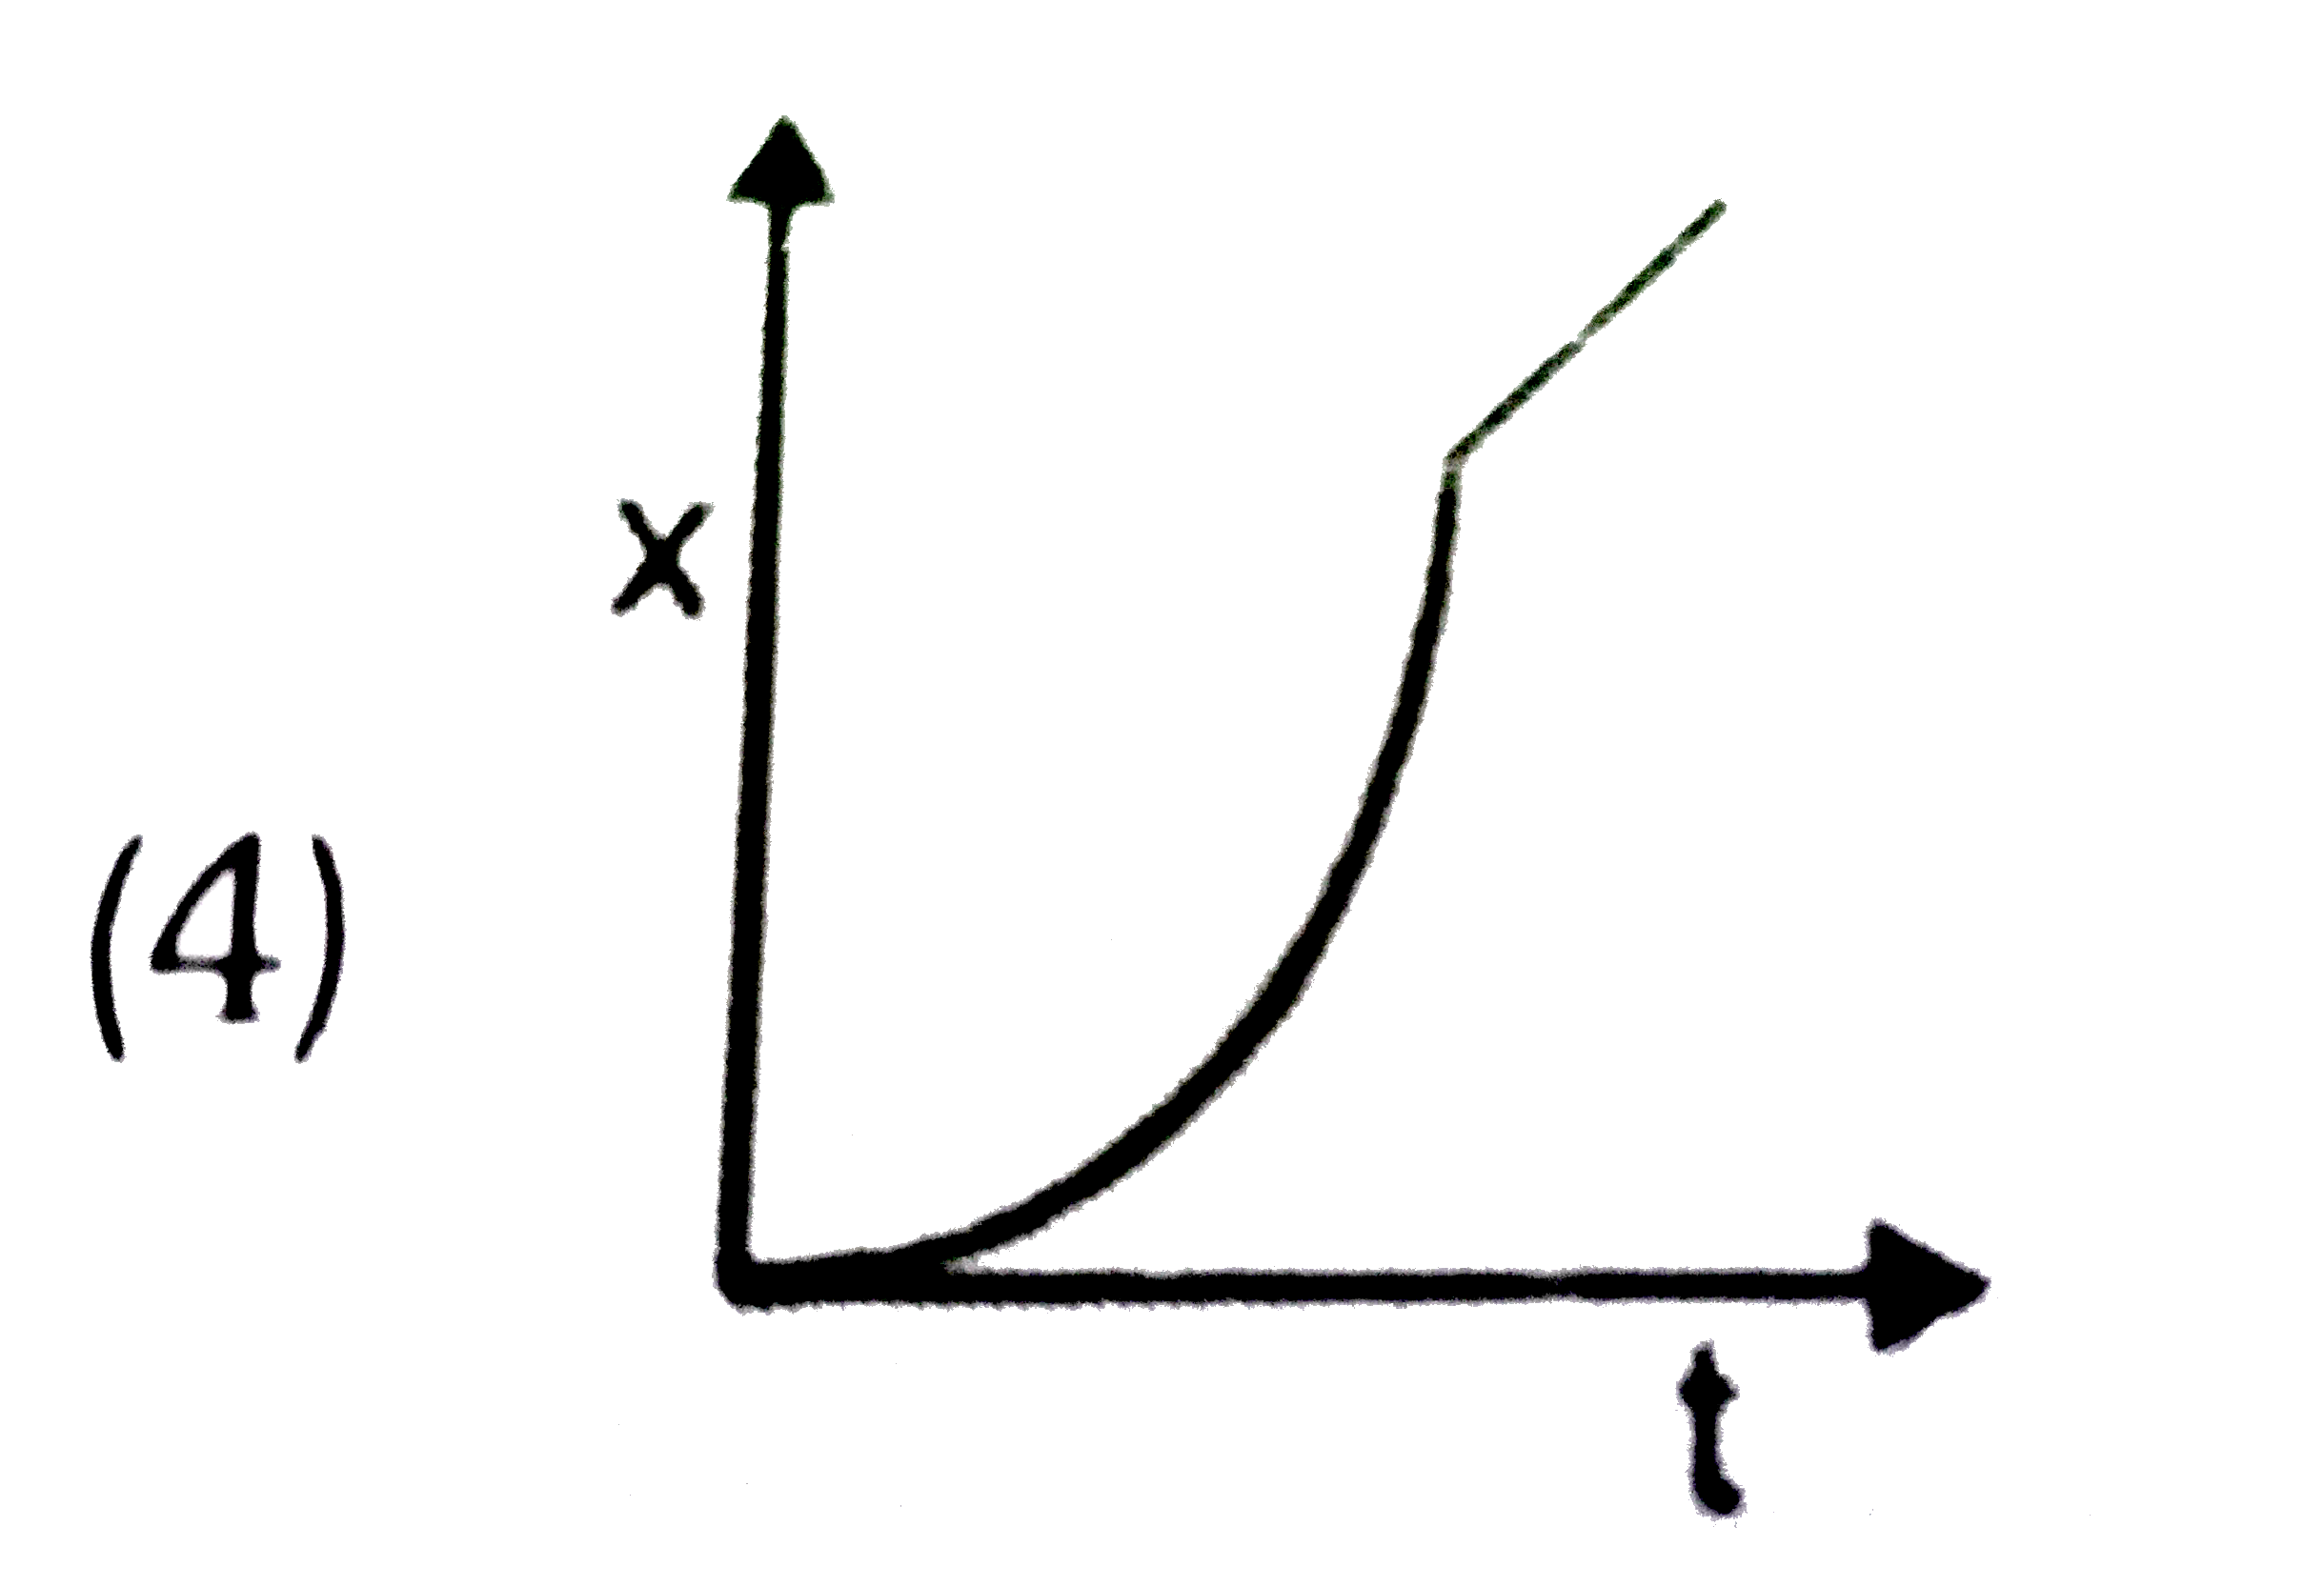
A car starts from erest accelerates uniform by for 4 second and then moves with uniform velocity which of the x-t graph represent th motion of the car:-
The correct Answer is:D
To solve the problem of determining which x-t graph represents the motion of a car that starts from rest, accelerates uniformly for 4 seconds, and then moves with uniform velocity, we can break down the motion into two distinct phases:
Step 1: Understand the Motion Phases
1. Phase 1 (0 to 4 seconds): The car starts from rest and accelerates uniformly.
- Initial velocity (u) = 0 m/s
- Acceleration (a) = constant
- Time (t) = 4 seconds
2. Phase 2 (after 4 seconds): The car moves with a uniform velocity (constant speed).
- After 4 seconds, the car will continue to move at the velocity it reached at the end of the acceleration phase.
Step 2: Analyze Phase 1
- Since the car starts from rest and accelerates uniformly, the displacement (x) during this phase can be described by the equation:
x=ut+12at2
Given that u=0, the equation simplifies to:
x=12at2
- The graph of displacement (x) versus time (t) will be a parabola opening upwards, starting from the origin (0,0) since the car starts from rest.
Step 3: Analyze Phase 2
- After 4 seconds, the car moves with a constant velocity (v). The displacement during this phase can be represented as:
x=vt+C
where C is the displacement at t=4 seconds.
- The graph of displacement (x) versus time (t) during this phase will be a straight line with a constant slope (the slope represents the constant velocity).
Step 4: Combine Both Phases
- The overall x-t graph will consist of:
- A parabolic curve from t=0 to t=4 seconds (Phase 1).
- A straight line with a constant slope starting from the end of the parabola at t=4 seconds (Phase 2).
Step 5: Identify the Correct Graph
- The correct x-t graph will show:
- A curve that starts at the origin and curves upwards for the first 4 seconds.
- After 4 seconds, the graph will transition into a straight line that continues to rise at a constant slope.
Based on this analysis, the correct answer is option D, which represents the described motion.
1. Phase 1 (0 to 4 seconds): The car starts from rest and accelerates uniformly.
- Initial velocity (u) = 0 m/s
- Acceleration (a) = constant
- Time (t) = 4 seconds
- After 4 seconds, the car will continue to move at the velocity it reached at the end of the acceleration phase.
- Since the car starts from rest and accelerates uniformly, the displacement (x) during this phase can be described by the equation:
x=ut+12at2
Given that u=0, the equation simplifies to:
x=12at2
- The graph of displacement (x) versus time (t) will be a parabola opening upwards, starting from the origin (0,0) since the car starts from rest.
- After 4 seconds, the car moves with a constant velocity (v). The displacement during this phase can be represented as:
x=vt+C
where C is the displacement at t=4 seconds.
- The graph of displacement (x) versus time (t) during this phase will be a straight line with a constant slope (the slope represents the constant velocity).
- The overall x-t graph will consist of:
- A parabolic curve from t=0 to t=4 seconds (Phase 1).
- A straight line with a constant slope starting from the end of the parabola at t=4 seconds (Phase 2).
- The correct x-t graph will show:
- A curve that starts at the origin and curves upwards for the first 4 seconds.
- After 4 seconds, the graph will transition into a straight line that continues to rise at a constant slope.
Topper's Solved these Questions
- MOTION IN A PALNEBOOK - ALLENCHAPTER - MOTION IN A PALNEEXERCISE - EXERCISE-3
41 Videos
- MOTION IN A PALNEBOOK - ALLENCHAPTER - MOTION IN A PALNEEXERCISE - SOLVED EXAMPLE
28 Videos
- MOTION IN A PALNEBOOK - ALLENCHAPTER - MOTION IN A PALNEEXERCISE - EXERCISE-1
99 Videos
- KINEMATICS-2DBOOK - ALLENCHAPTER - KINEMATICS-2DEXERCISE - Exercise (O-2)
48 Videos
- NEWTON'S LAWS OF MOTION & FRICTIONBOOK - ALLENCHAPTER - NEWTON'S LAWS OF MOTION & FRICTIONEXERCISE - EXERCISE (JA)
4 Videos
Similar Questions
Starting from rest a car accelerates unifromly with 3ms−2 for 5 s and then moves with uniform velocity. Drwa the distance-time graph of the motion of the car upto t = 7s.
View SolutionA car starts from rest and moves with uniform acceleration for time t then it moves with uniform speed of 60 km/h for time 3t and comes to rest. Find the average speed of car in its total journey.
View Solution
Knowledge Check
Which of the following graph represents uniform motion
A B
B C
C D
D
A body starts from rest and then moves with uniform acceleration. Then.
AIts displacement is directly proportional to square of timeBIts displacement is inversely proportion to the square of the time.CIt may move along a circle.DIt always moves in a straight line.Which graph represents the uniform acceleration
A B
B C
C D
D
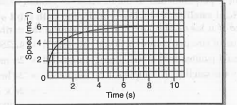
Speed - time graph for a car is show in the fig 1.13:Which part of the graph represents uniform motion of the car ?
View SolutionConsider the following statements: Car I is parked near a post office II. Car II is moving along a straight road with uniform speed Which of the following distance?time graphs represents the motion of the respective cars?
View SolutionWhich of the following velocity-time graphs (v−tgraph) represent uniform motion
View SolutionA body moves for a total of nine second starting from rest with uniform acceleration and then with uniform retardation, which is twice the value of acceleration and then stop. The duration of uniform acceleration is
View SolutionA body moves with uniform velocity. Which of the graphs shown here is a graph of velocity against time for this motion?
View Solution