A person walks along an east-west street and a graph of his displacement from home is shown in figure. His average velocity for the whole time interval is :-
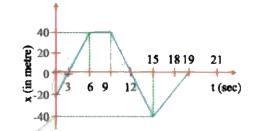
1.05 ms−1
23 ms−1
8.4 ms−1
None of above
The correct Answer is:A
Step by step video, text & image solution for A person walks along an east-west street and a graph of his displacement from home is shown in figure. His average velocity for the whole time interval is :- by Physics experts to help you in doubts & scoring excellent marks in Class 11 exams.
Updated on:21/07/2023Similar Questions
Knowledge Check
A girl walks along an east-west street, and a graph of her displacement from home is as shown in figure. Her average velocity for the whole time interval is-
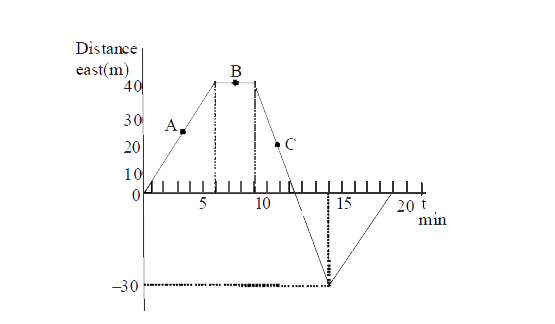 AZeroB6 m/minC11 m/ minD15 m/min
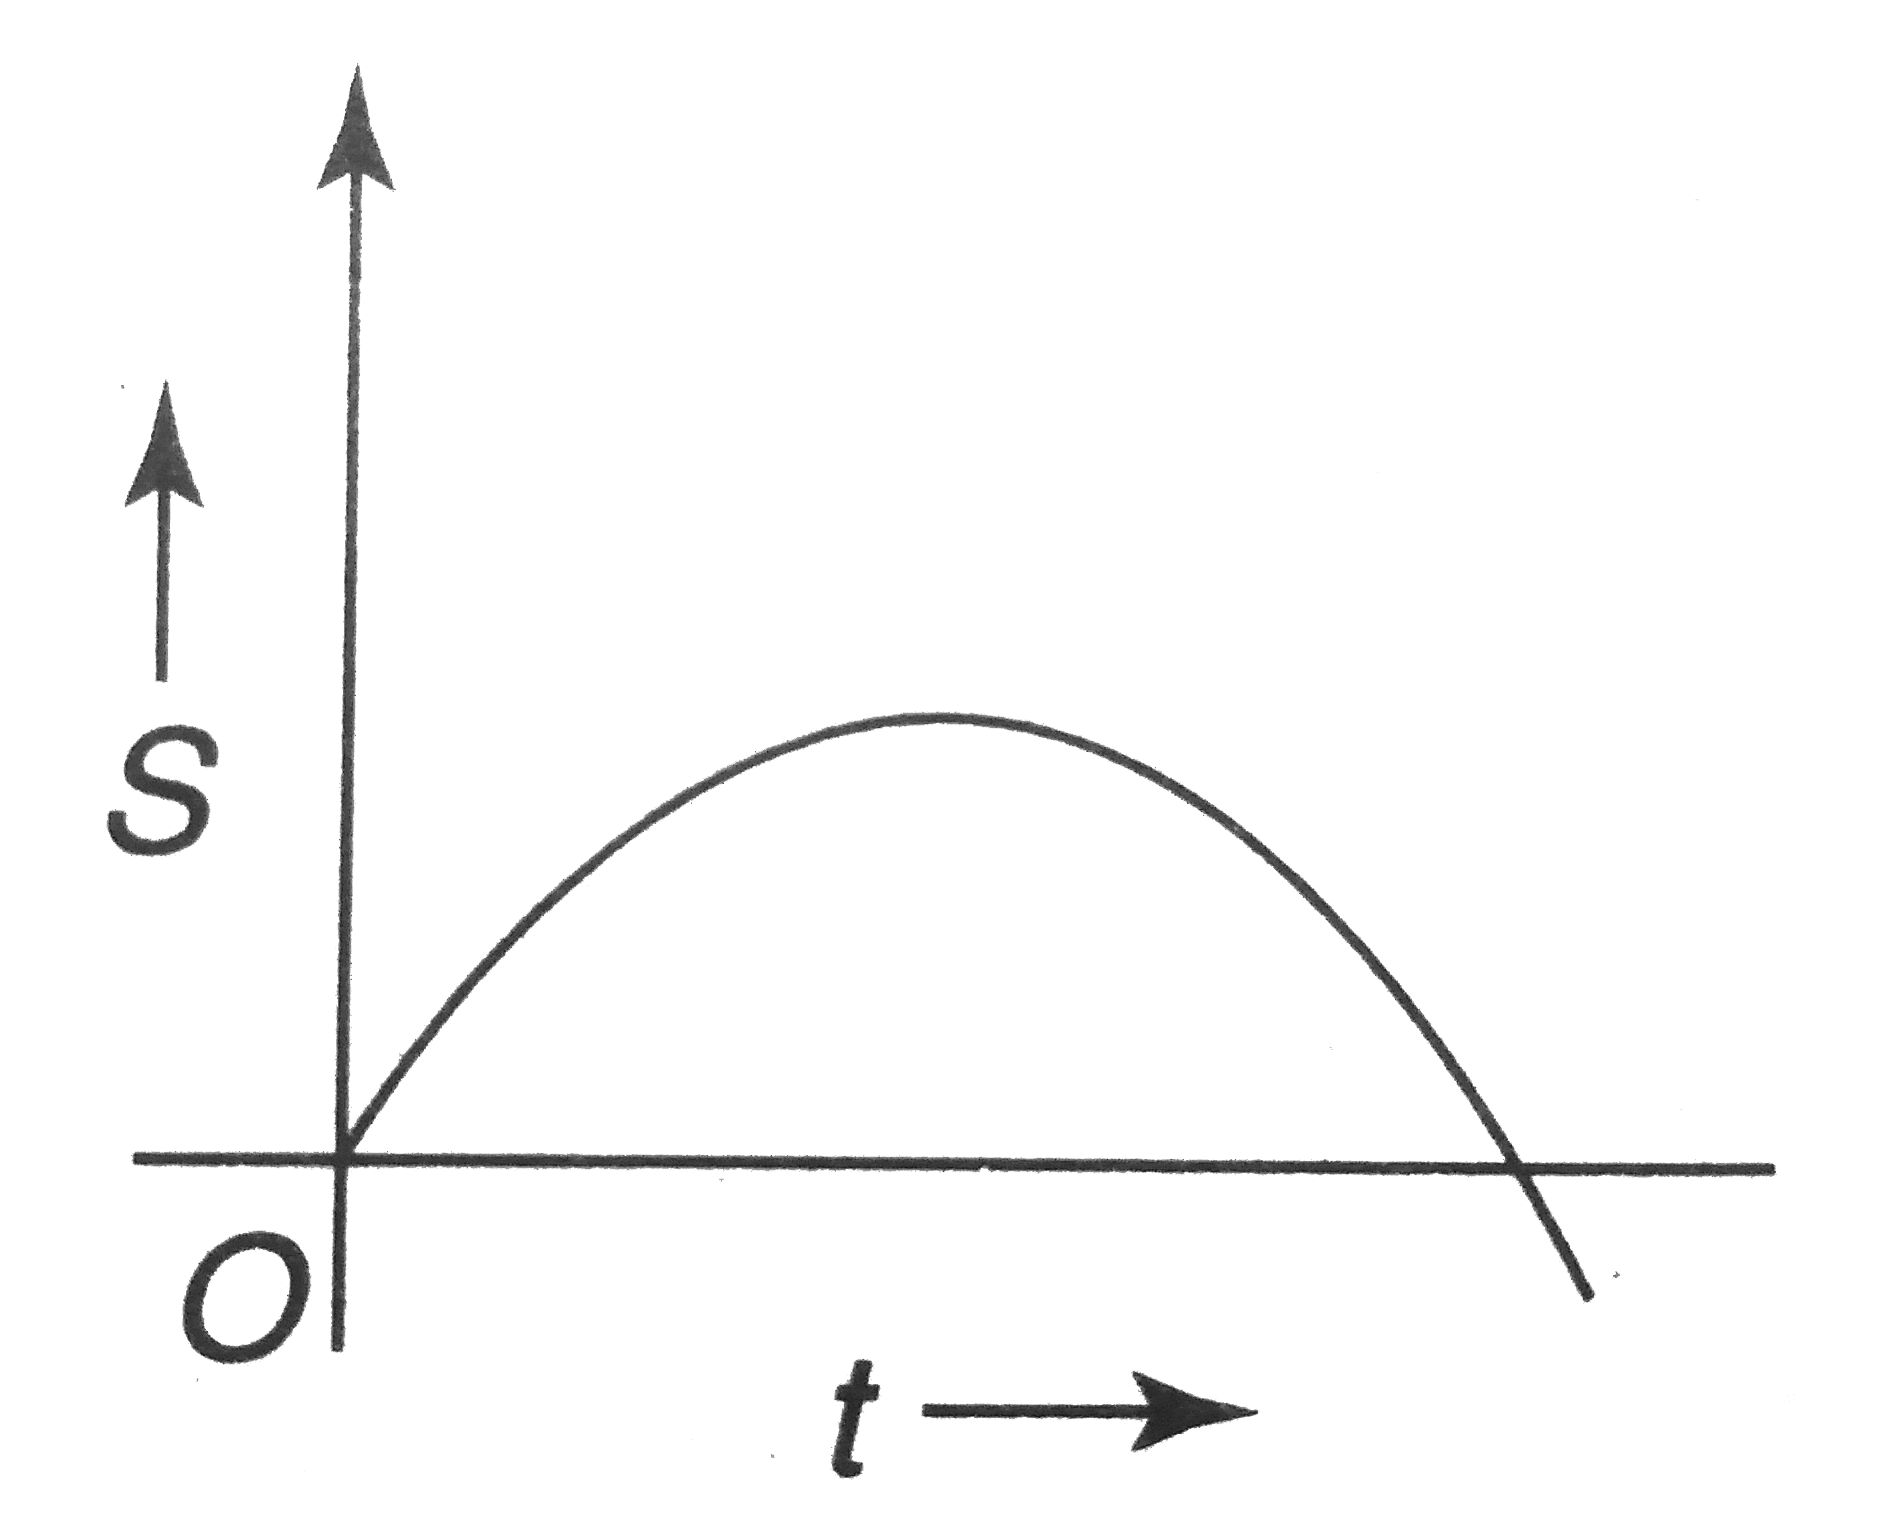
The graph of displacement versus time is shown. Its corresponding velocity-time graph will be.
 A
A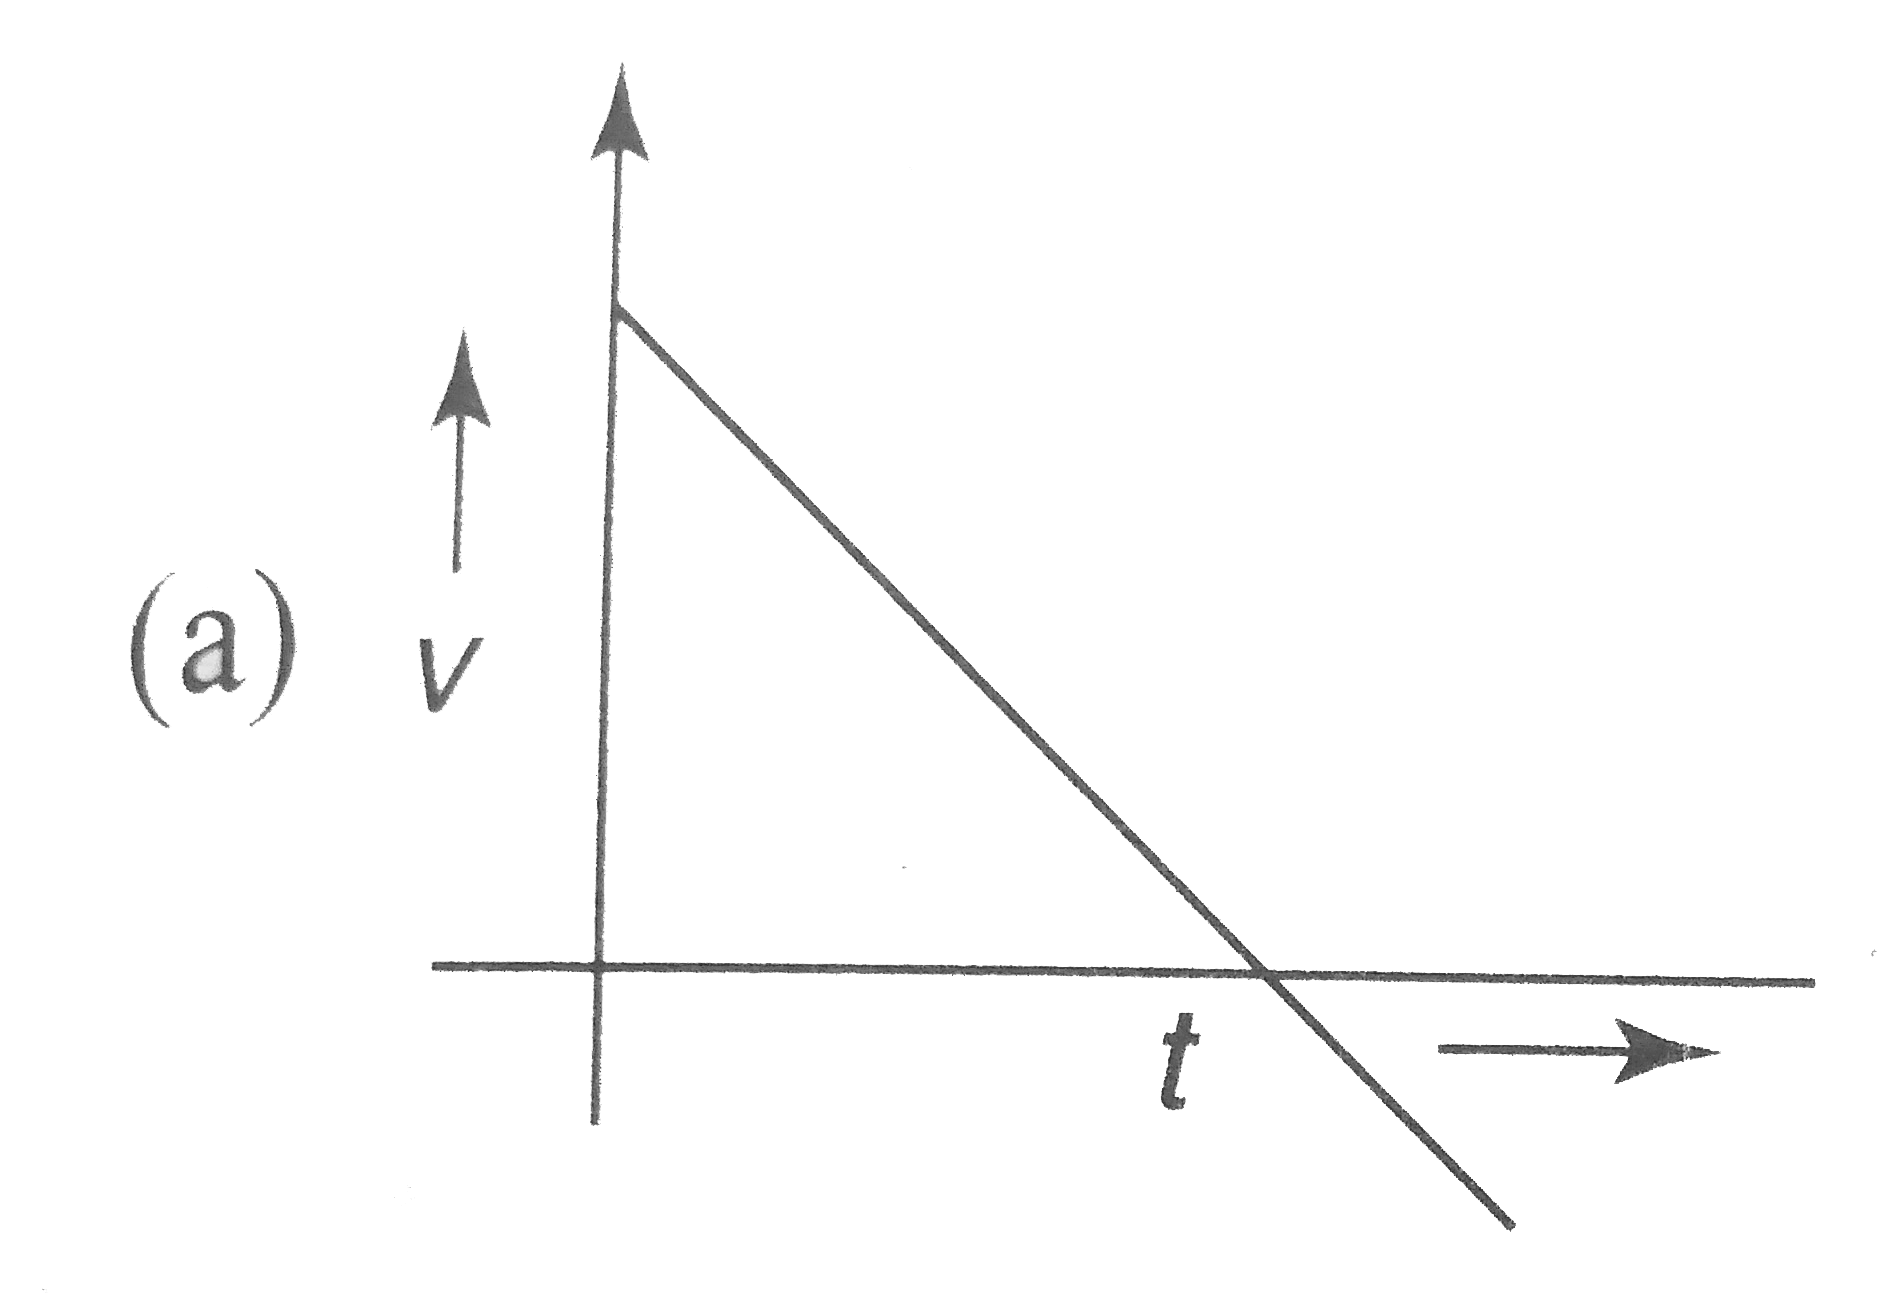 .B
.B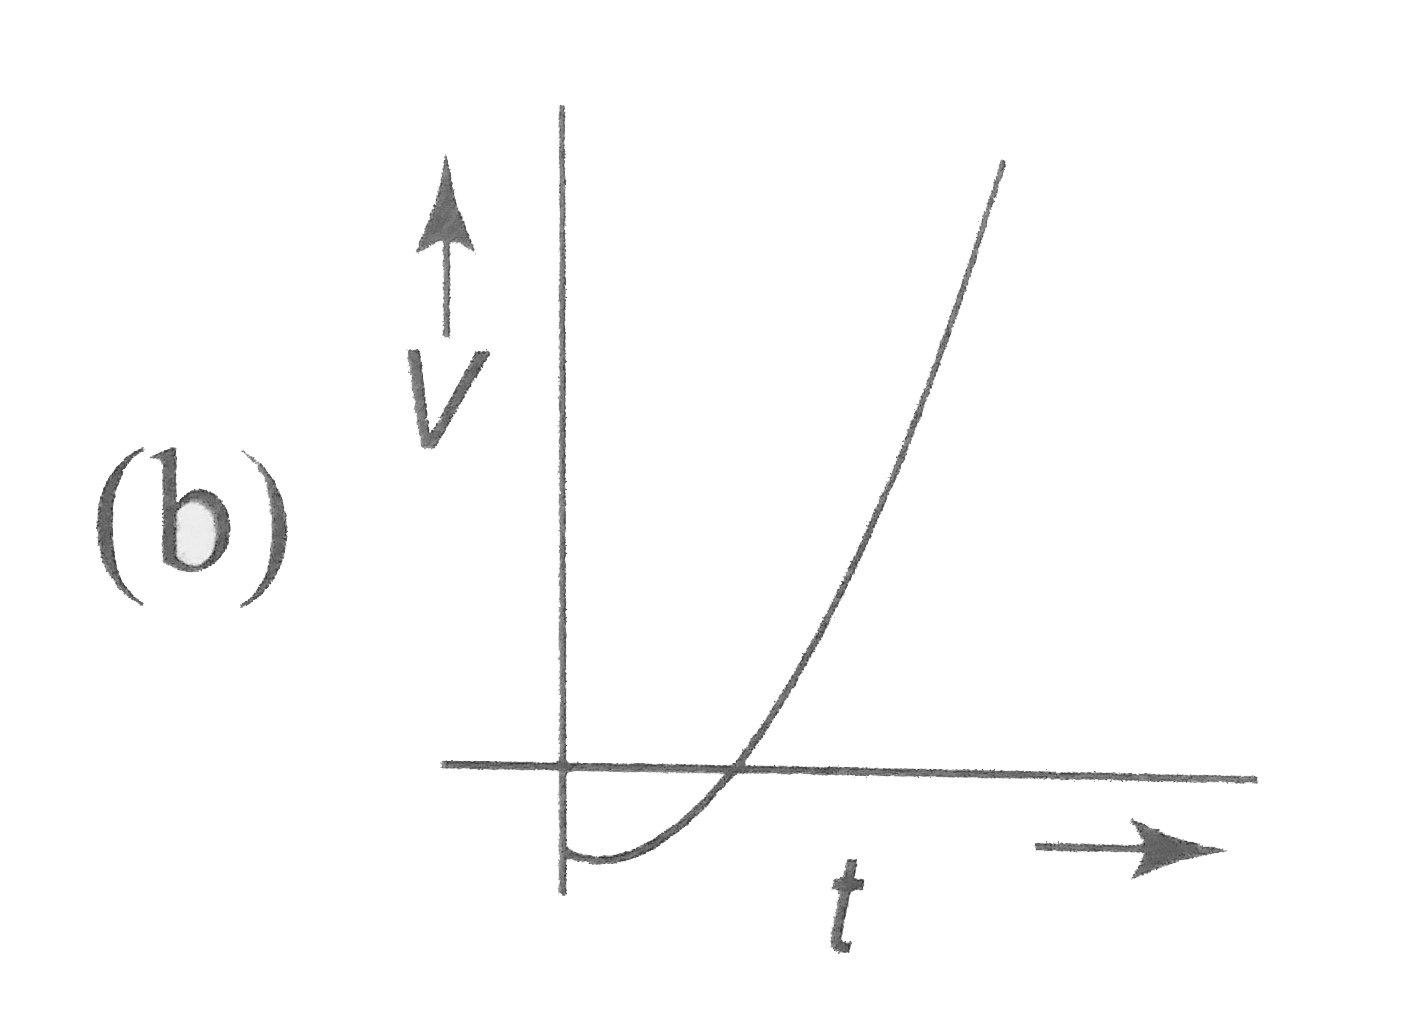 .C
.C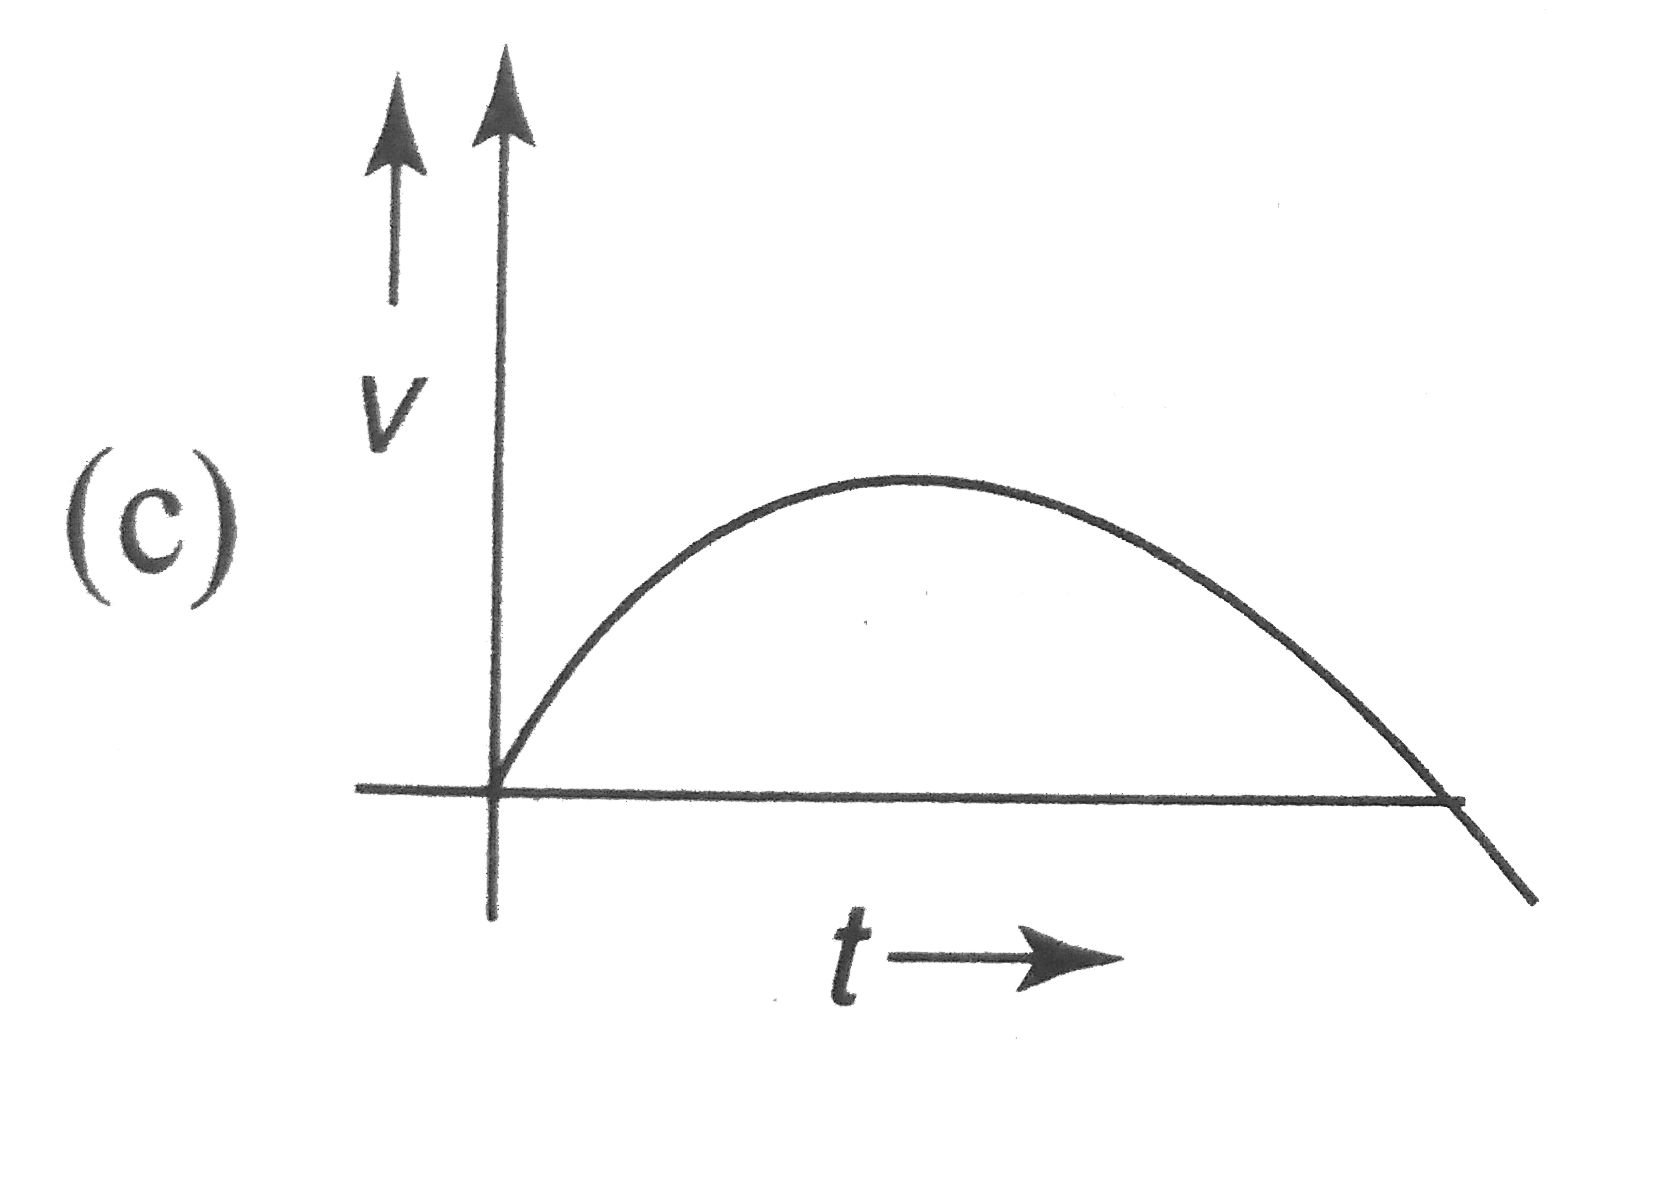 D
D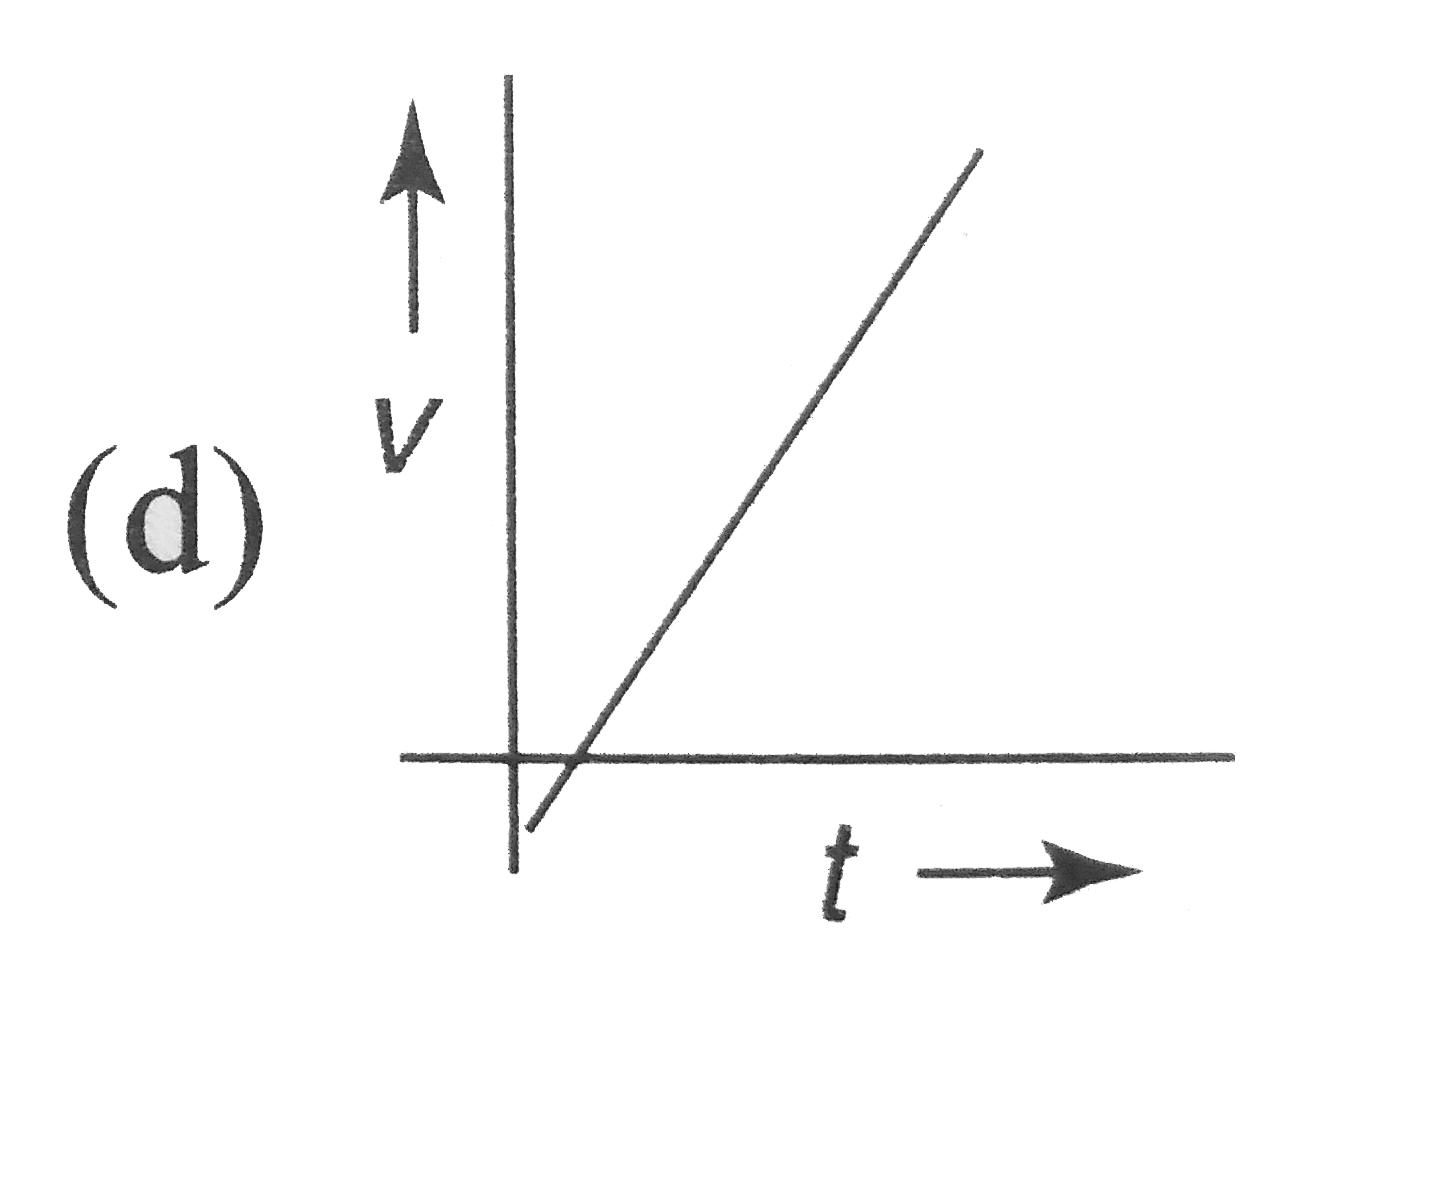 .
.The displacement time graph of a body is shown in figure. The velocity-time graph of the motion of the body will be
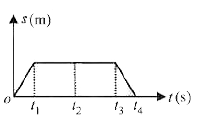 A
A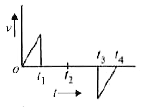 B
B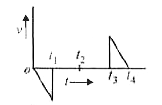 C
C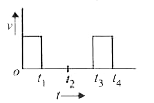 D
D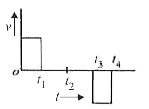
The velocity-time graph of a car moving along a straight road is shown in figure. The average velocity of the car in first 25 seconds is
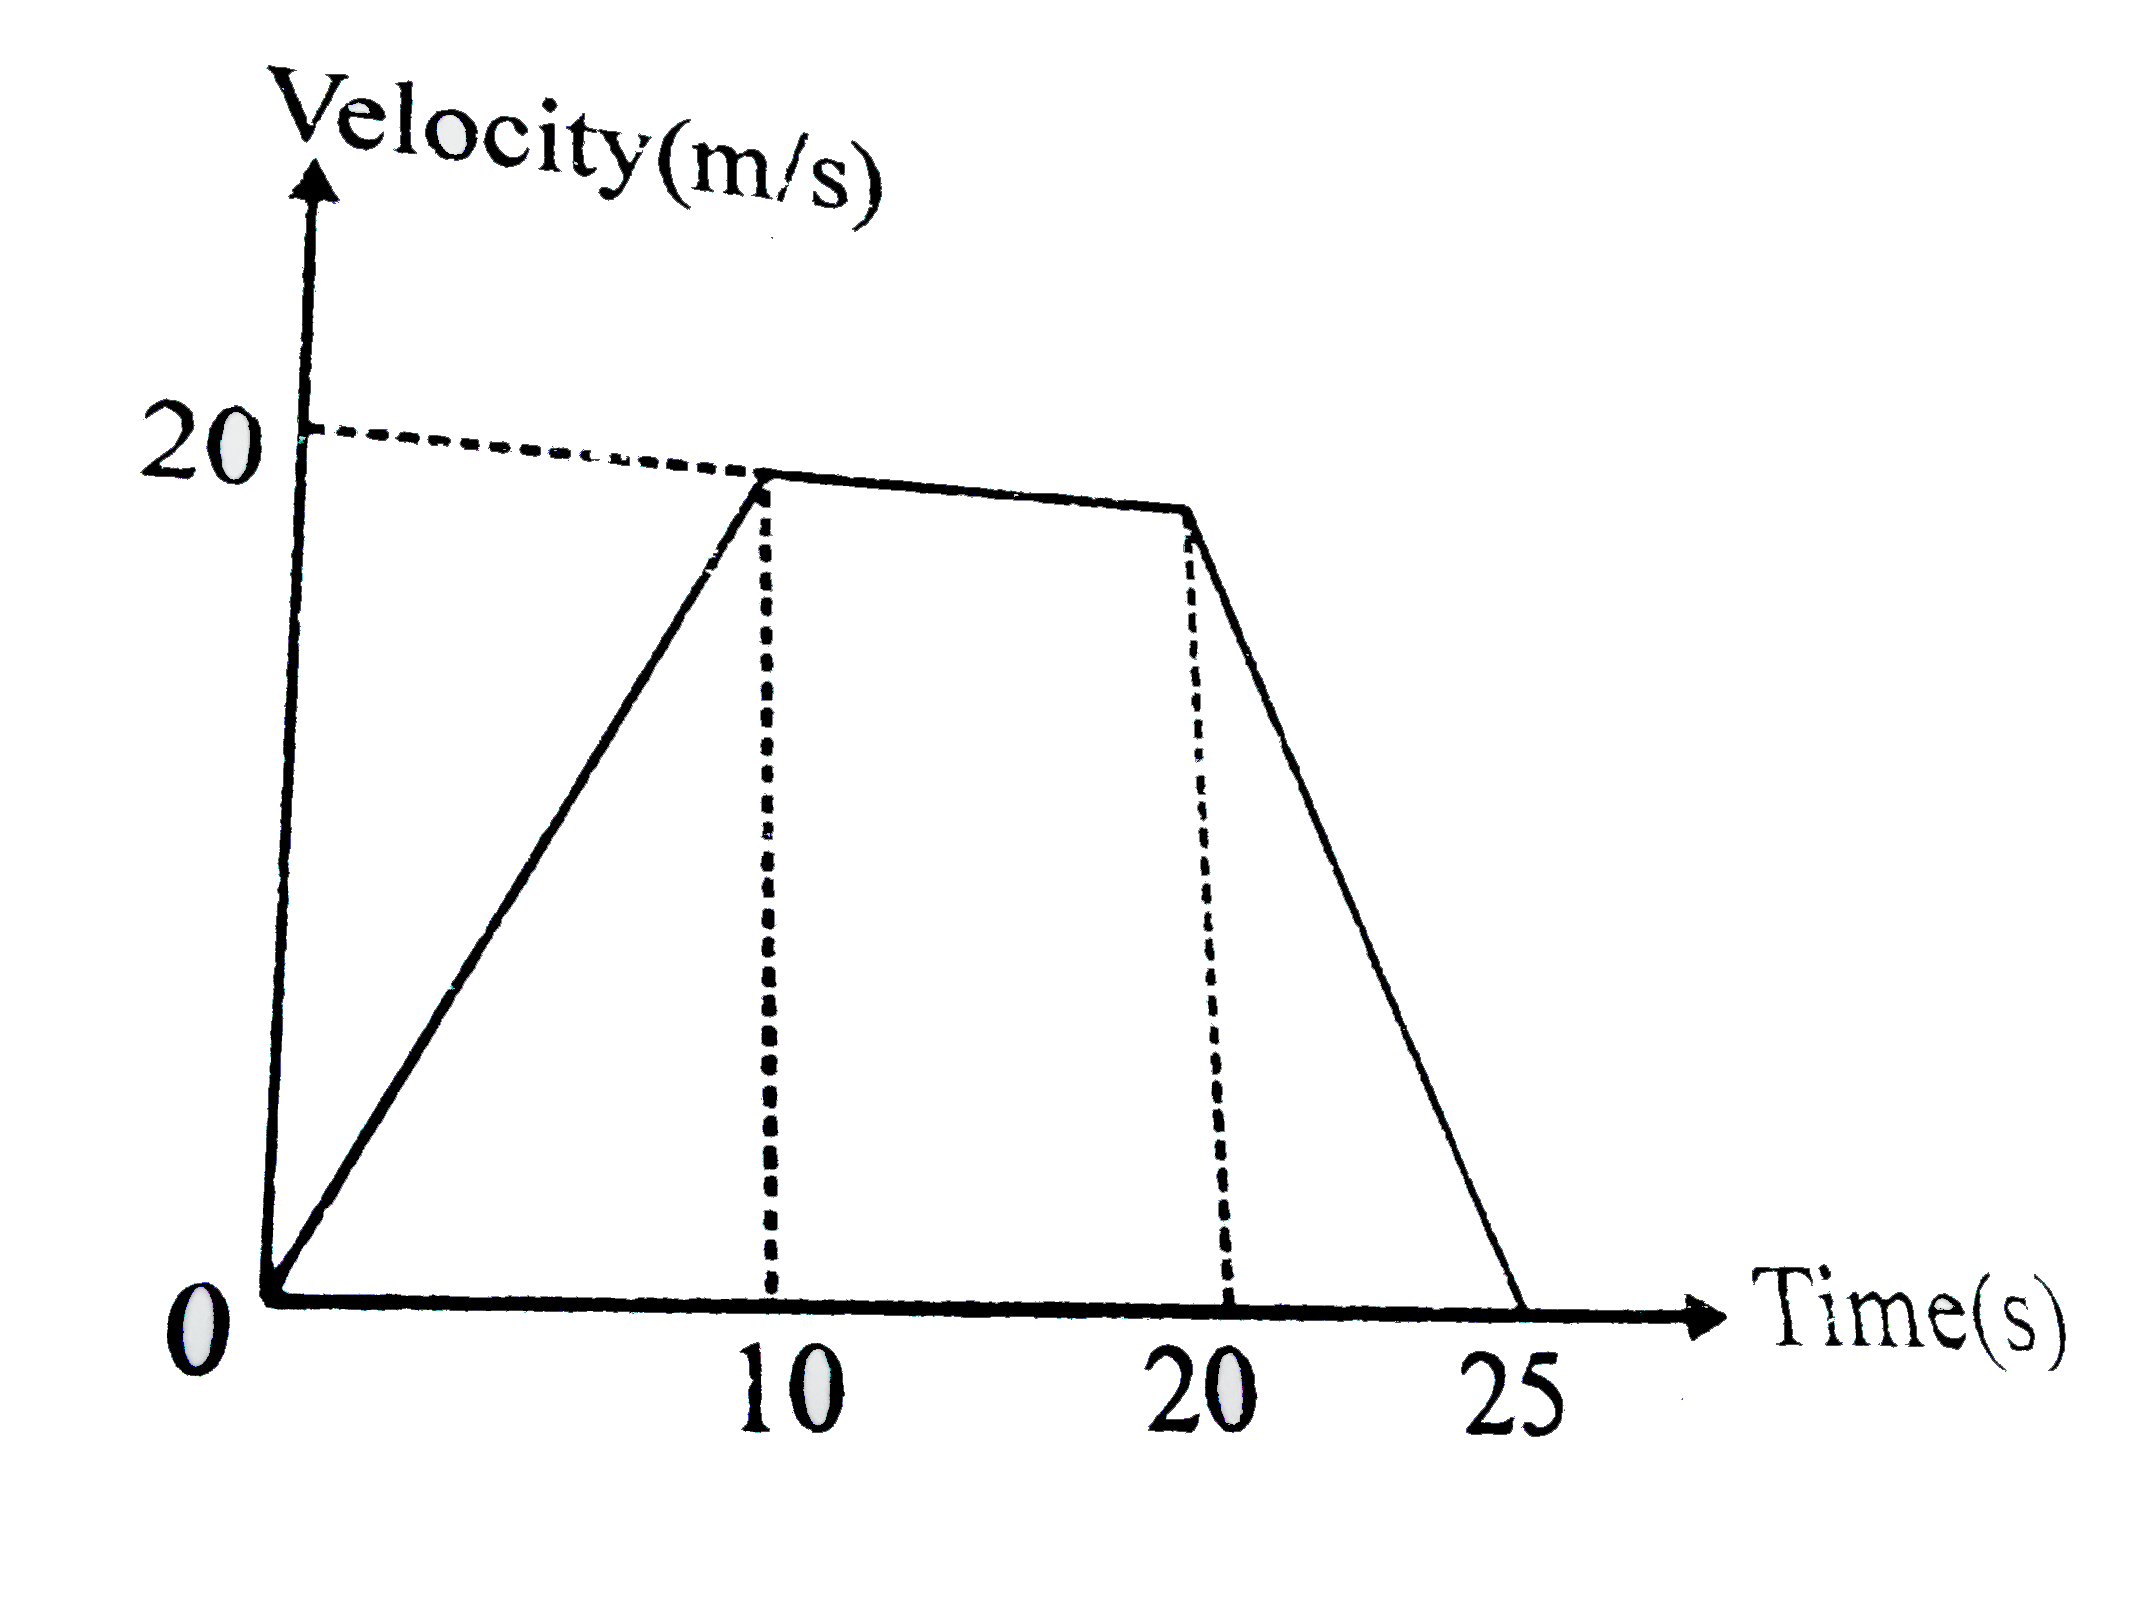
View SolutionThe velocity-time graph of a car moving along a straight road is shown in figure. The average velocity of the car is first 25 seconds is

View SolutionA particle is moving along a straight line whose velocity - displacement graph is shown in figure. What is the acceleration when displacement is 3 m?
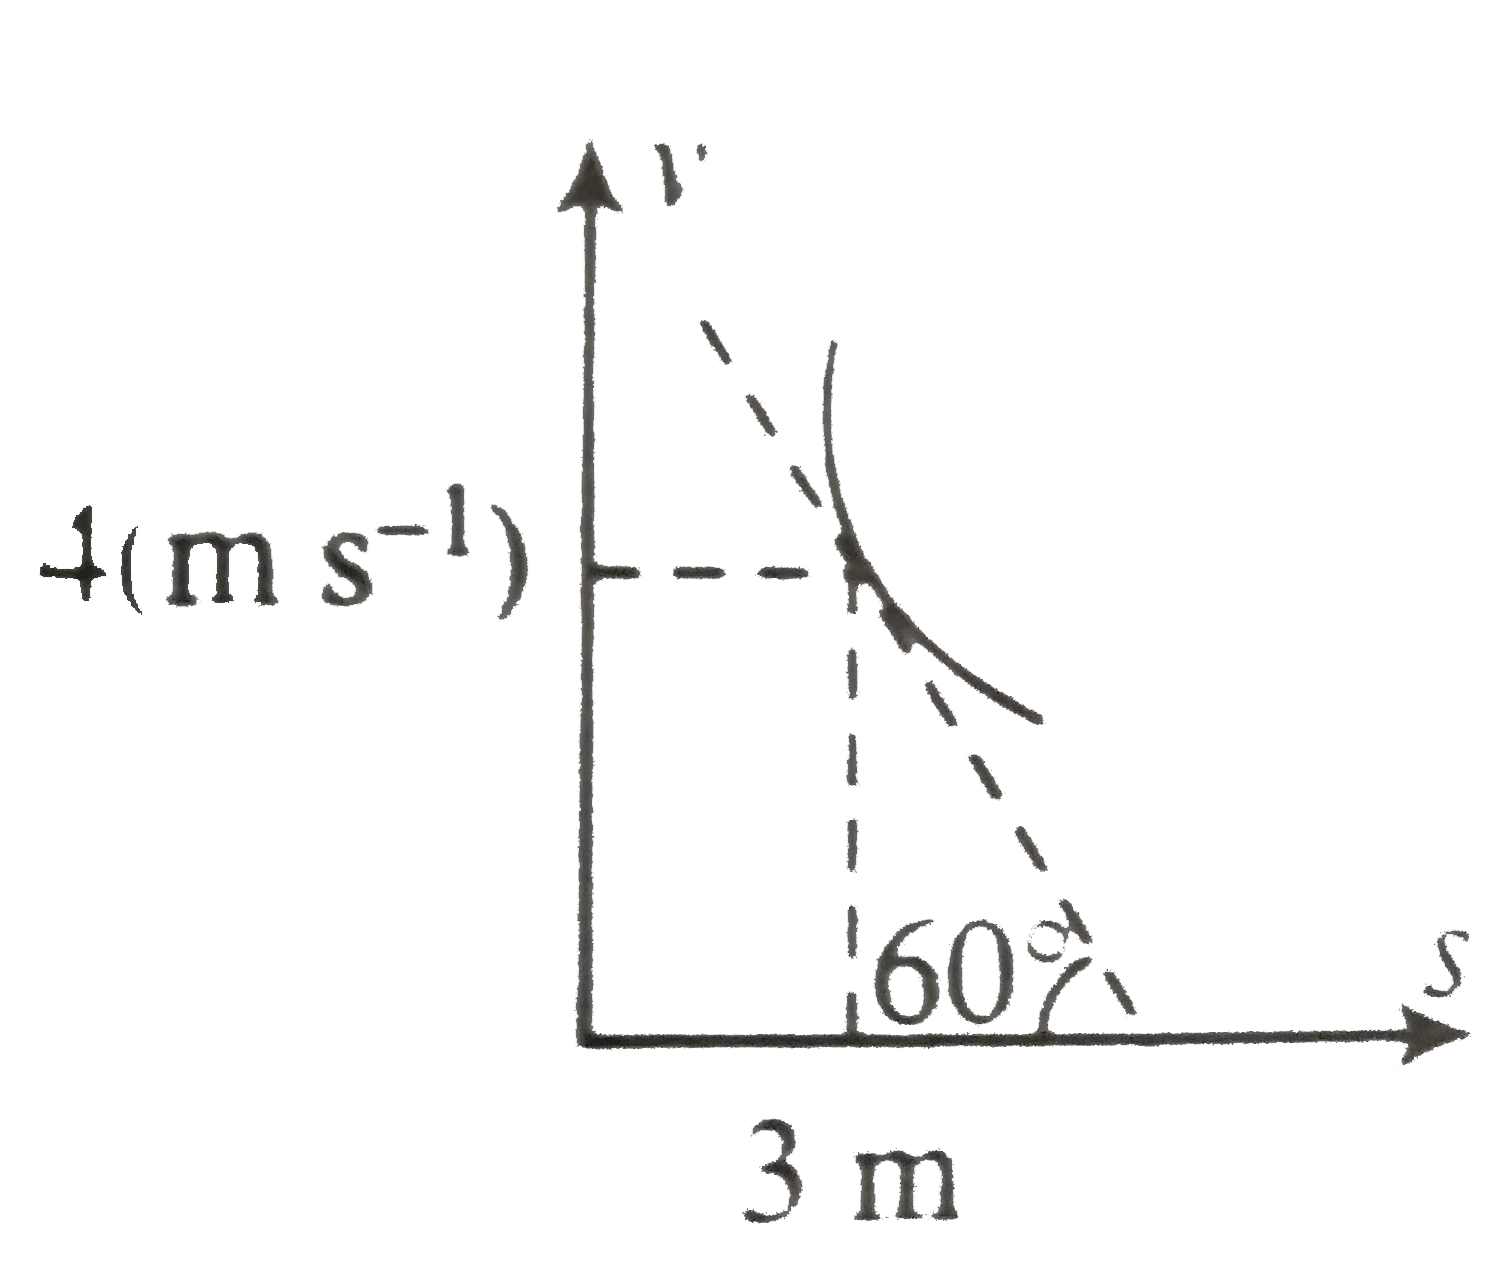
View SolutionThe velocity-time graph of a linear motion is shown in figure. The displacement & distance from the origin after 8 sec is :-
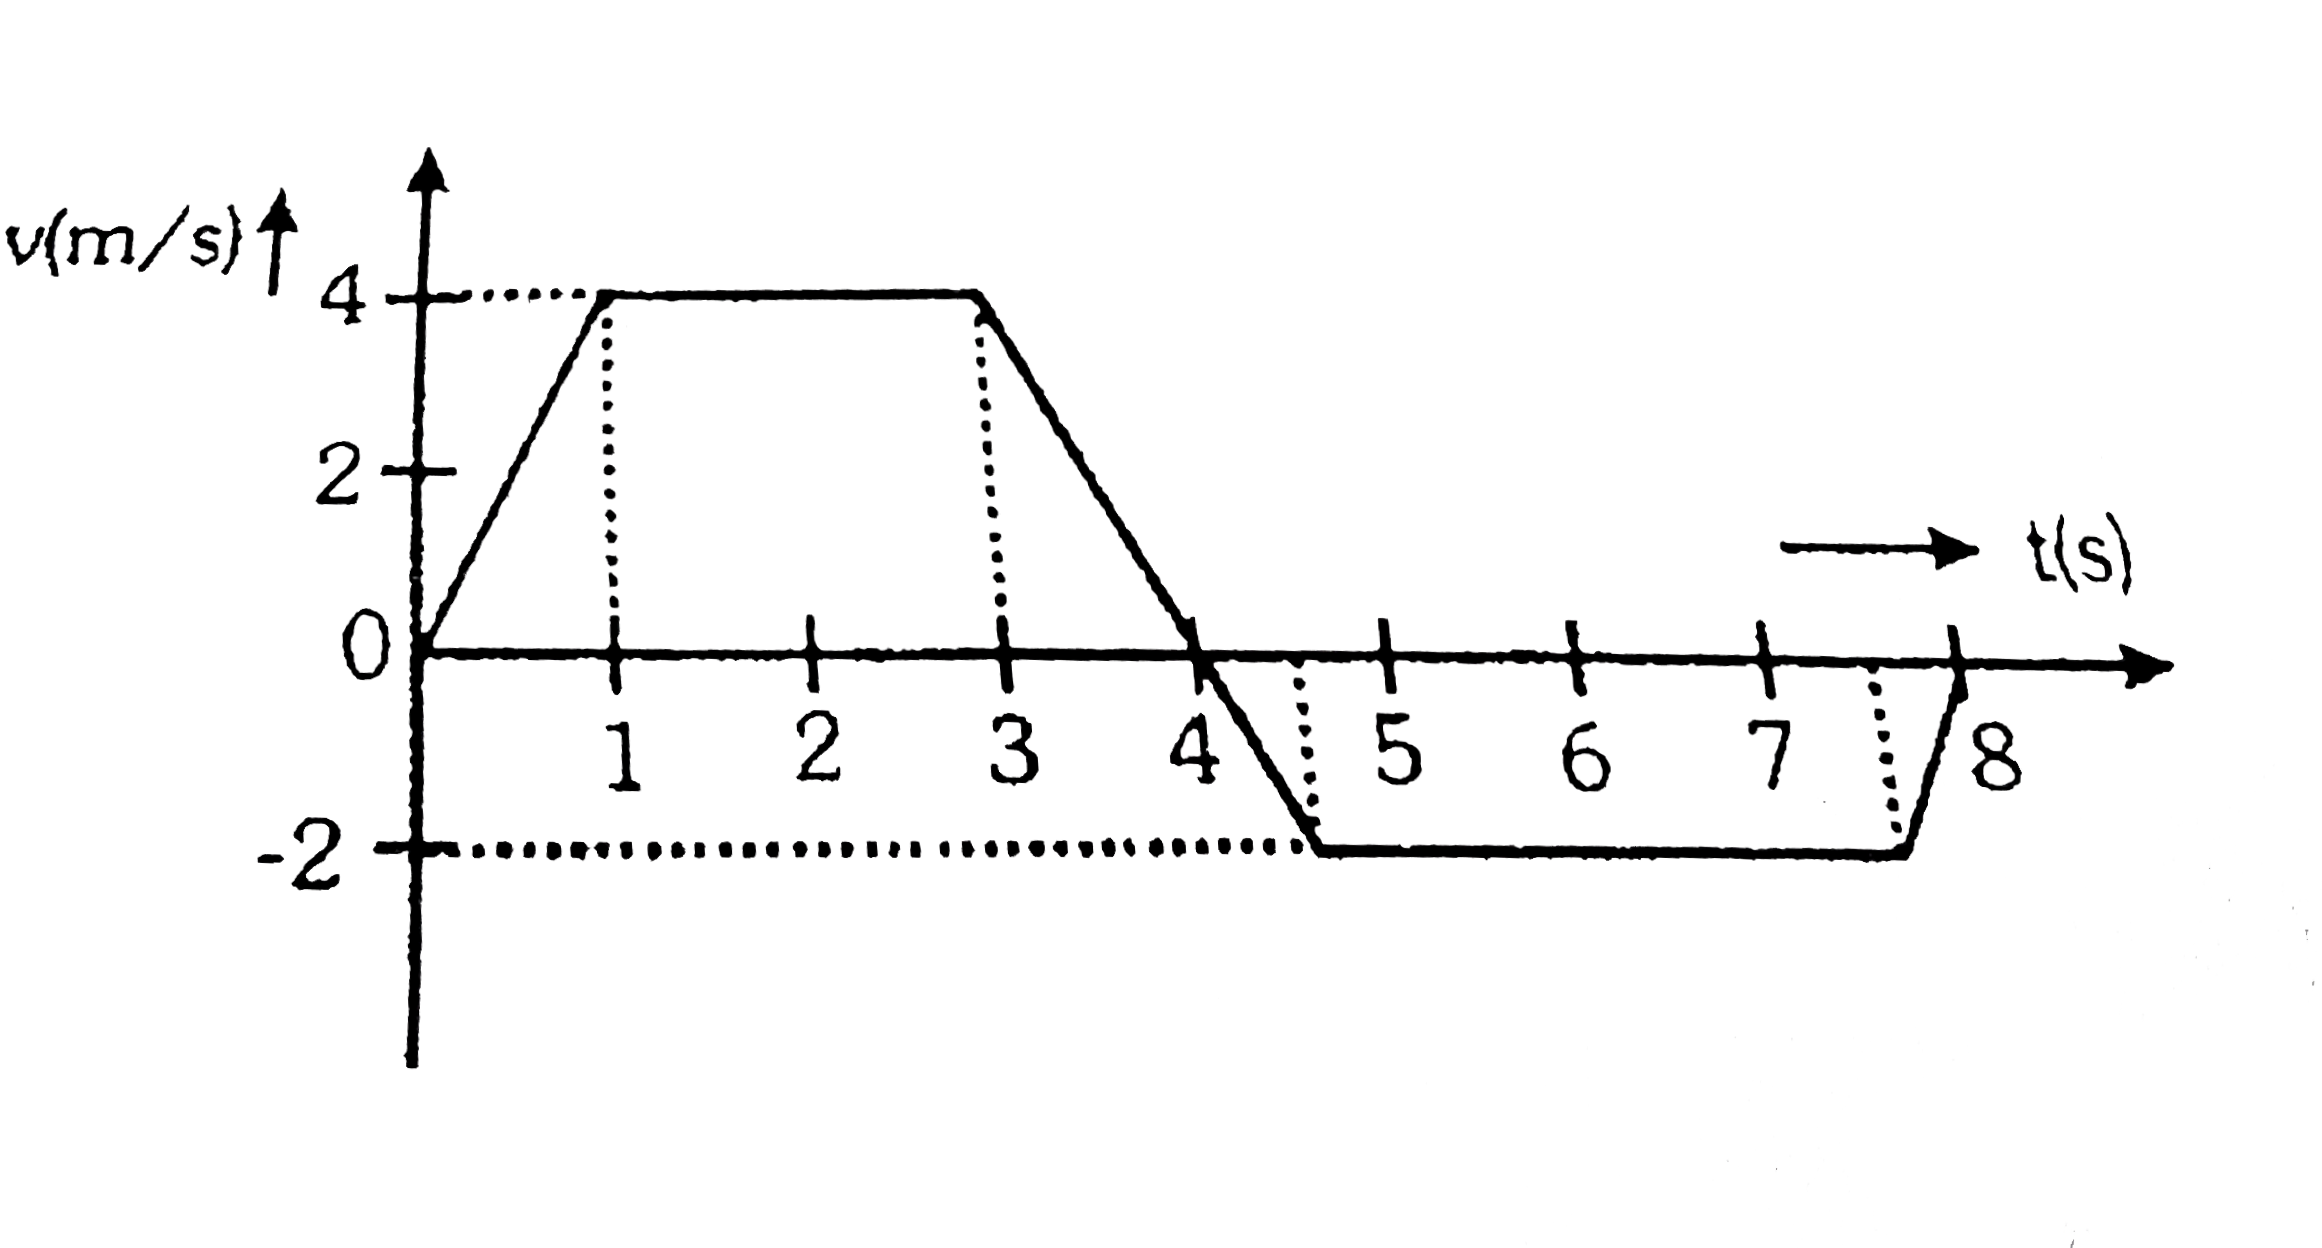
View SolutionThe displacement-time graph of a body is shown in.
 .
.
The velocity-time graph of the motion of the body will be .
View Solution

