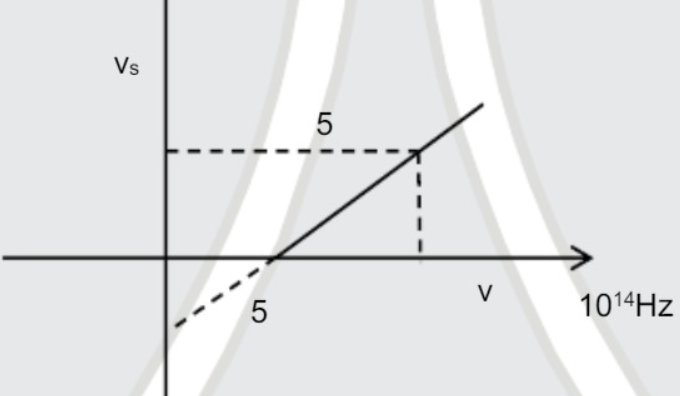
Graph between stopping potential and frequency of light as shown find the work function 
4.01 ev
2.07 ev
5.01 ev
2.09 ev
The correct Answer is:B
Step by step video, text & image solution for Graph between stopping potential and frequency of light as shown find the work function by Physics experts to help you in doubts & scoring excellent marks in Class 12 exams.
Updated on:21/07/2023Topper's Solved these Questions
Similar Questions
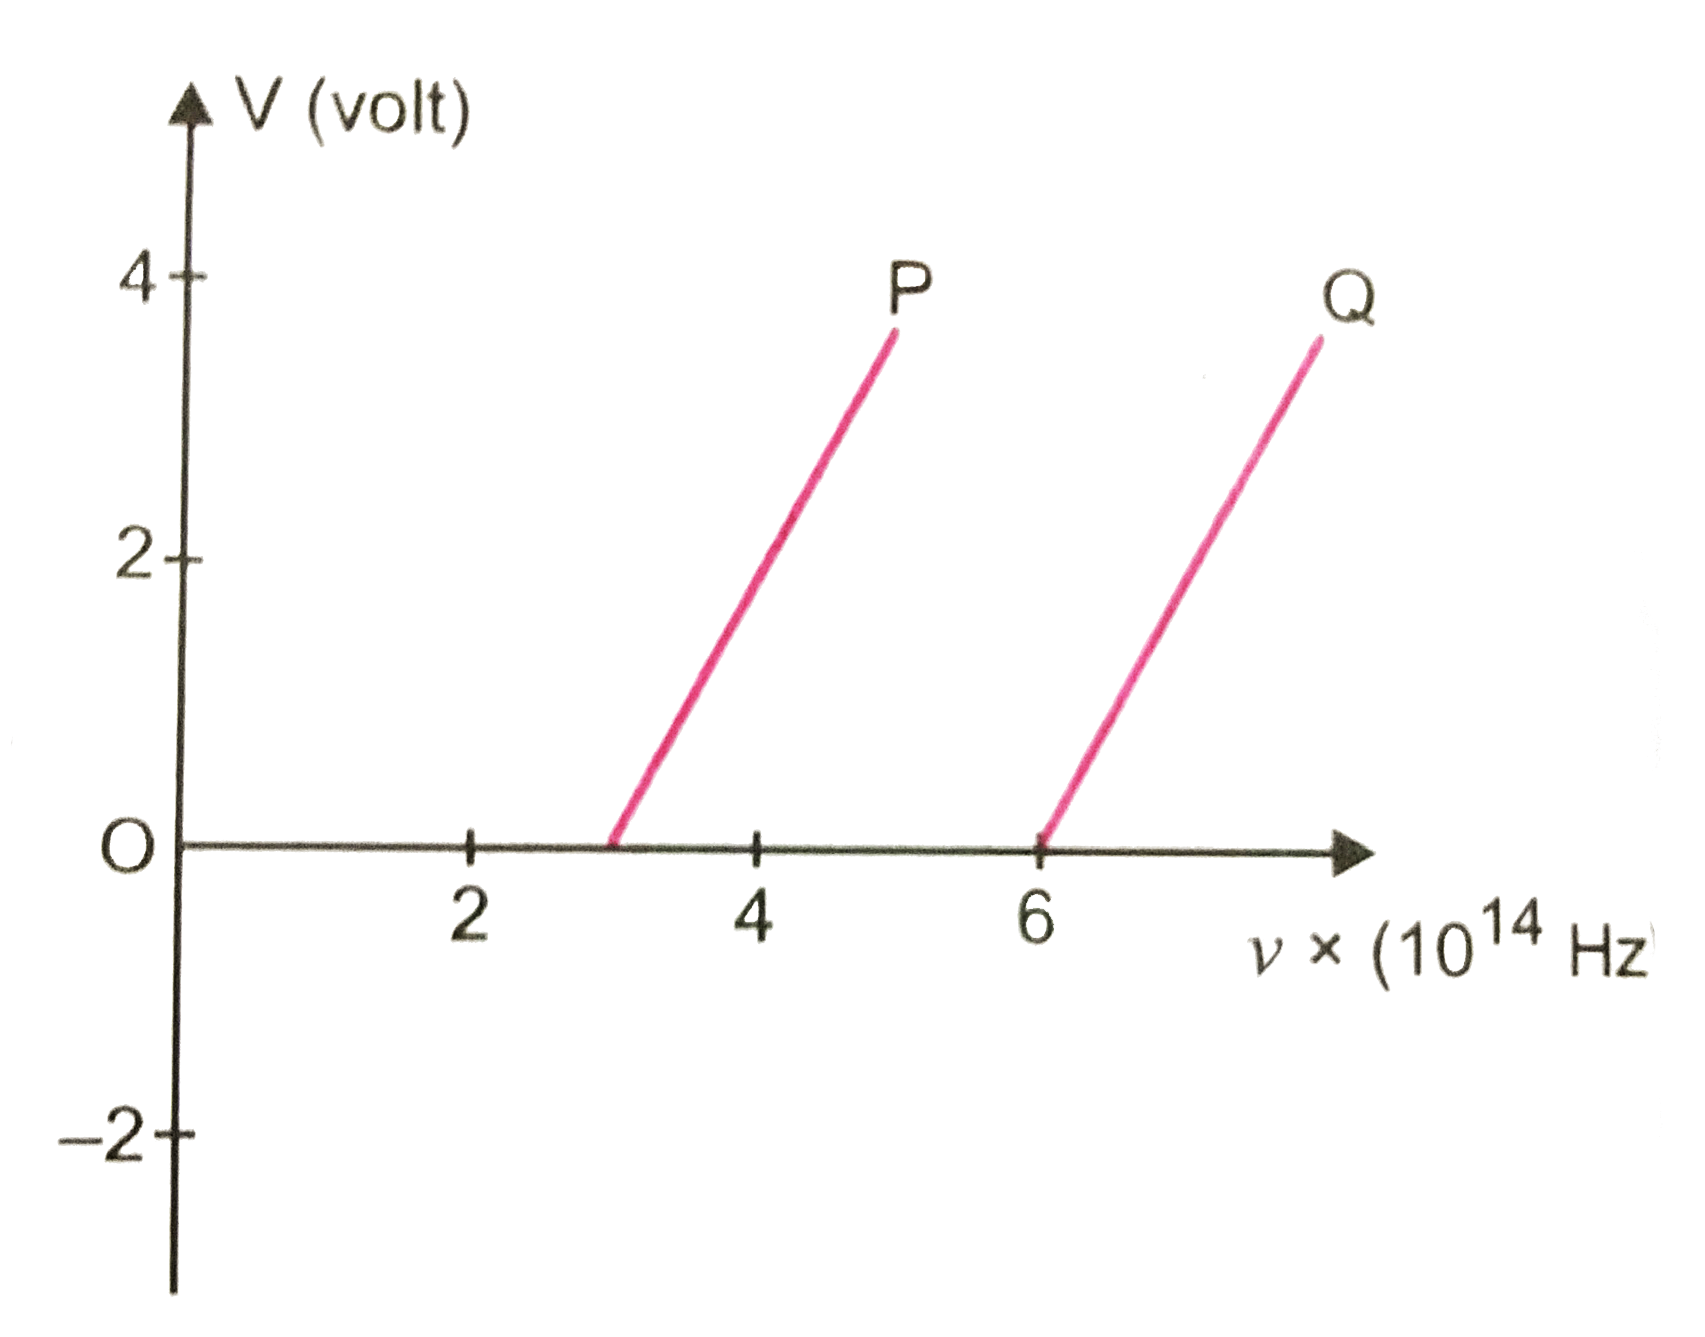
In the study of a photoelectric effect the graph between the stopping potential V and frequency v of the incident radiation on two different metals P and Q is shown in fig.
(i) which one of two metals have higher threshold frequency
(ii) Determine the work function of the metal which has greater value
(iii) Find the maximum kinetic energy of electron emitted by light of frequency 8×10¹⁴Hz for this metal.

View SolutionDraw a graph between stopping potential and the frequency of two metals A and B having threshold frequencies v0and2v0 .
View Solution
Knowledge Check
Graph between stopping potential and frequency of photon is given in figure
_2019_CBT7_E01_021_Q01.png)
Find out work function of metal:A0.82B0.92C0.72D0.62In photo electric effect, the slope of the straight line graph between stopping potential and frequency of the incident light gives the ratio of Planck's constant to
Acharge of electronBwork functionCphoto electric currentDK.E. of electronChoose the graph showing the correct relationship between the stopping potential V0 and the frequency v of light for potassium and tungsten.
A B
B C
C D
D
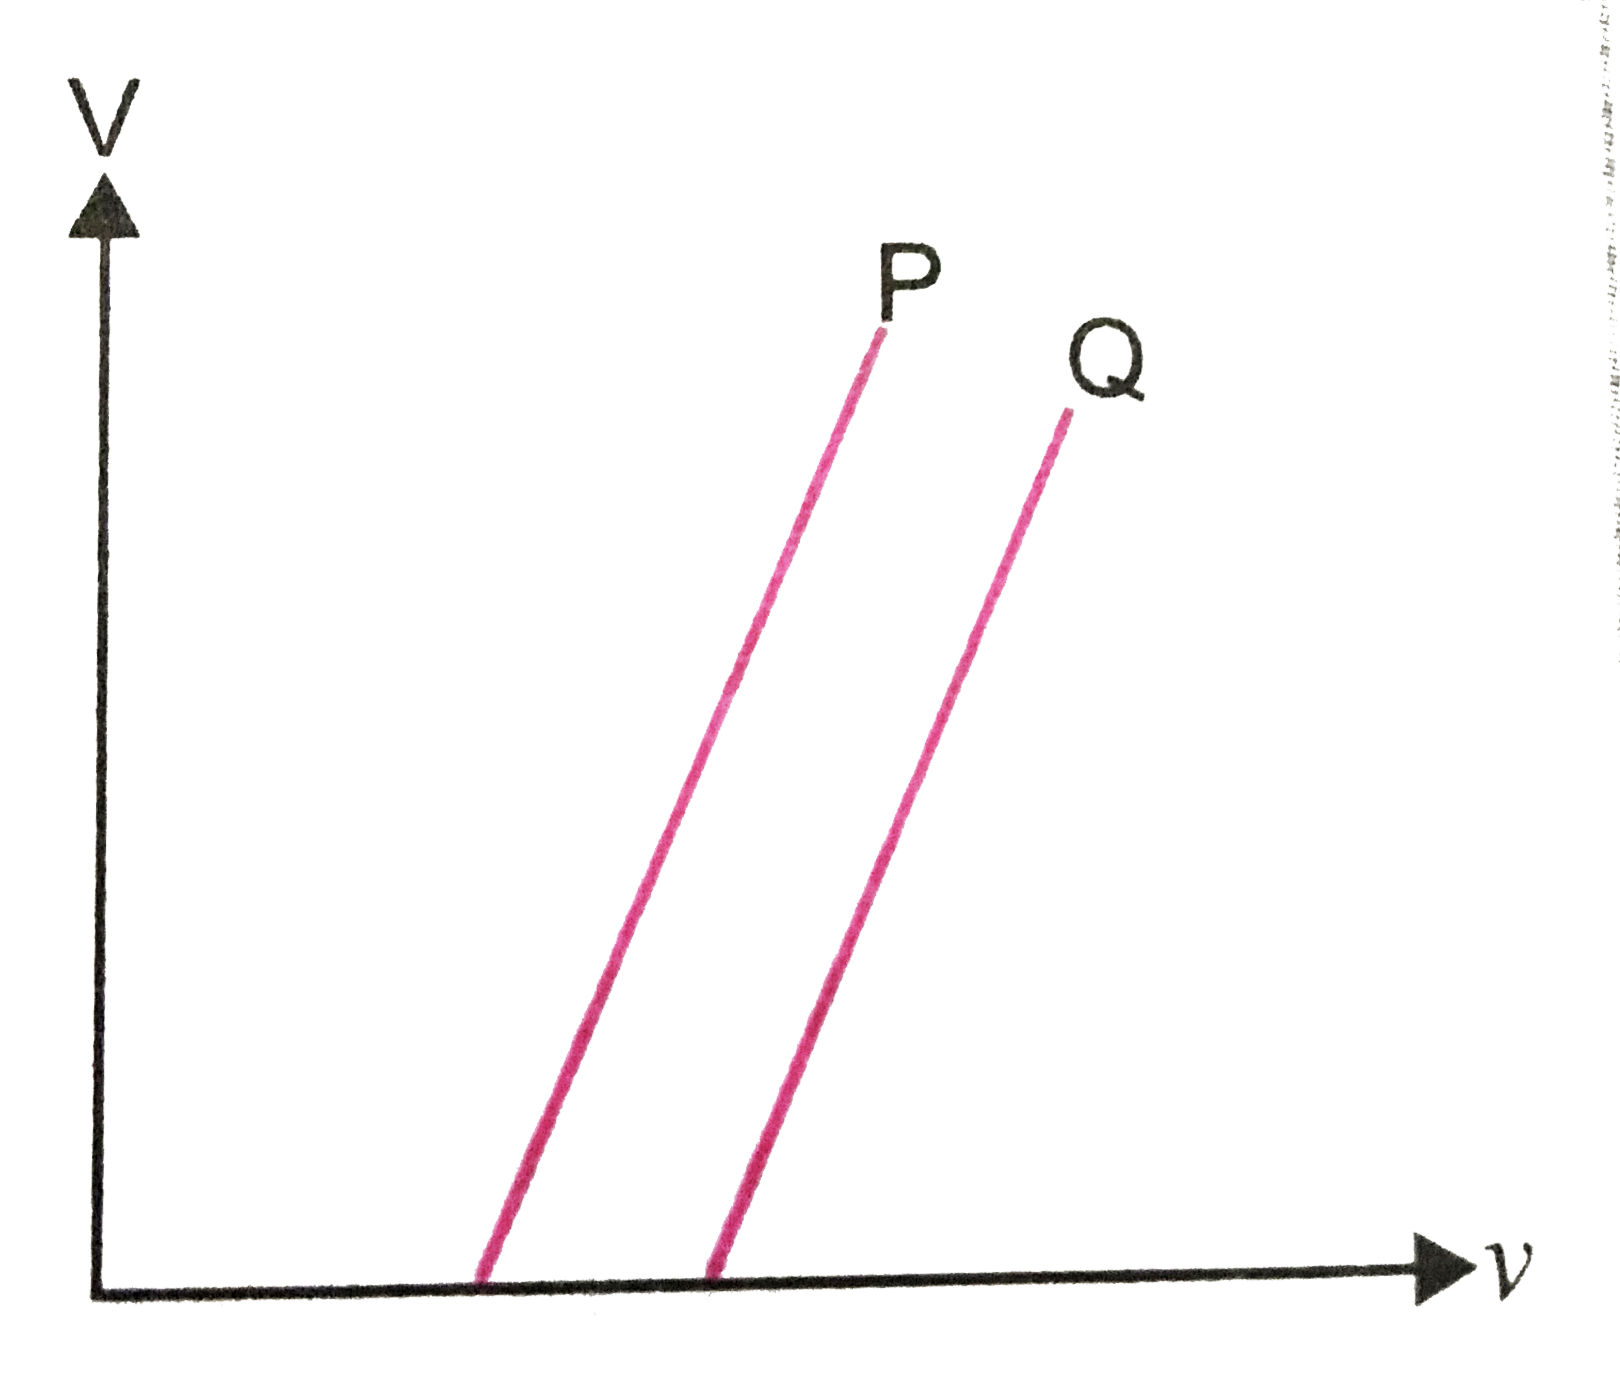
In a photoelectric effect experiment, the graph between the stopping potential (V) and frequency (v) of the incident radiations on two different metal plates P and Q are shown in plates, P and Q has greater value of work function ? (ii) What does the slope of the lines depict?

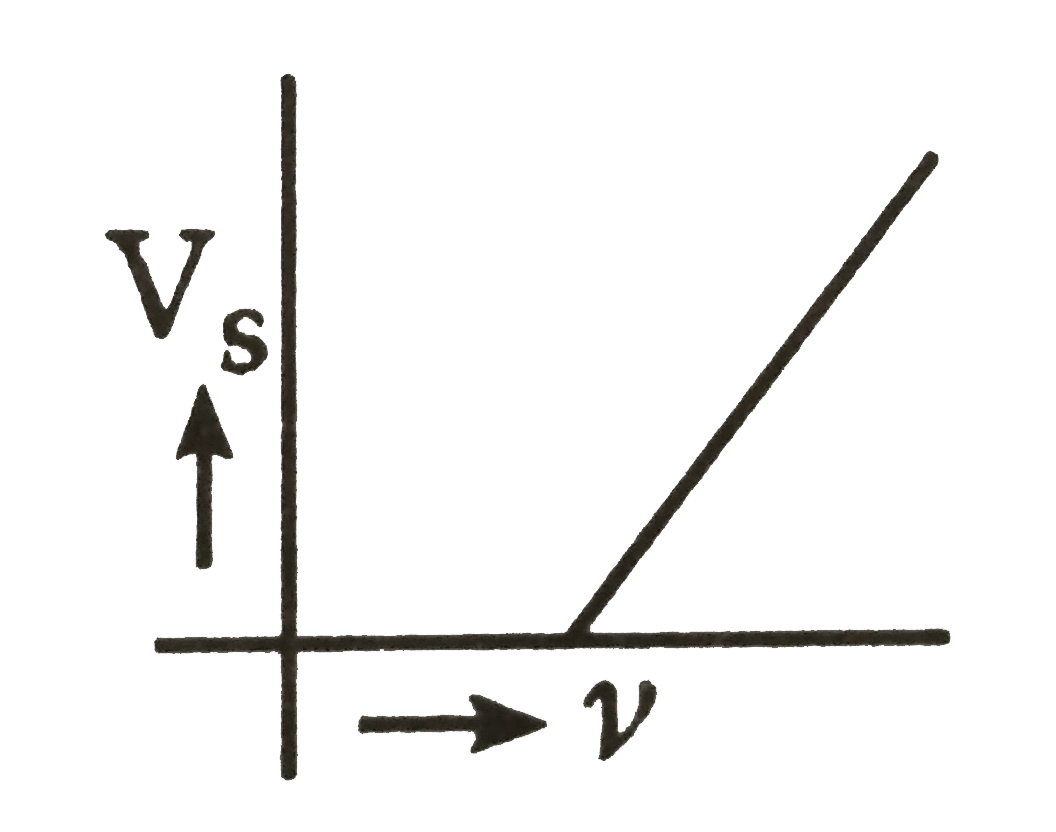
View SolutionIn photoelectric effect the slope of straight line graph between stopping potential (Vs) and frequency of incident light (v) gives

View SolutionThe graph between stopping potential and intensity of light in photoelectric effect is
View SolutionThe figure showing the correct relationship between the stopping potential V and the frequency v of the light for potassium and tungsten is
View SolutionThe figure shows different graphs between stopping potential (V0) and frequency (v) for photosensitive surface of cesium , potassium , sodium and lithium. The plots are parallel. Correct ranking of the targets according to their work function greatest first will be

View Solution
