The graph between stopping potential and intensity of light in photoelectric effect is


The correct Answer is:C
Step by step video, text & image solution for The graph between stopping potential and intensity of light in photoelectric effect is by Physics experts to help you in doubts & scoring excellent marks in Class 11 exams.
Topper's Solved these Questions
- BOOK - TARGET PUBLICATIONCHAPTER - ELECTRONS AND PHOTONSEXERCISE - Critical thinking22videos
ELECTRONS AND PHOTONS
- BOOK - TARGET PUBLICATIONCHAPTER - ELECTRONS AND PHOTONSEXERCISE - Competitive Thinking78videos
ELECTRONS AND PHOTONS
- BOOK - TARGET PUBLICATIONCHAPTER - COMMUNICATION SYSTEMSEXERCISE - Evaluation Test15videos
COMMUNICATION SYSTEMS
- BOOK - TARGET PUBLICATIONCHAPTER - FORCE EXERCISE - Evaluation Test16videos
FORCE
Similar Questions
Knowledge Check
- Question 1 - Select One
The correct curve between the stopping potential (V) and intensity of incident light (I) is
A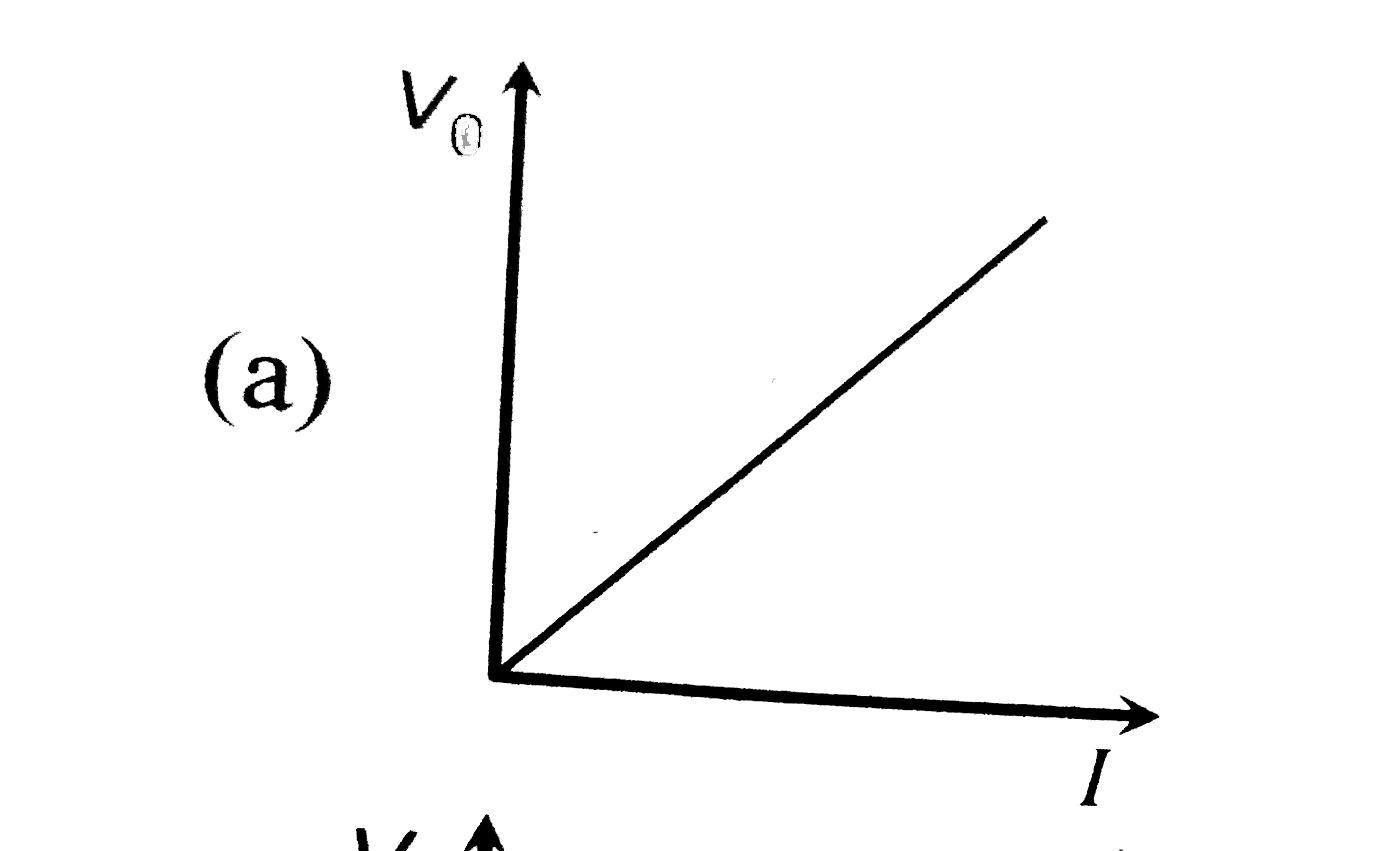 B
B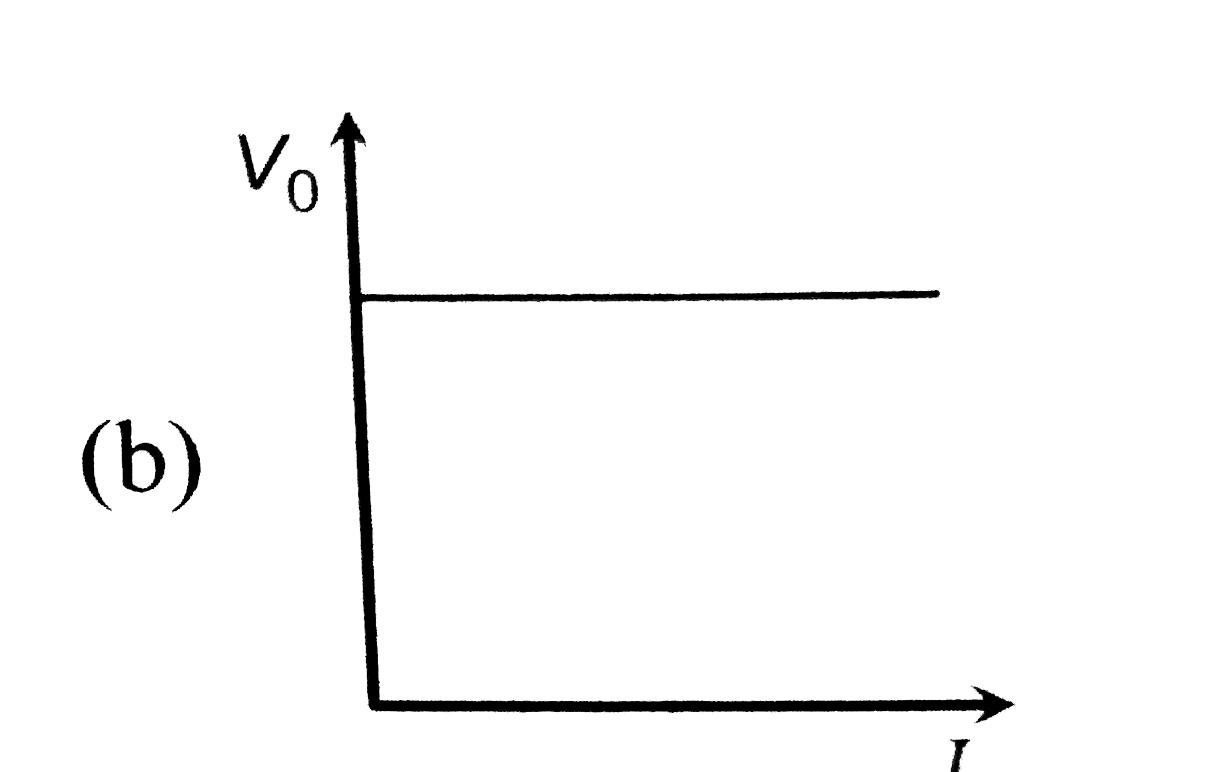 C
C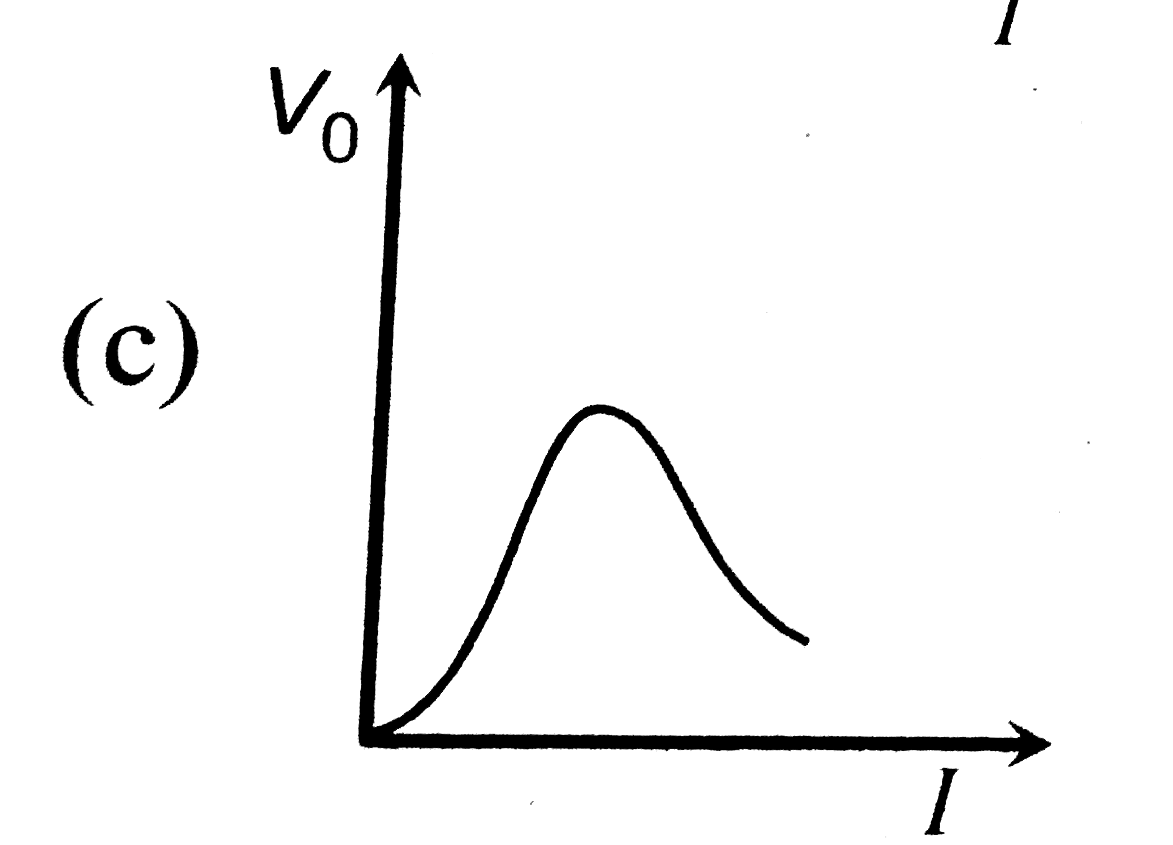 D
D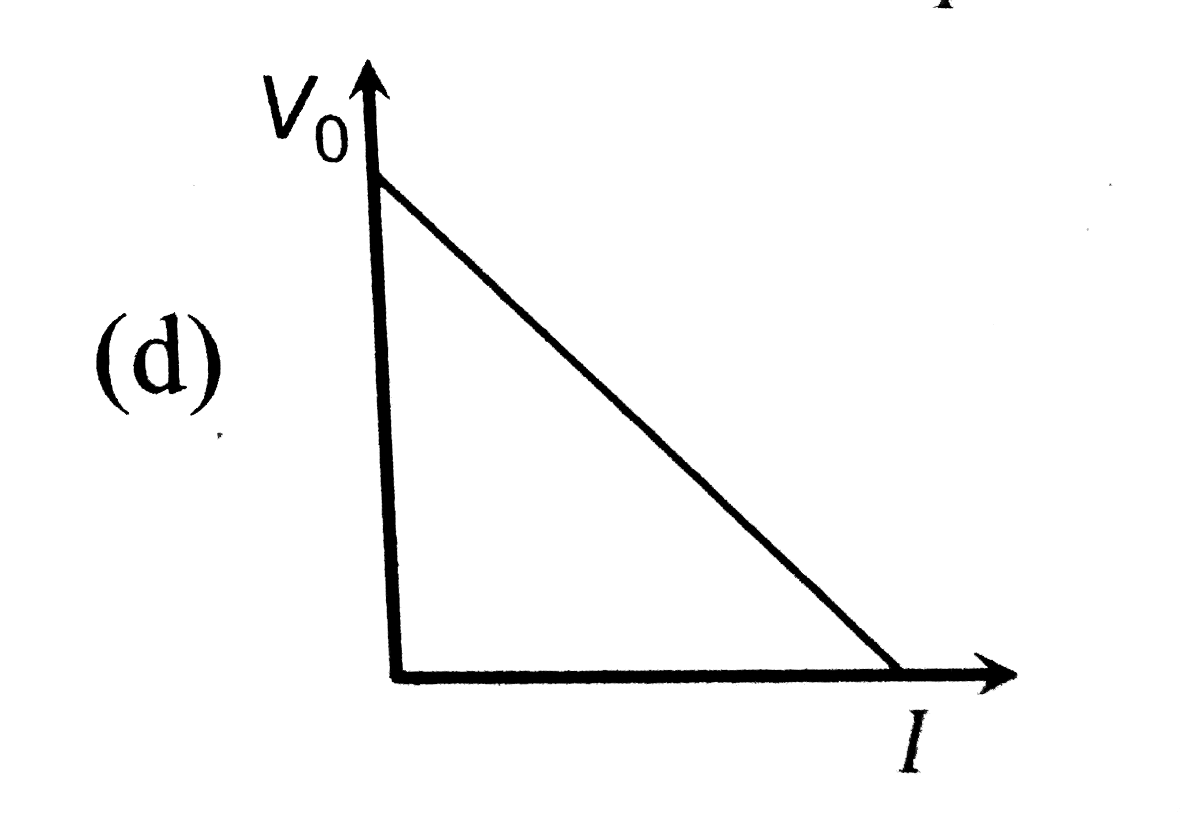
- Question 2 - Select One
Graph between stopping potential and frequency of light as shown find the work function
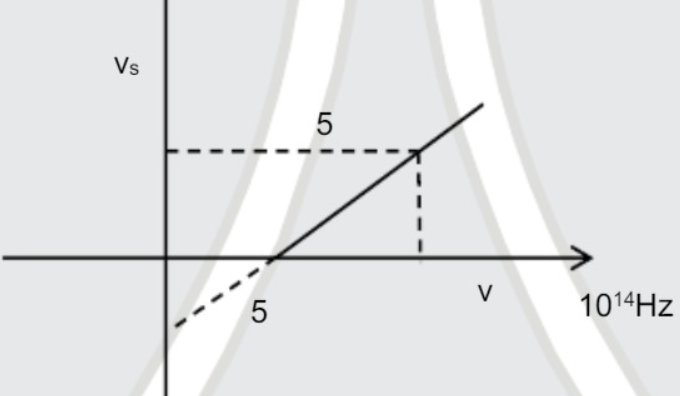 A4.01 evB2.07 evC5.01 evD2.09 ev
 - Question 3 - Select One
Graph of incident freuency with stopping potential in photoelectric effect is
A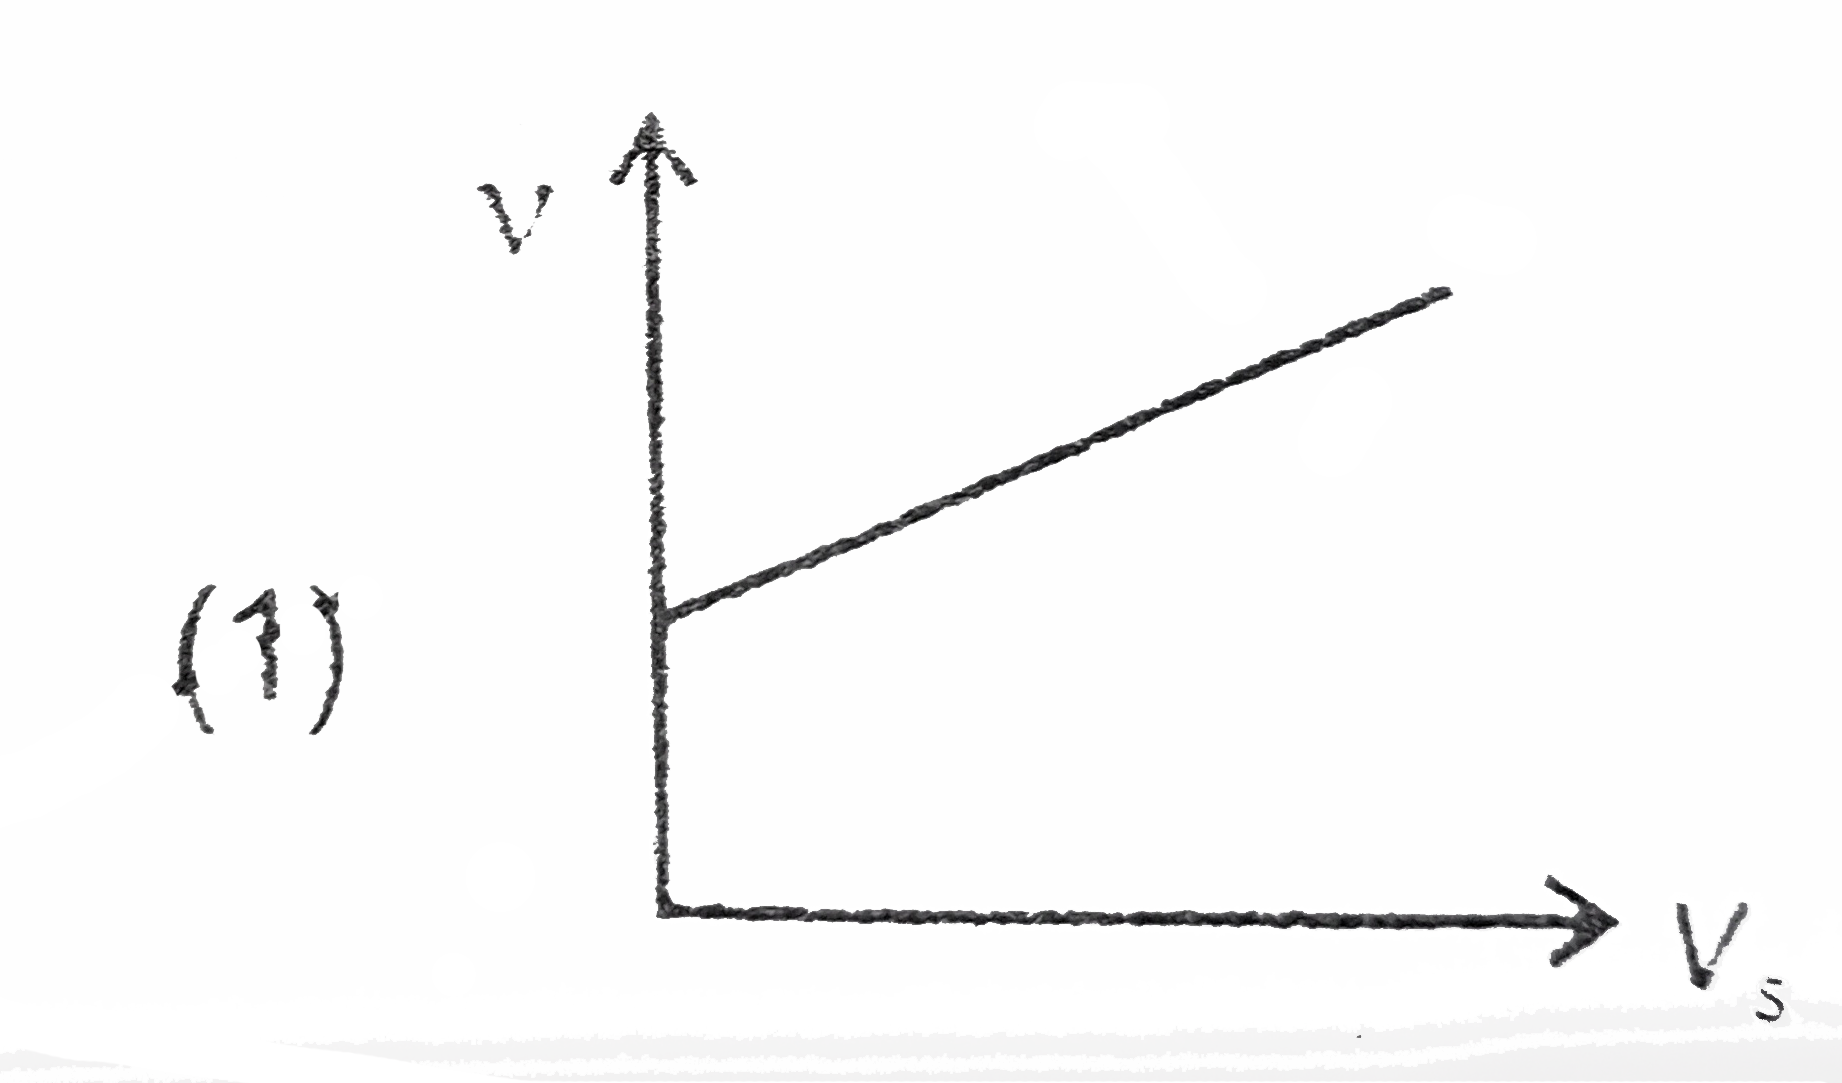 B
B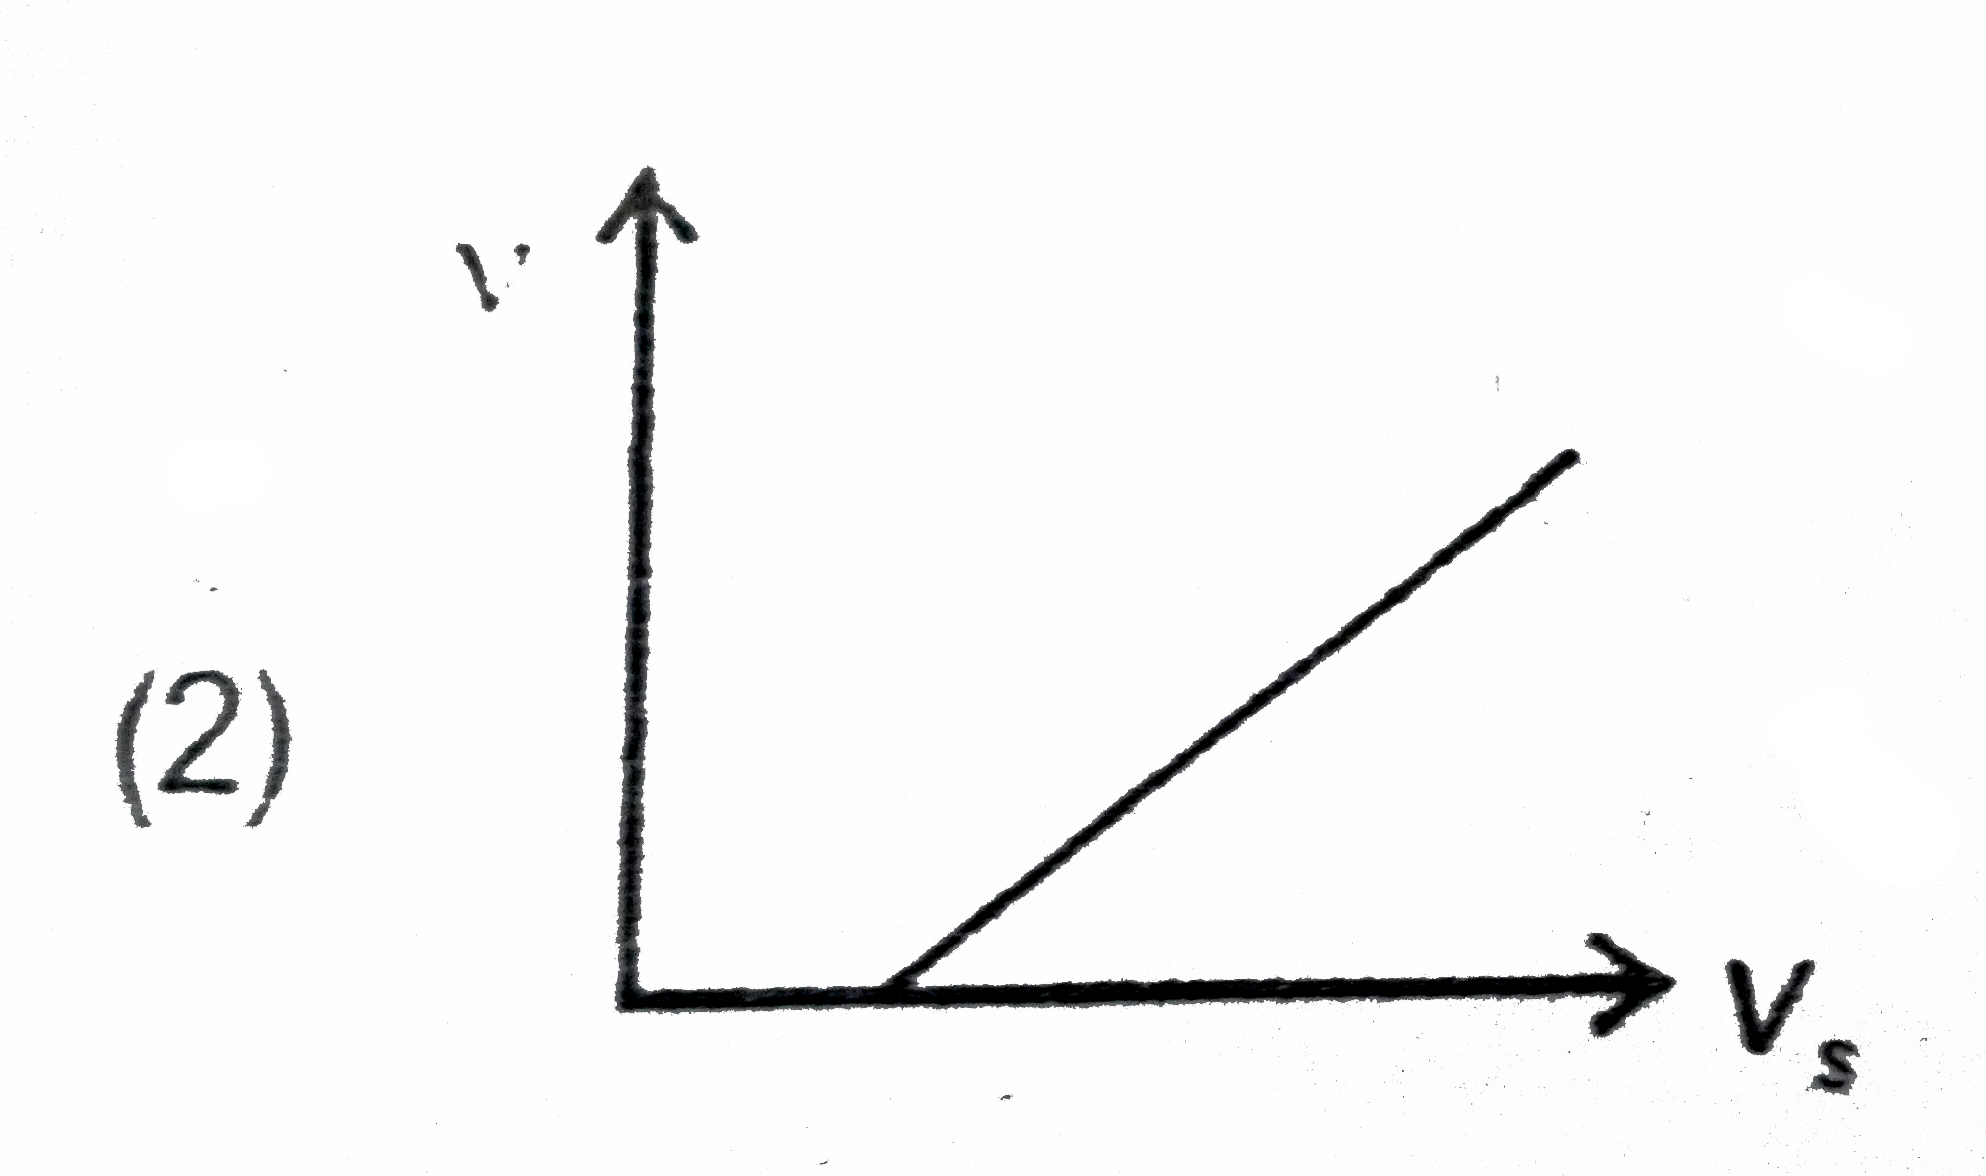 C
C D
D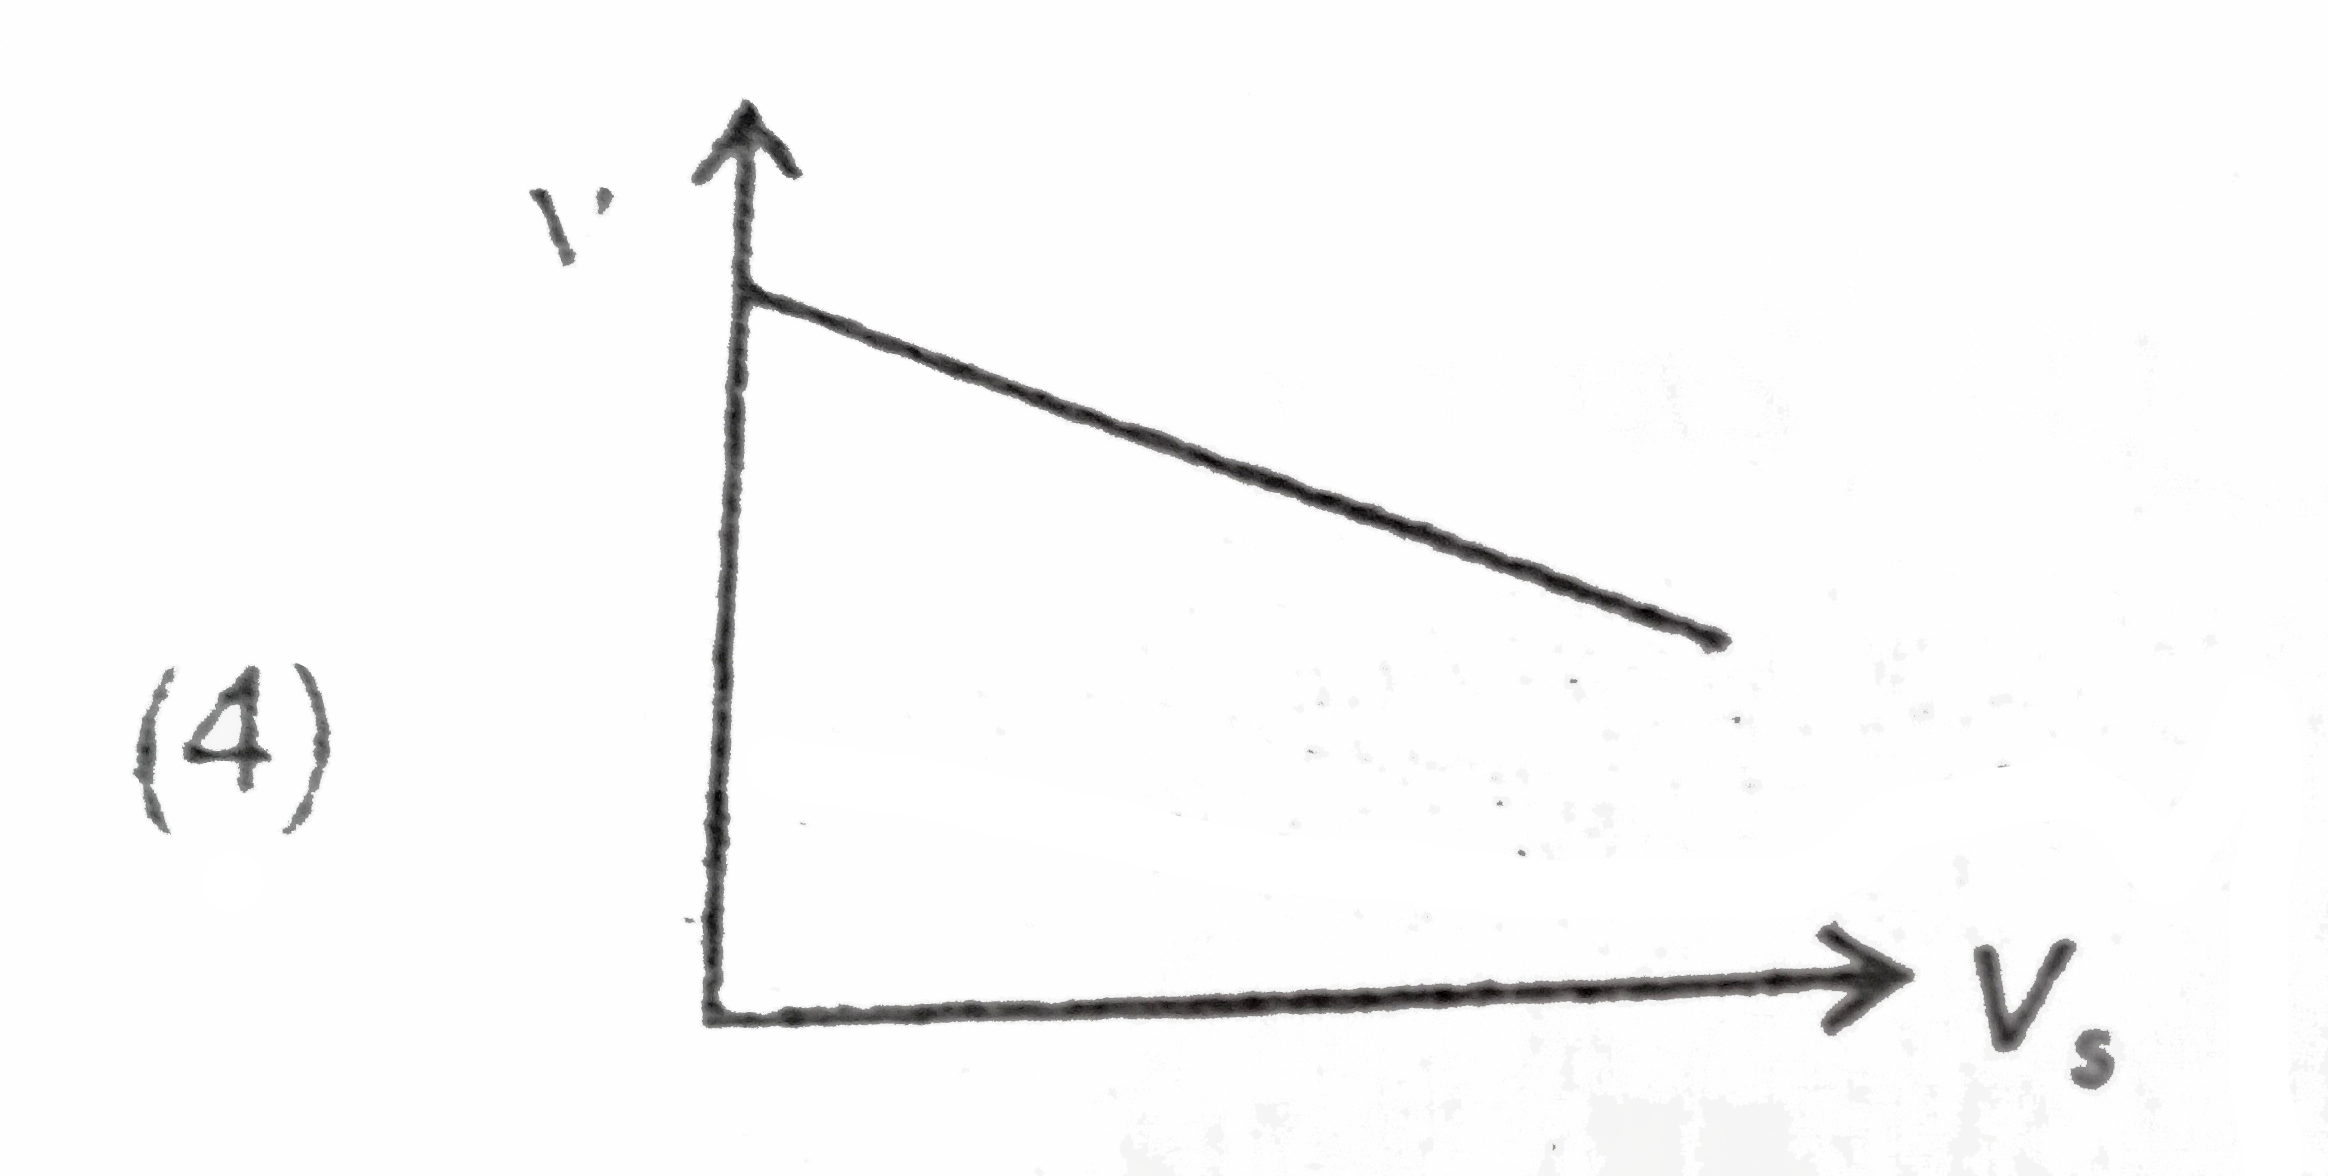
The slope of the stopping potential versus frequency graph for photoelectric effect is equal to:
View SolutionThe stopping potential in an experiment on photoelectric effect is 2V. What is the maximum kinetic energy of the photoelectrons emitted ?
View SolutionIn photo electric effect, the slope of the straight line graph between stopping potential and frequency of the incident light gives the ratio of Planck's constant to
View SolutionIn photoelectric effect the slope of stop of stopping potential versus frequency of incident light for a given surface will be
View SolutionThe magnitude of stopping potential for the photoelectric effect is
View Solution

