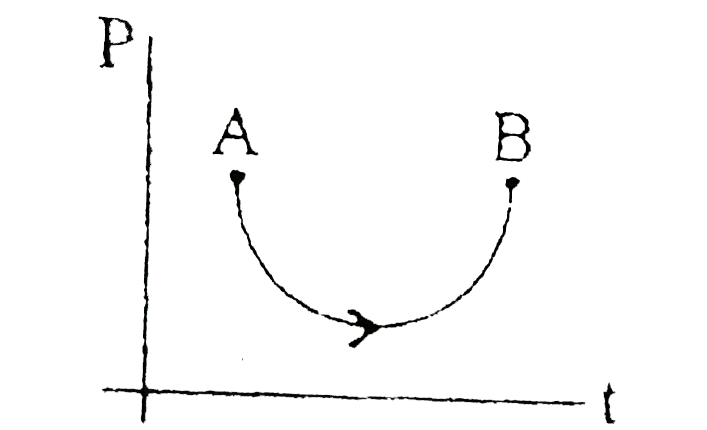
The net power P of all the forces acting on a particle versus time curve is shown. Work done the particlce from A to B
Increases
Decreases
First increases then decreases
First decreases then increases
The correct Answer is:A
Area under graph increases, hence work done upon the particle from A to B increase.
Topper's Solved these Questions
- TEST PAPERSBOOK - BANSALCHAPTER - TEST PAPERSEXERCISE - PHYSICS PART (A)
32 Videos
- TEST PAPERSBOOK - BANSALCHAPTER - TEST PAPERSEXERCISE - PHYSICS PART (B)
3 Videos
- TEST PAPERSBOOK - BANSALCHAPTER - TEST PAPERSEXERCISE - PHYSICS PART- C
4 Videos
- SEMICONDUCTORSBOOK - BANSALCHAPTER - SEMICONDUCTORSEXERCISE - CBSE Question
32 Videos
Similar Questions
Knowledge Check
A position dependent force F ia acting on a particle and its force-position curve is shown in the figure. Work done on the particle, when its displacement is from 0 to 5 m is
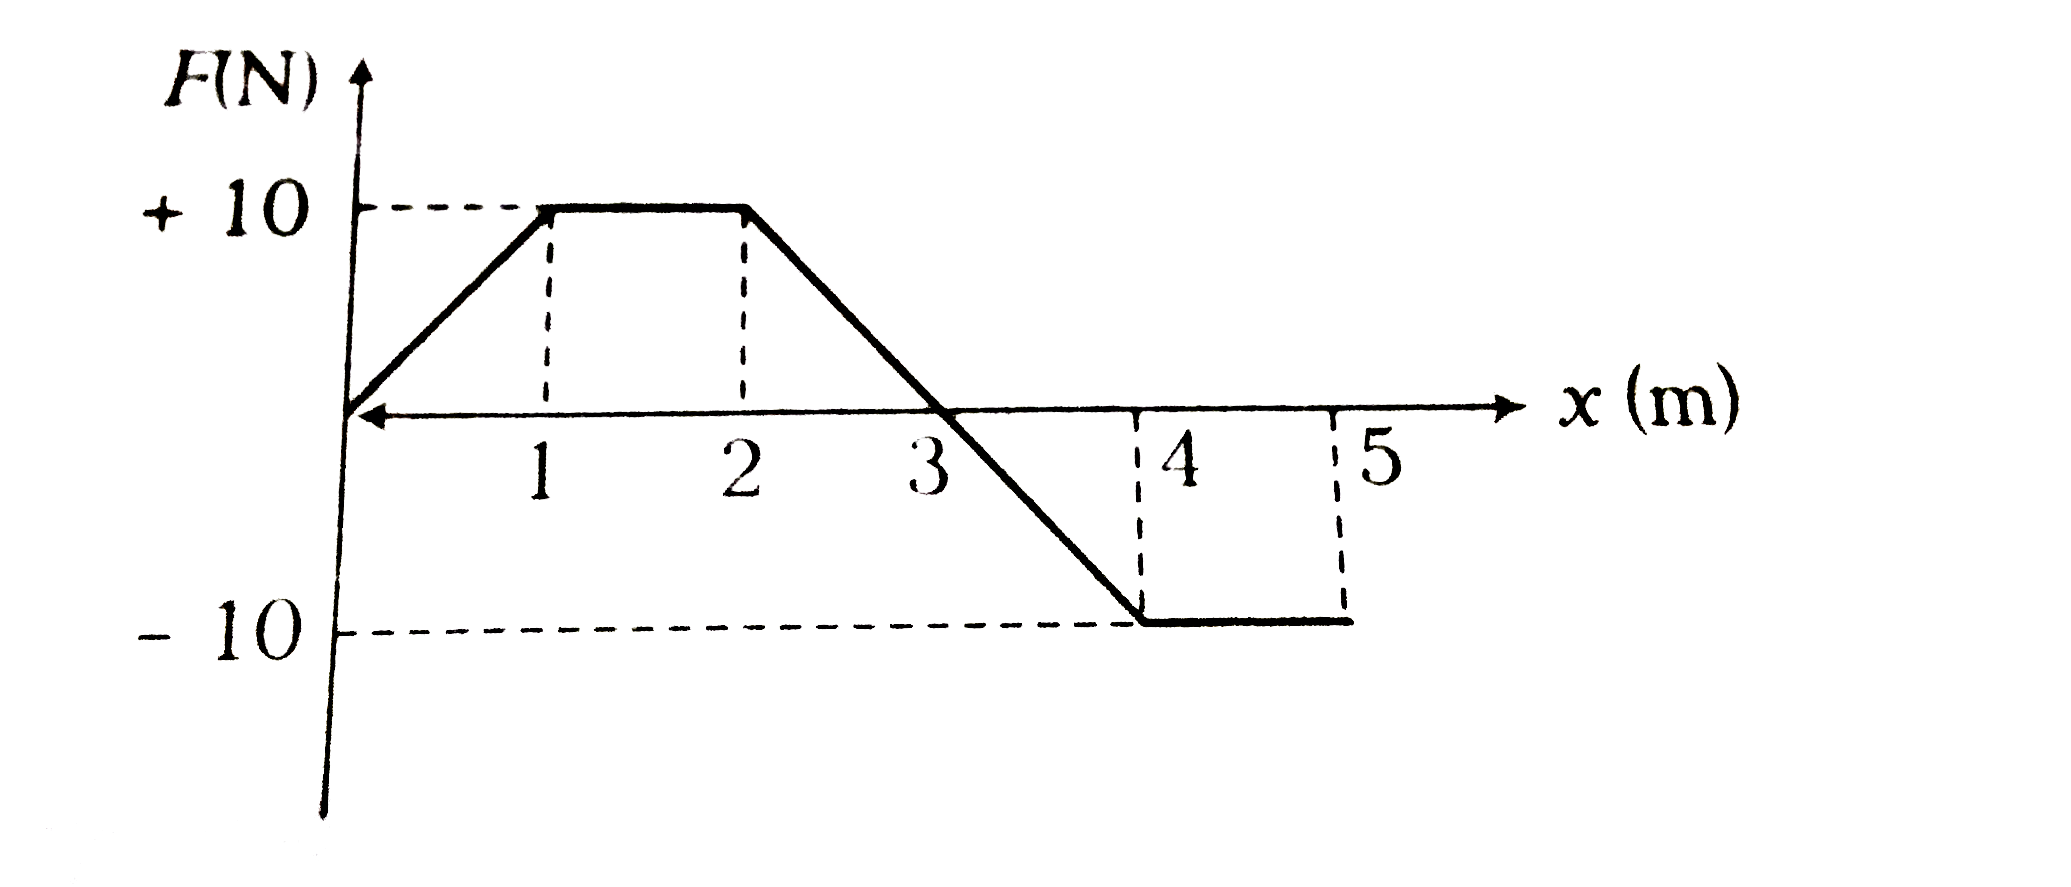 A35 JB25 JC15 JD5 J
Area under power-time curve gives total work done
Aby the body onlyBon the body onlyCBoth (a) and (b)Dneither (a) nor (b)A particle is moving along a circle of fixed radius such thta the power 'P' delivered by all the forces acting on it varies with time t as shown in figure. The angular acceleration αof the particle varies as:
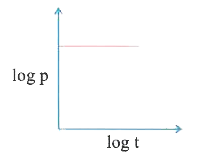 At12Bt−12CtDt32
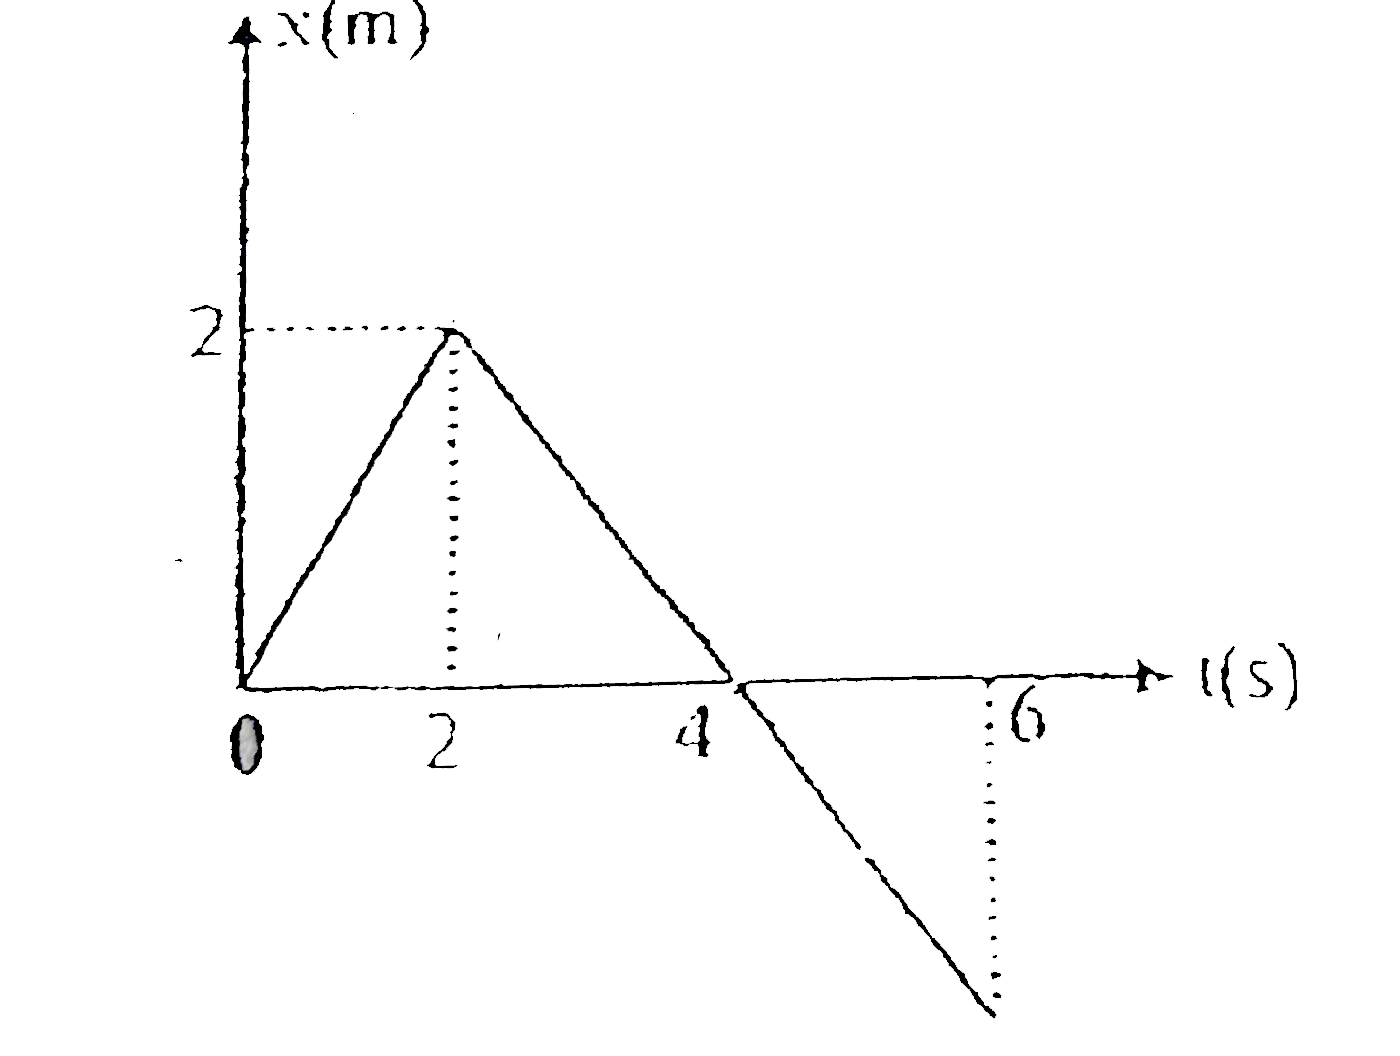
Position time graph of a particle of mass 2 kg is shown in figrure. Total work done on the particle from t=0 to t=4s is
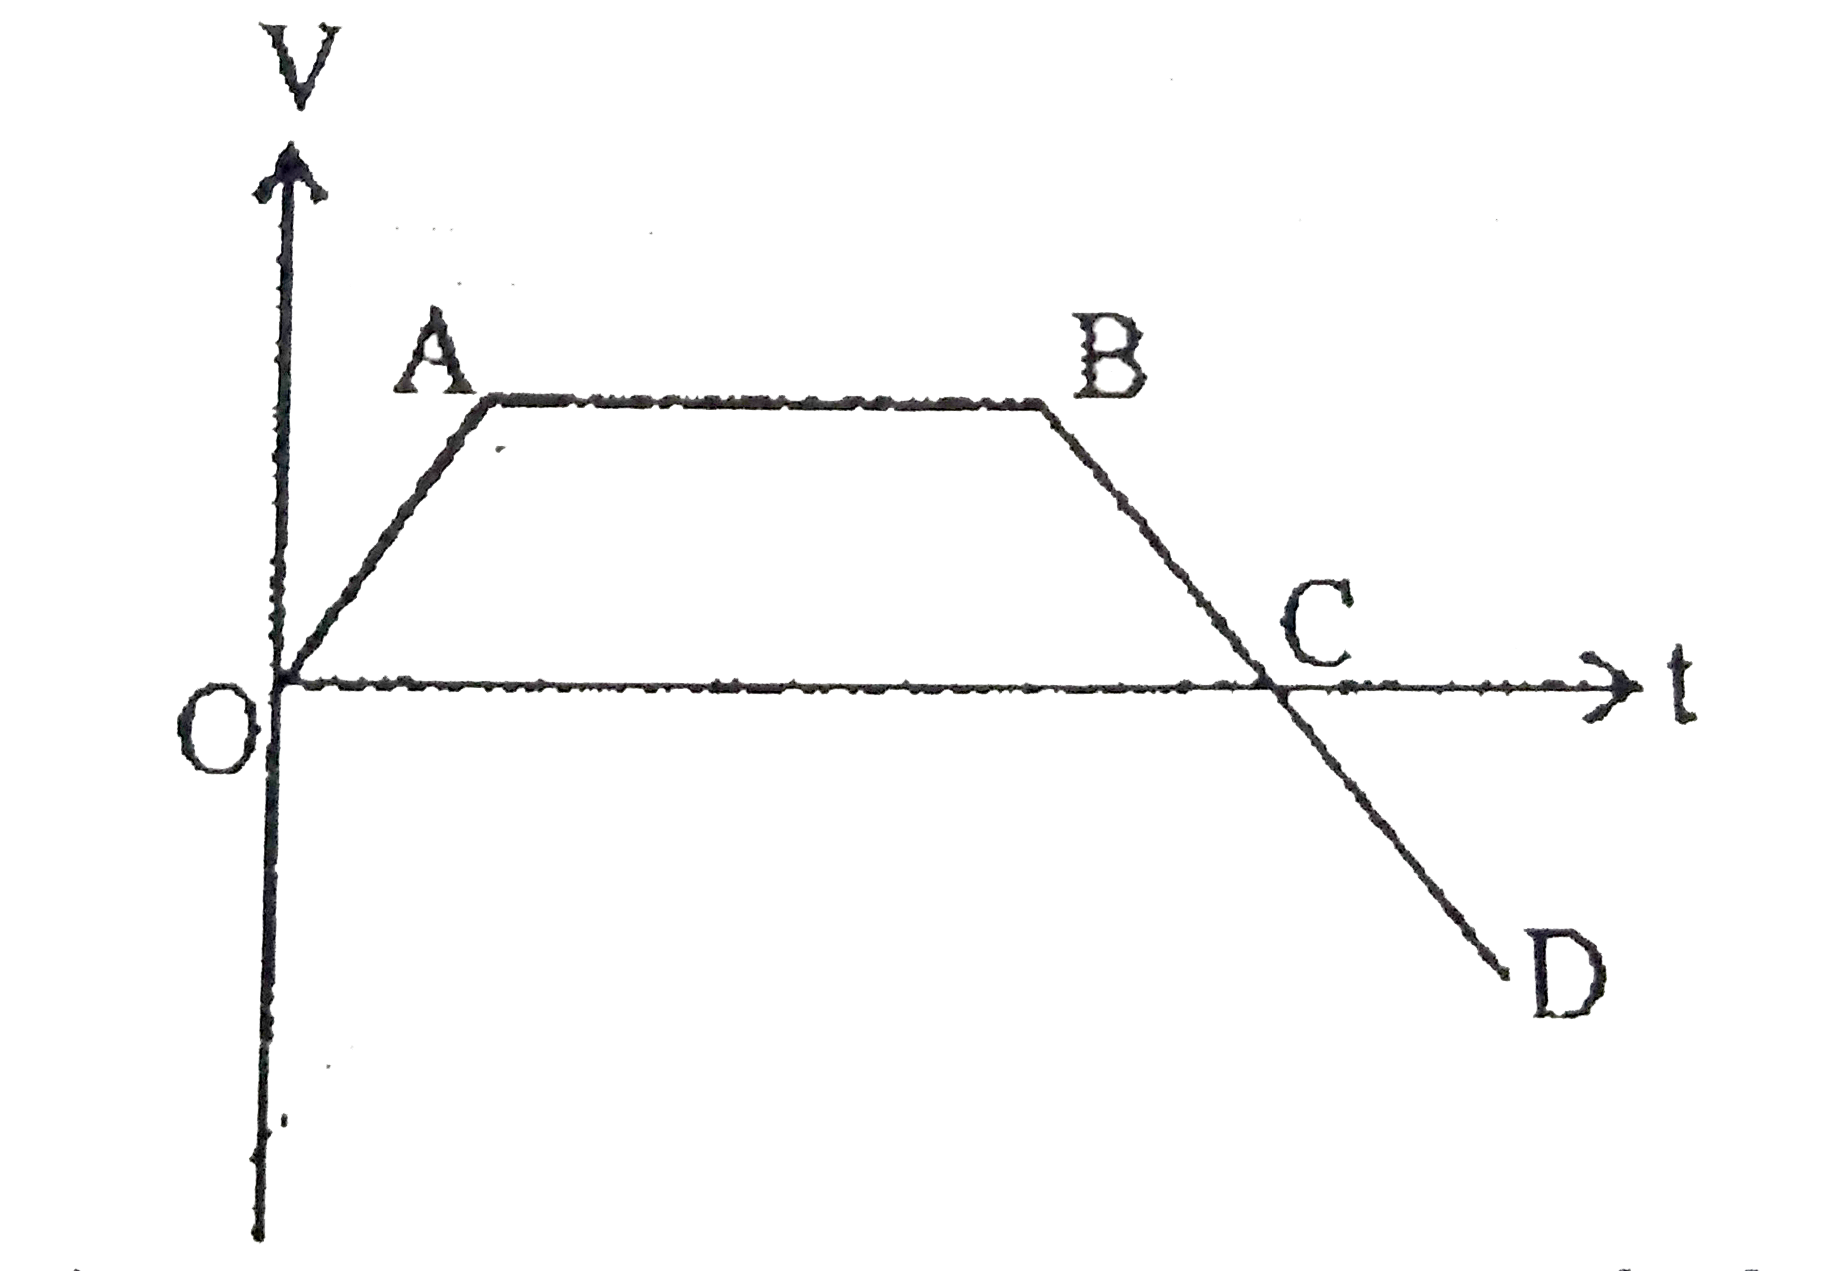
View SolutionSingle force is acting on a body and velocity versus time graph is as shown. The correct statement is
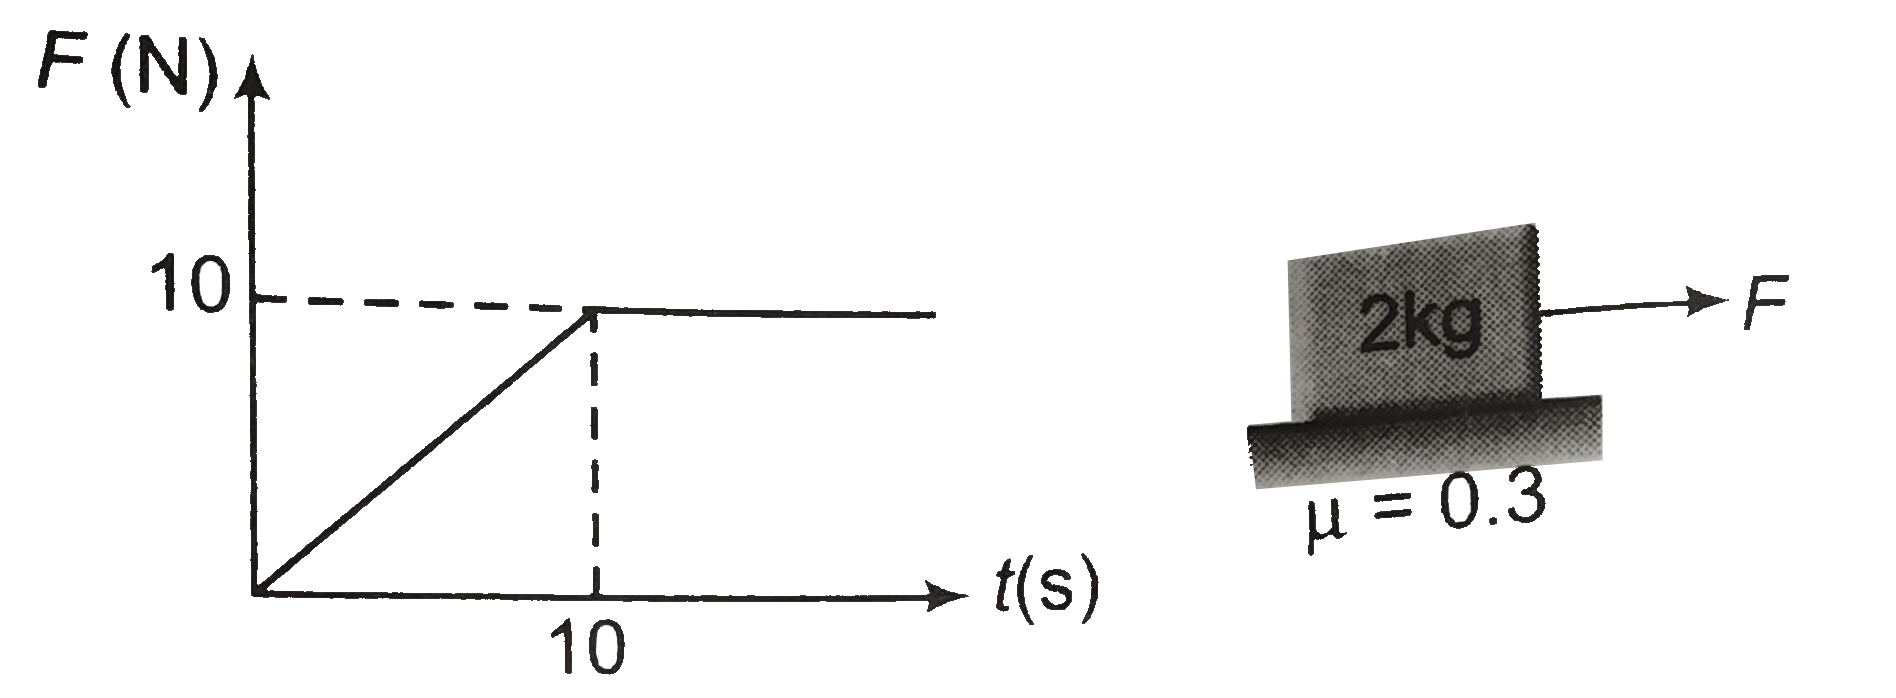
View SolutionForce acting on a block versus time graph is as shown in figure Choose the correct options.(g=10m/s−2)
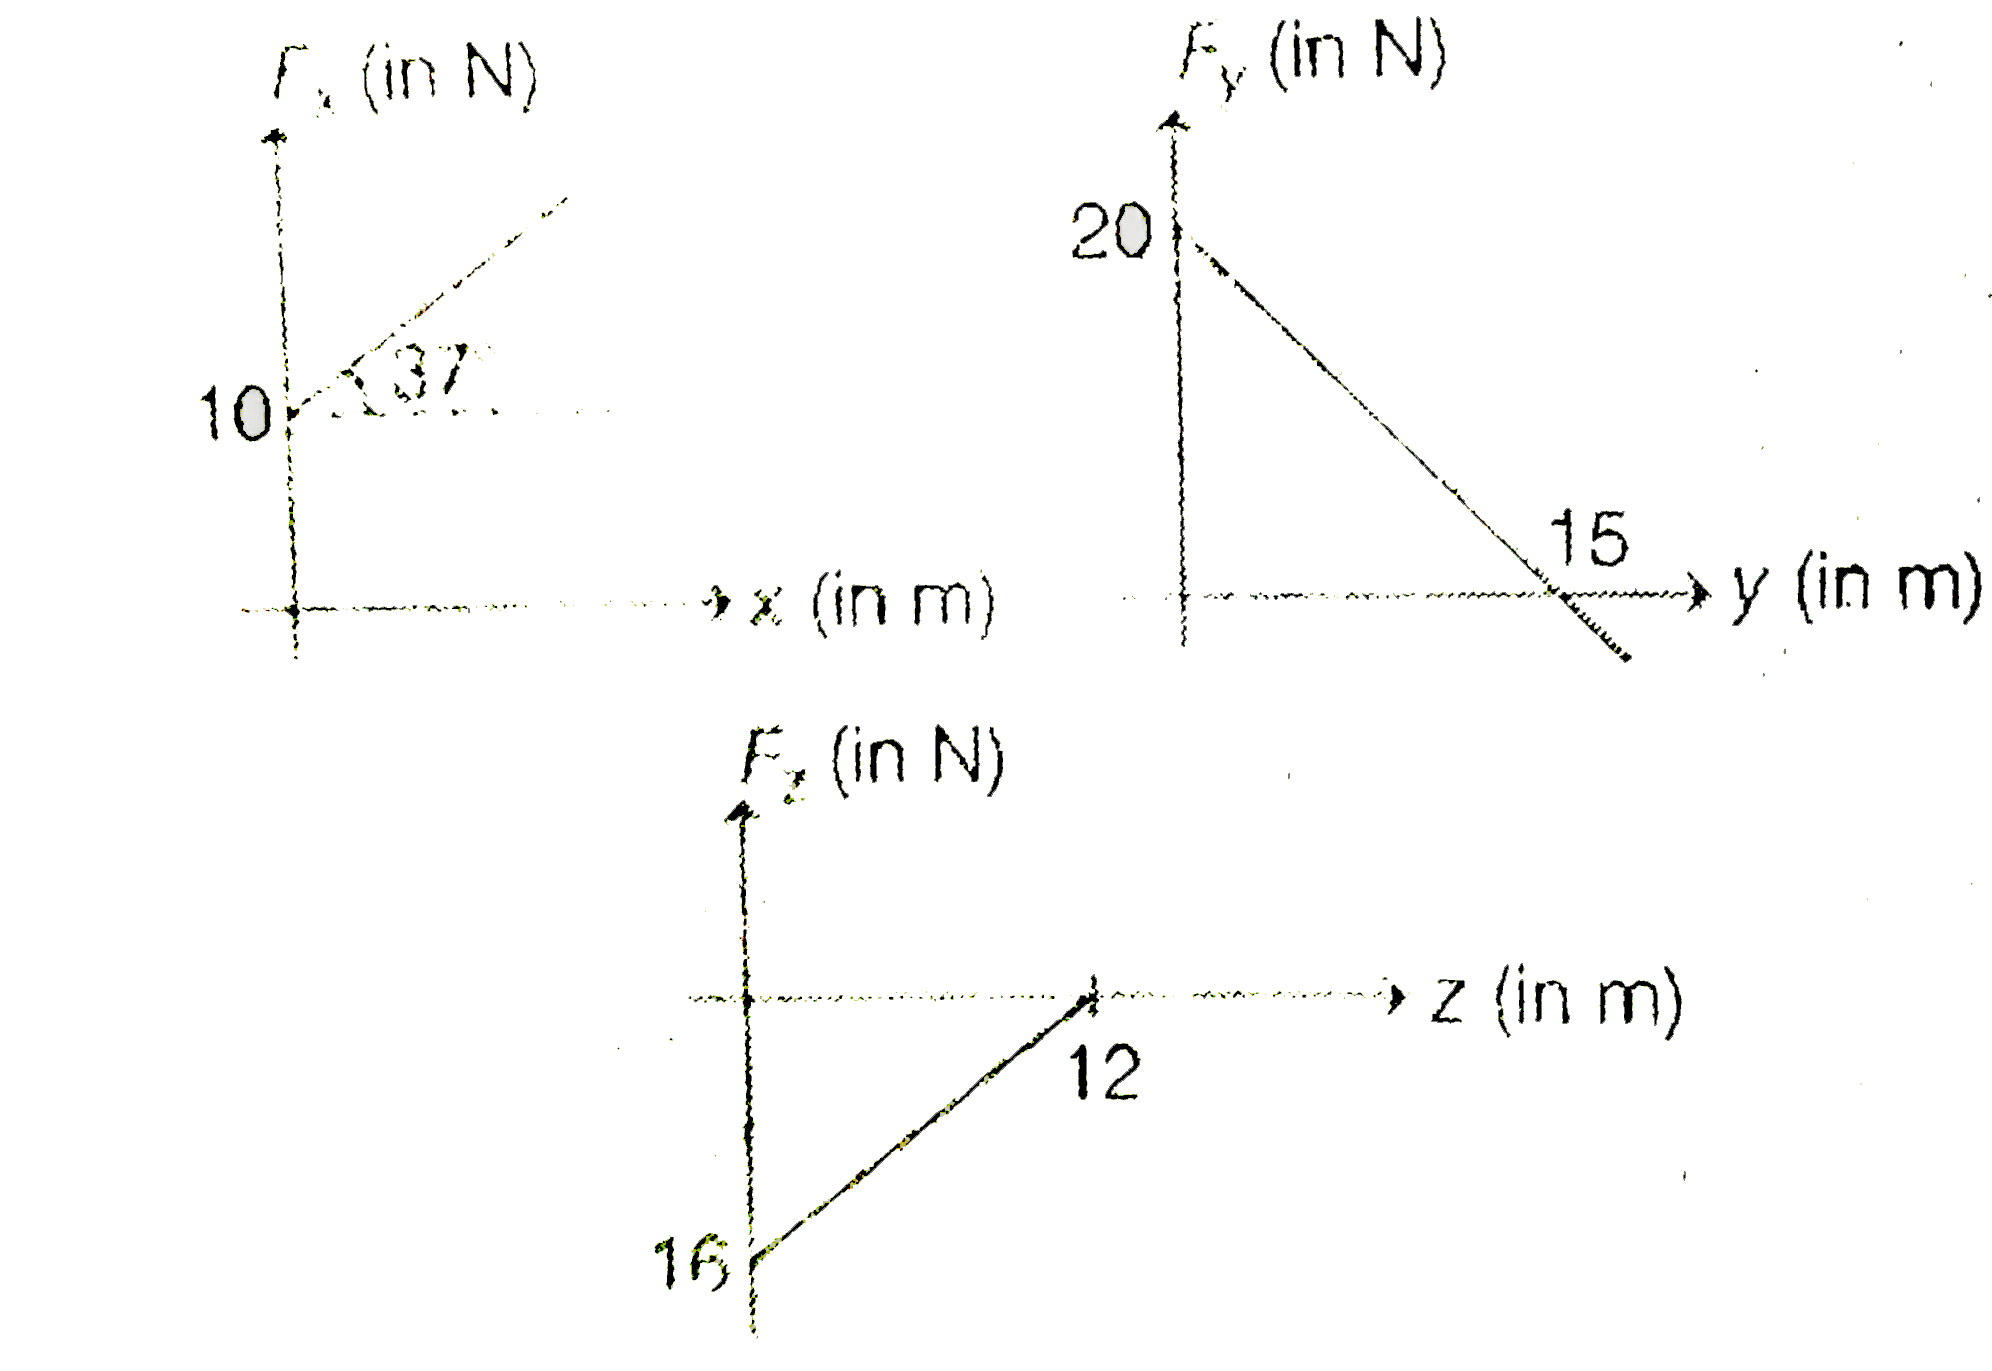
View SolutionThree components of a force acting on a particle are varying according to the graphs as shown. To reach at point B(8, 20, 0)m from point A(0, 5, 12)m the particle moves on paths parallel to x-axis then y-axis and then z-axis, then work done by this force is:
View SolutionNet force acting on a particle is always perpendicular to its velocity then : -
View Solution

