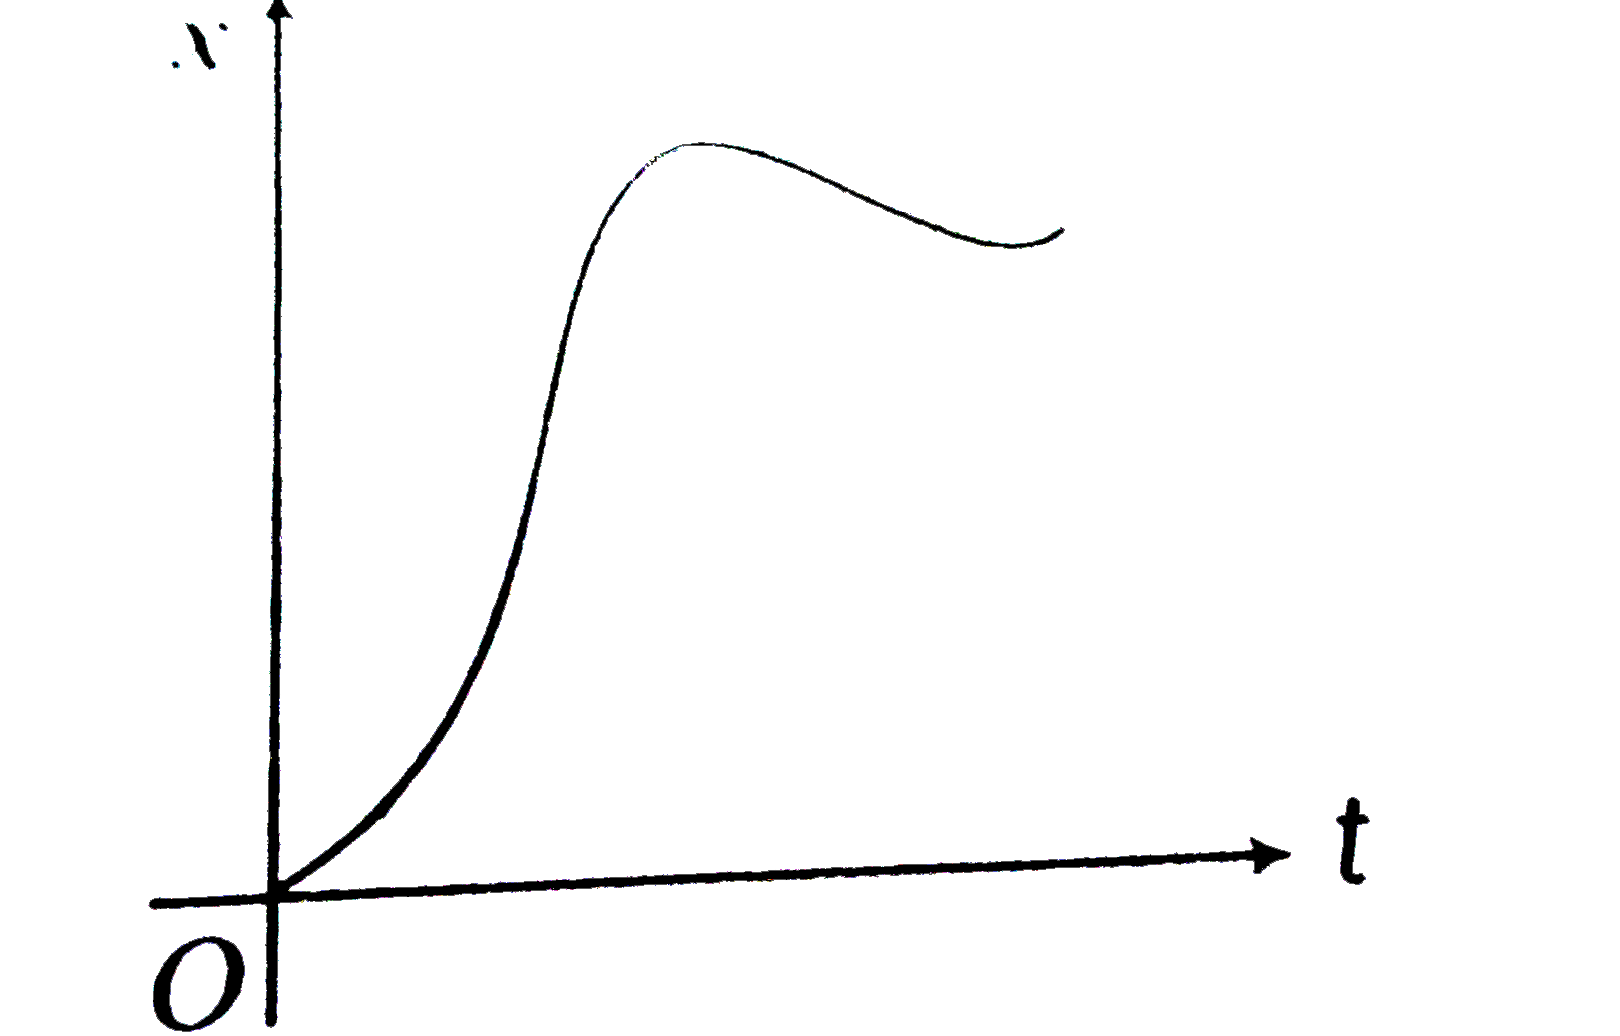
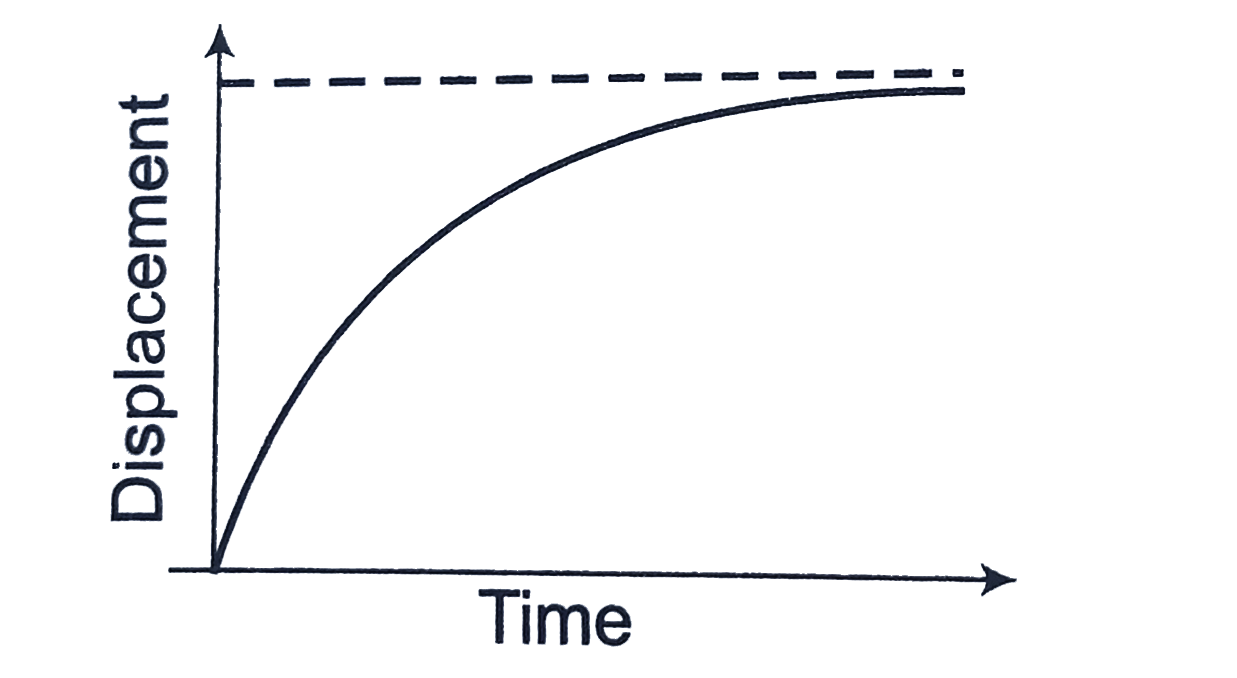
The displacement (x)-time (t) graph of a particle is shown in figure. Which of the following is correct ?
Particle starts with zero velocity and variable acceleration
Particle starts with non-zero velocity and variable acceleration
Particle starts with zero velocity and uniform acceleration
Particle starts with non-zero velocity and uniform acceleration
The correct Answer is:A
From the given graph, it is clear that
At t=0,dxdt=0
∴ Velocity υ=dxdt=0 , at t = 0
As time passes dxdt increases
∴ Velocity and hence acceleration changes.
Topper's Solved these Questions
- MOTION IN A PLANEBook:DC PANDEYChapter:MOTION IN A PLANEExercise:(B) Meical entrance special format questions (Assertion and reason)
Explore 19 Videos
- MOTION IN A PLANEBook:DC PANDEYChapter:MOTION IN A PLANEExercise:(B) Meical entrance special format questions (Mathch the columns)
Explore 6 Videos
- MOTION IN A PLANEBook:DC PANDEYChapter:MOTION IN A PLANEExercise:Check point 3.7
Explore 15 Videos
- MOTIONBook:DC PANDEYChapter:MOTIONExercise:Medical entrances gallery
Explore 19 Videos
- PROJECTILE MOTIONBook:DC PANDEYChapter:PROJECTILE MOTIONExercise:Level - 2 Subjective
Explore 10 Videos
Similar Questions
Knowledge Check
The velocity -displacement graph of a particle is as shown in the figure. Which of the following graphs correctly represents the variation of acceleration with displacement?
 A
A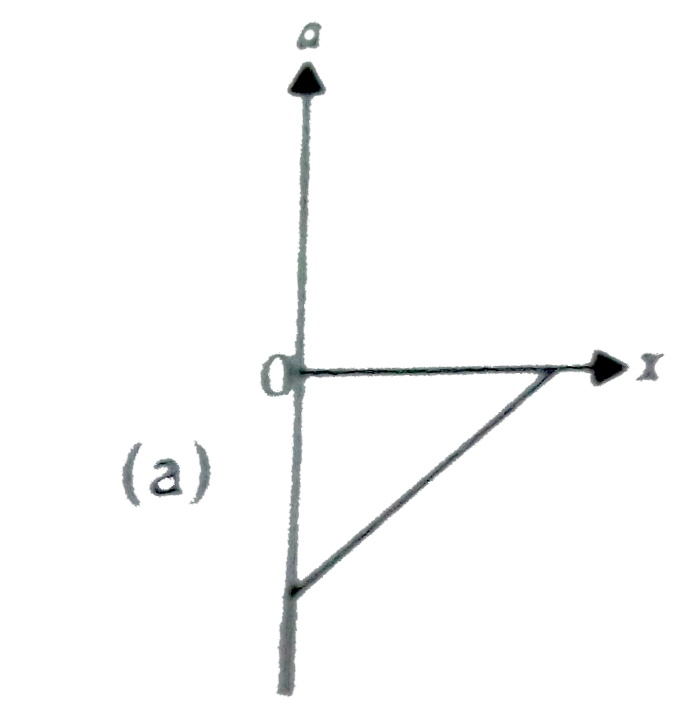 B
B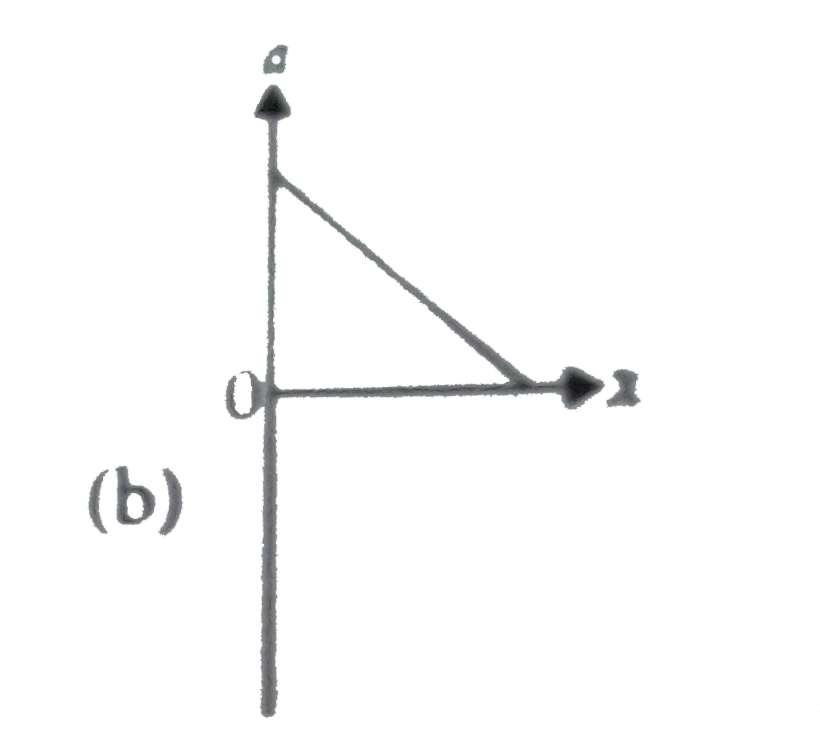 C
C D
D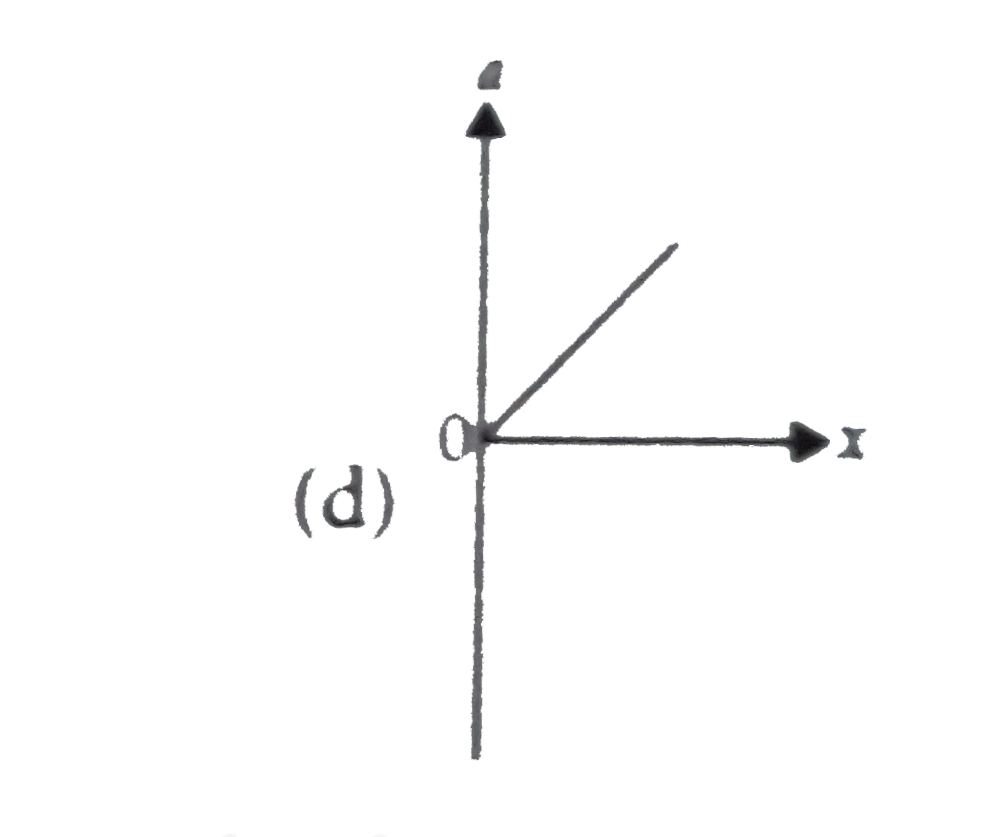
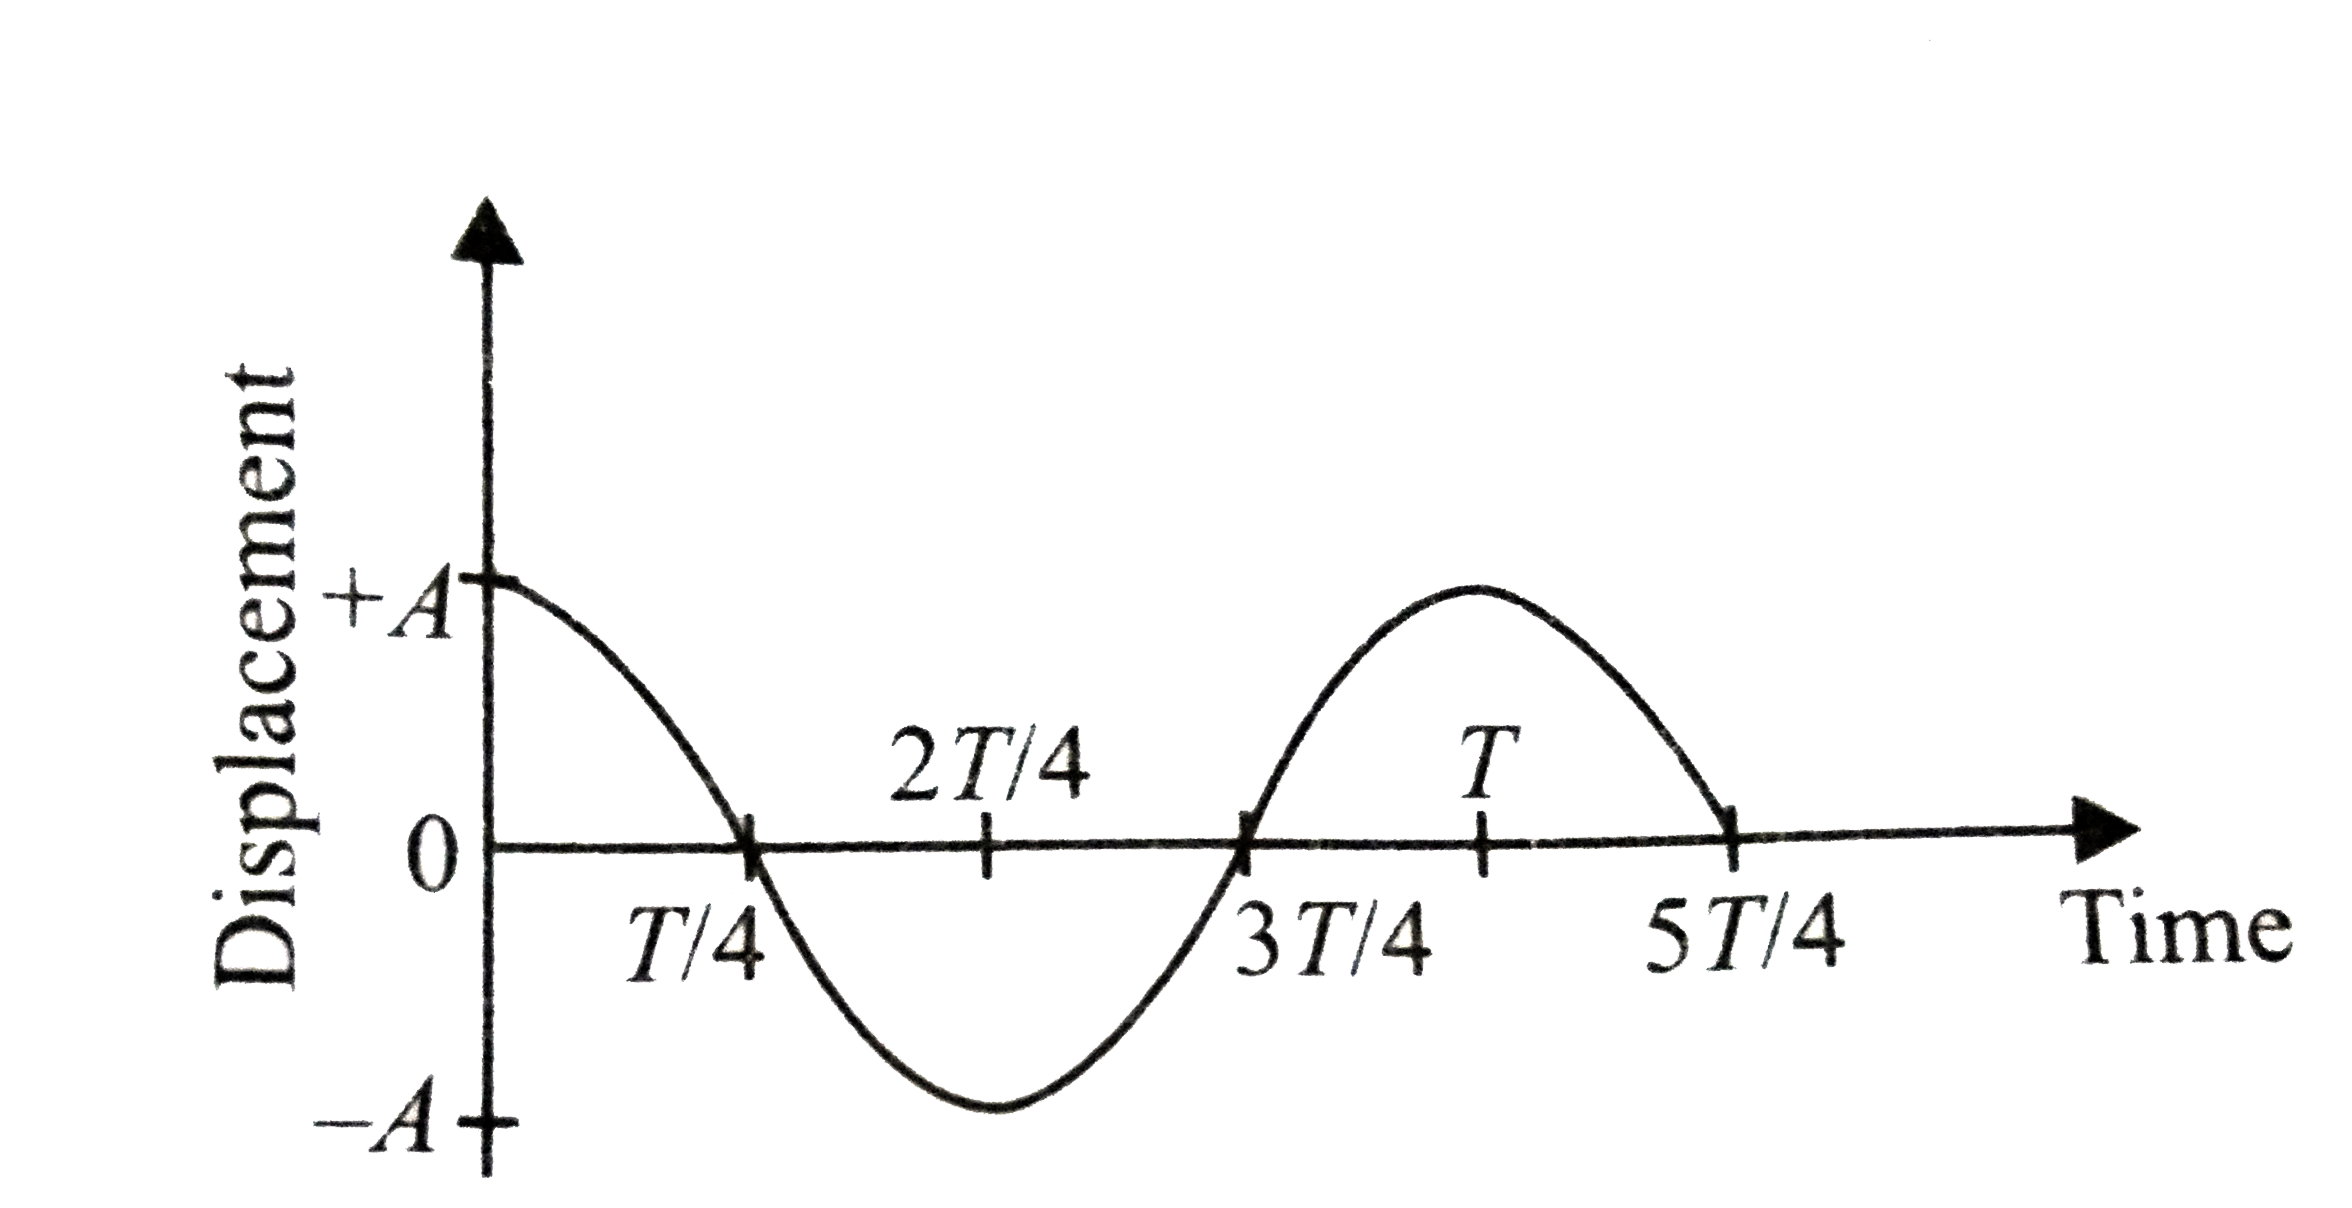
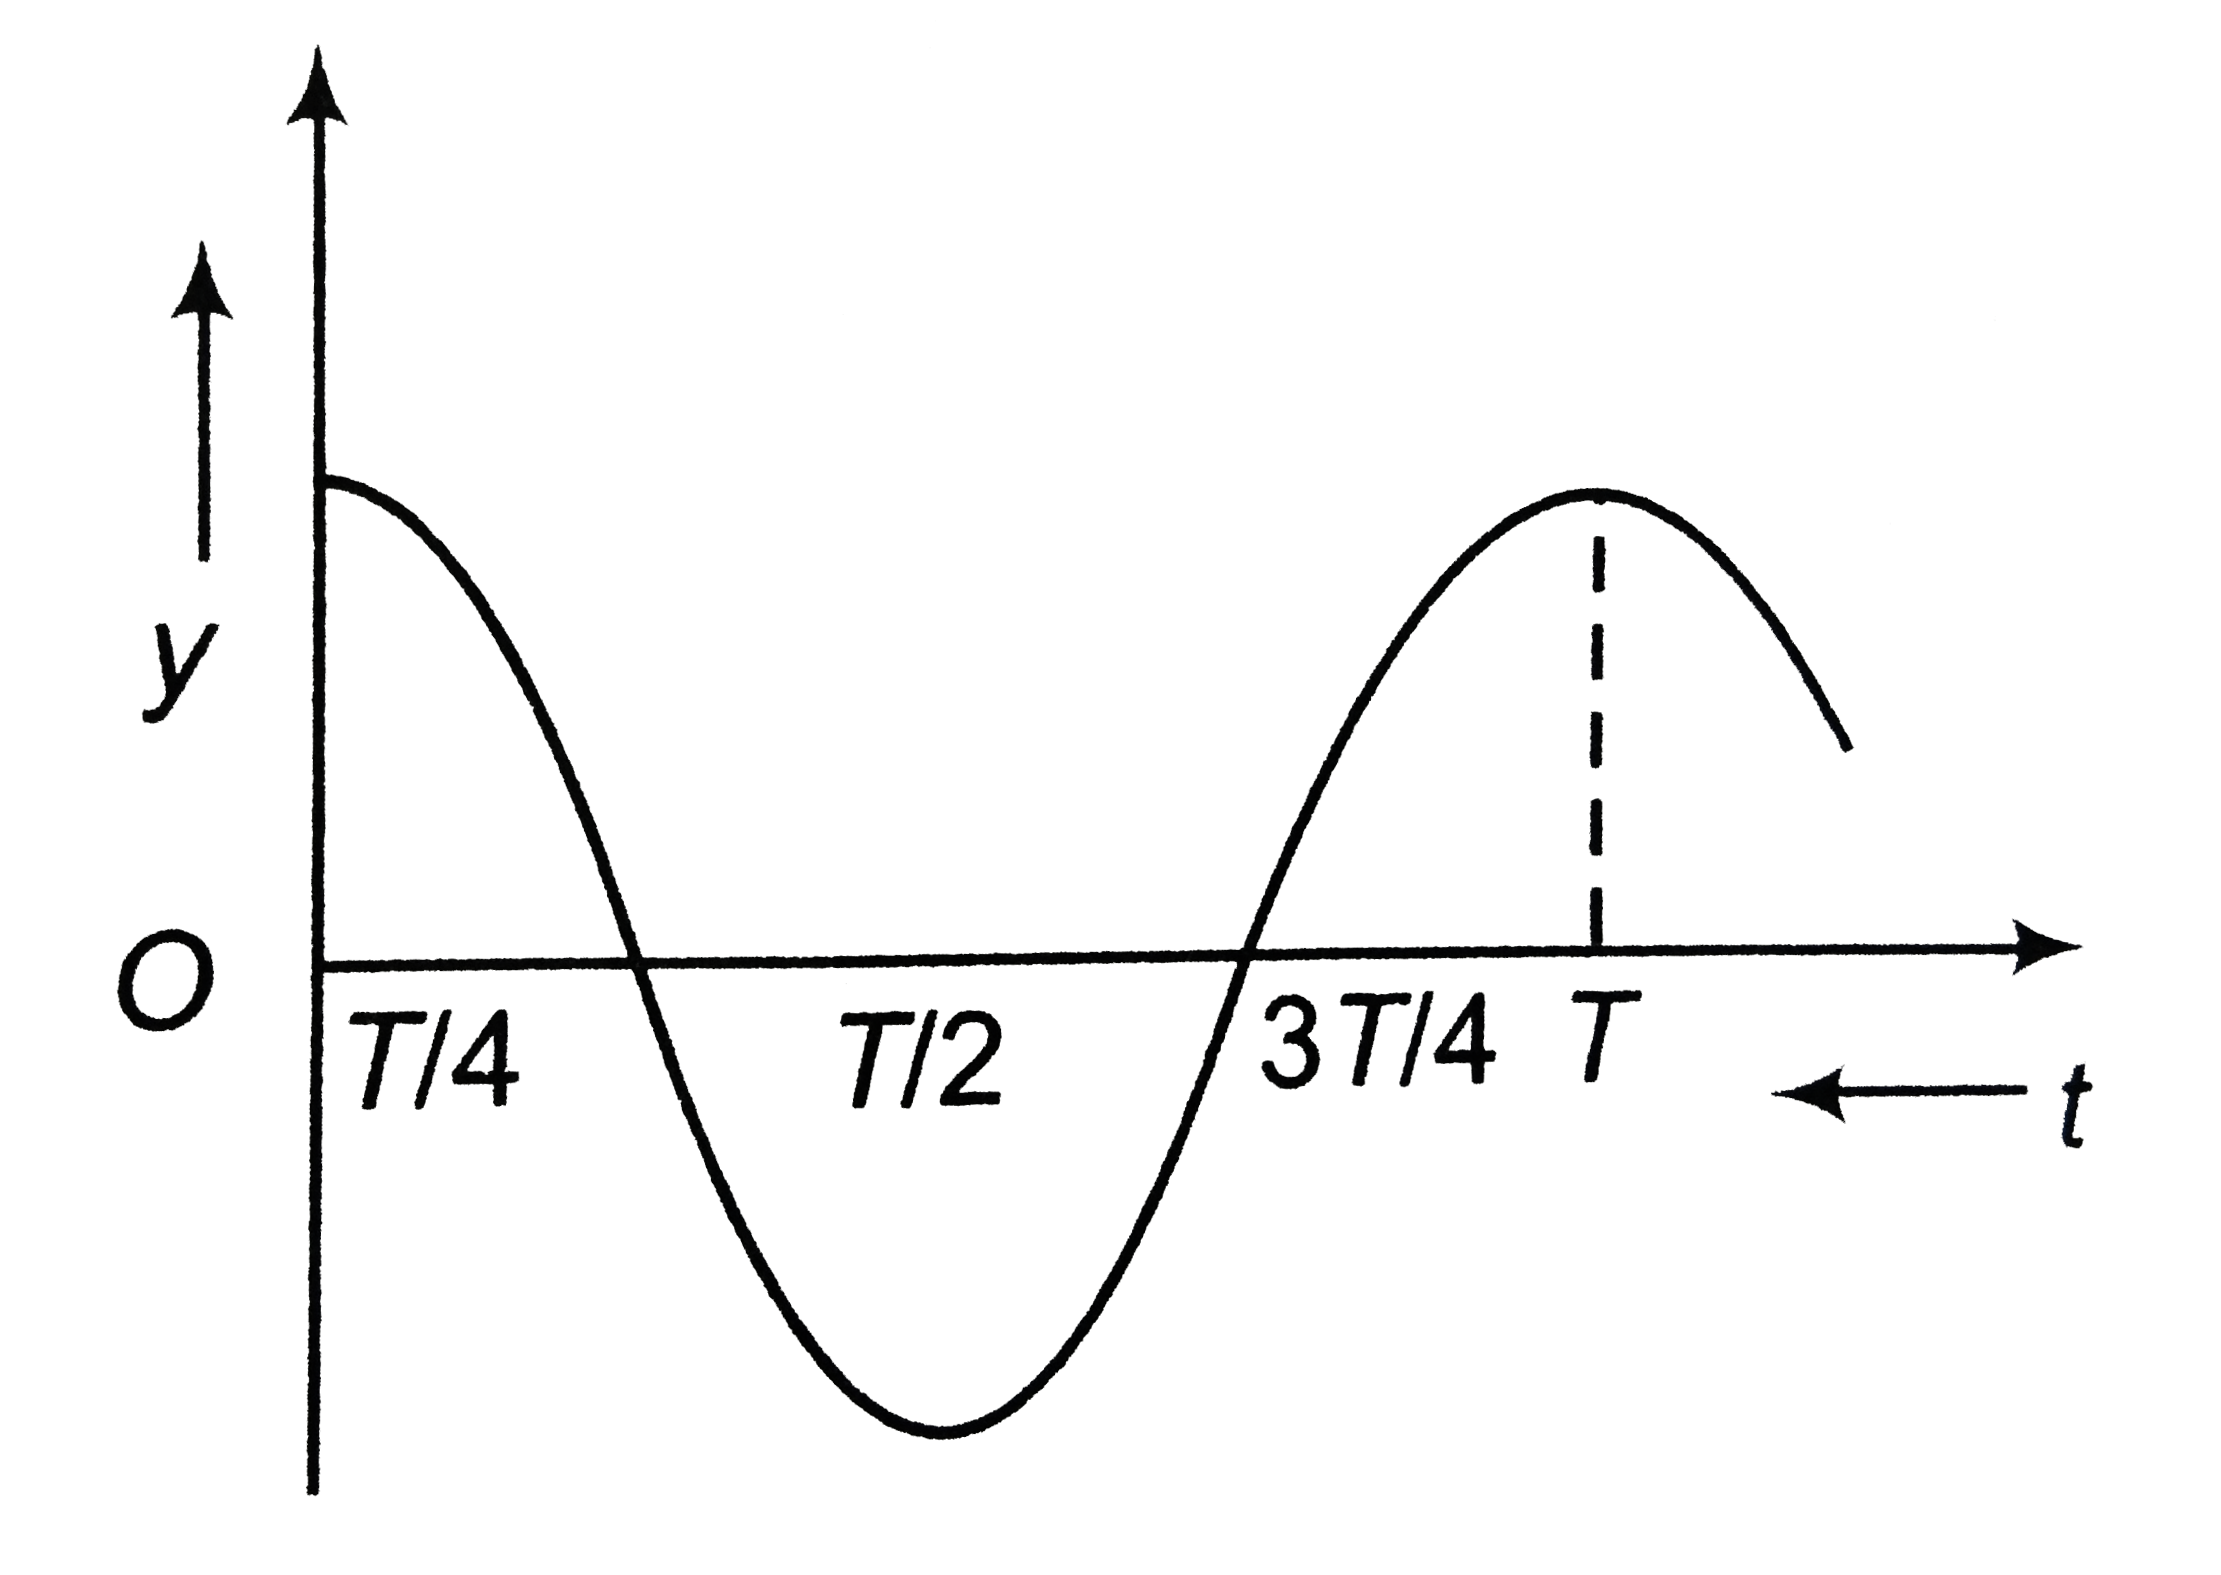
The displacement time graph of a particle executing S.H.M. is shown in figure. Which of the following statement is / are true ?
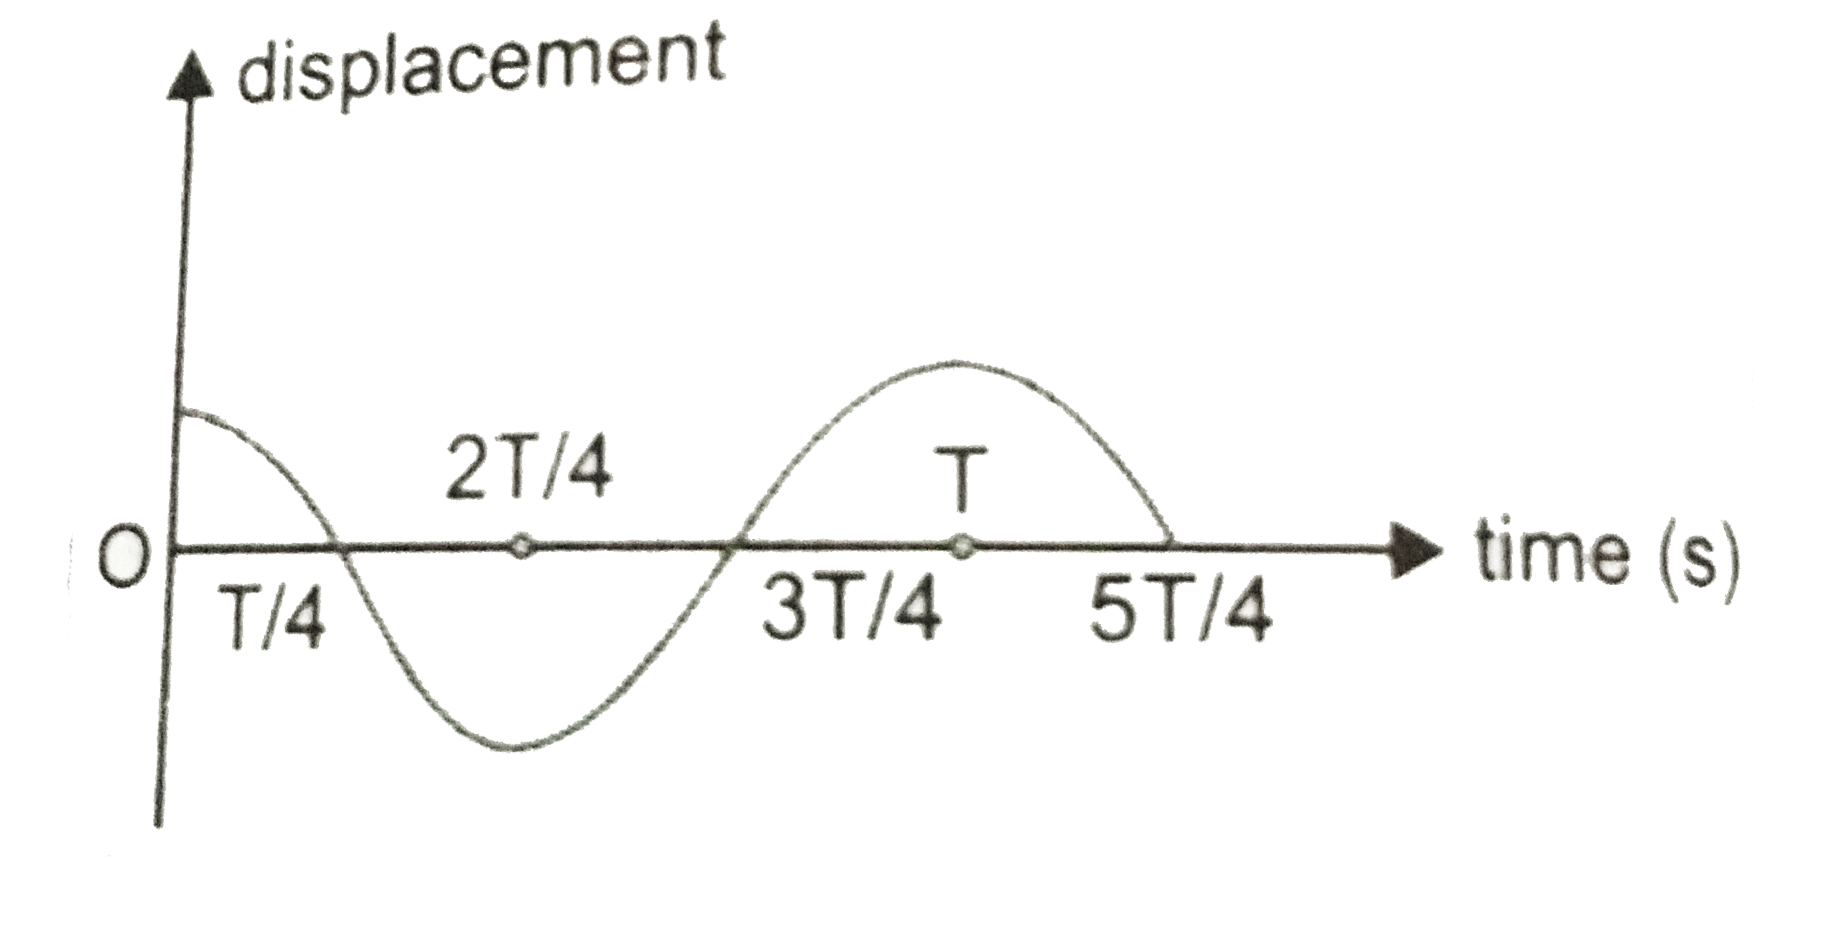 AThe force is zero at t=3T4BThe acceleration is maximum at t=4T4CThe velocity is maximum at t=T4DThe P.E. is equal to K.E. of oscillation at t=T2
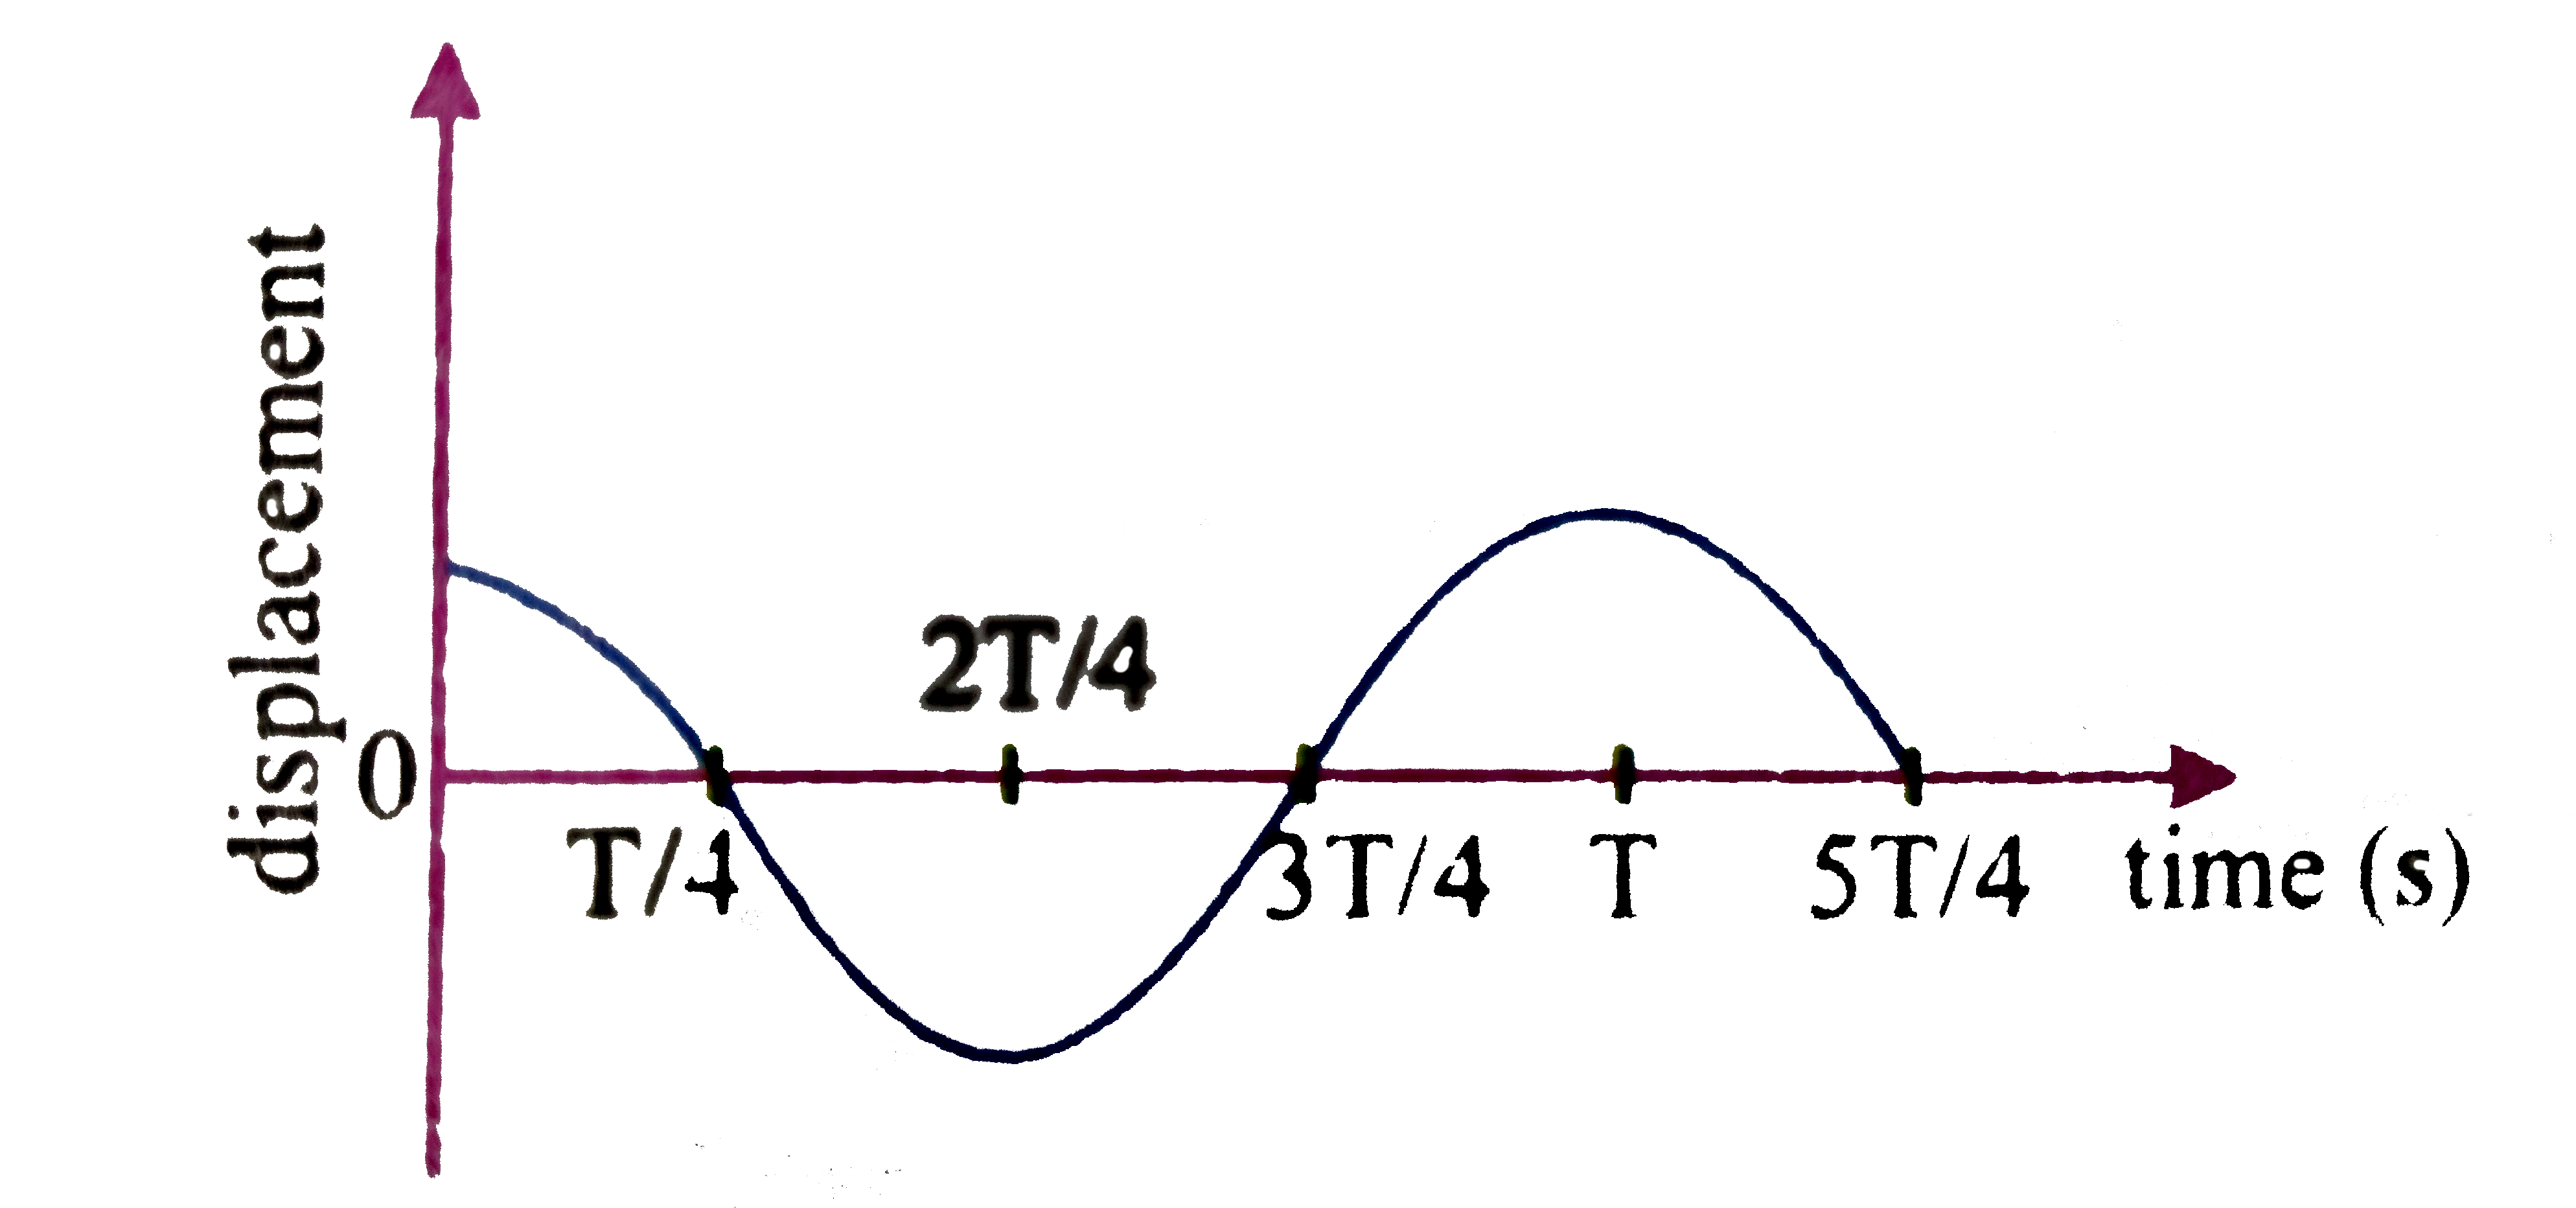
The displacement-time graph of a particle executing SHM is shown in figure. Which of the following statement is/are true ?
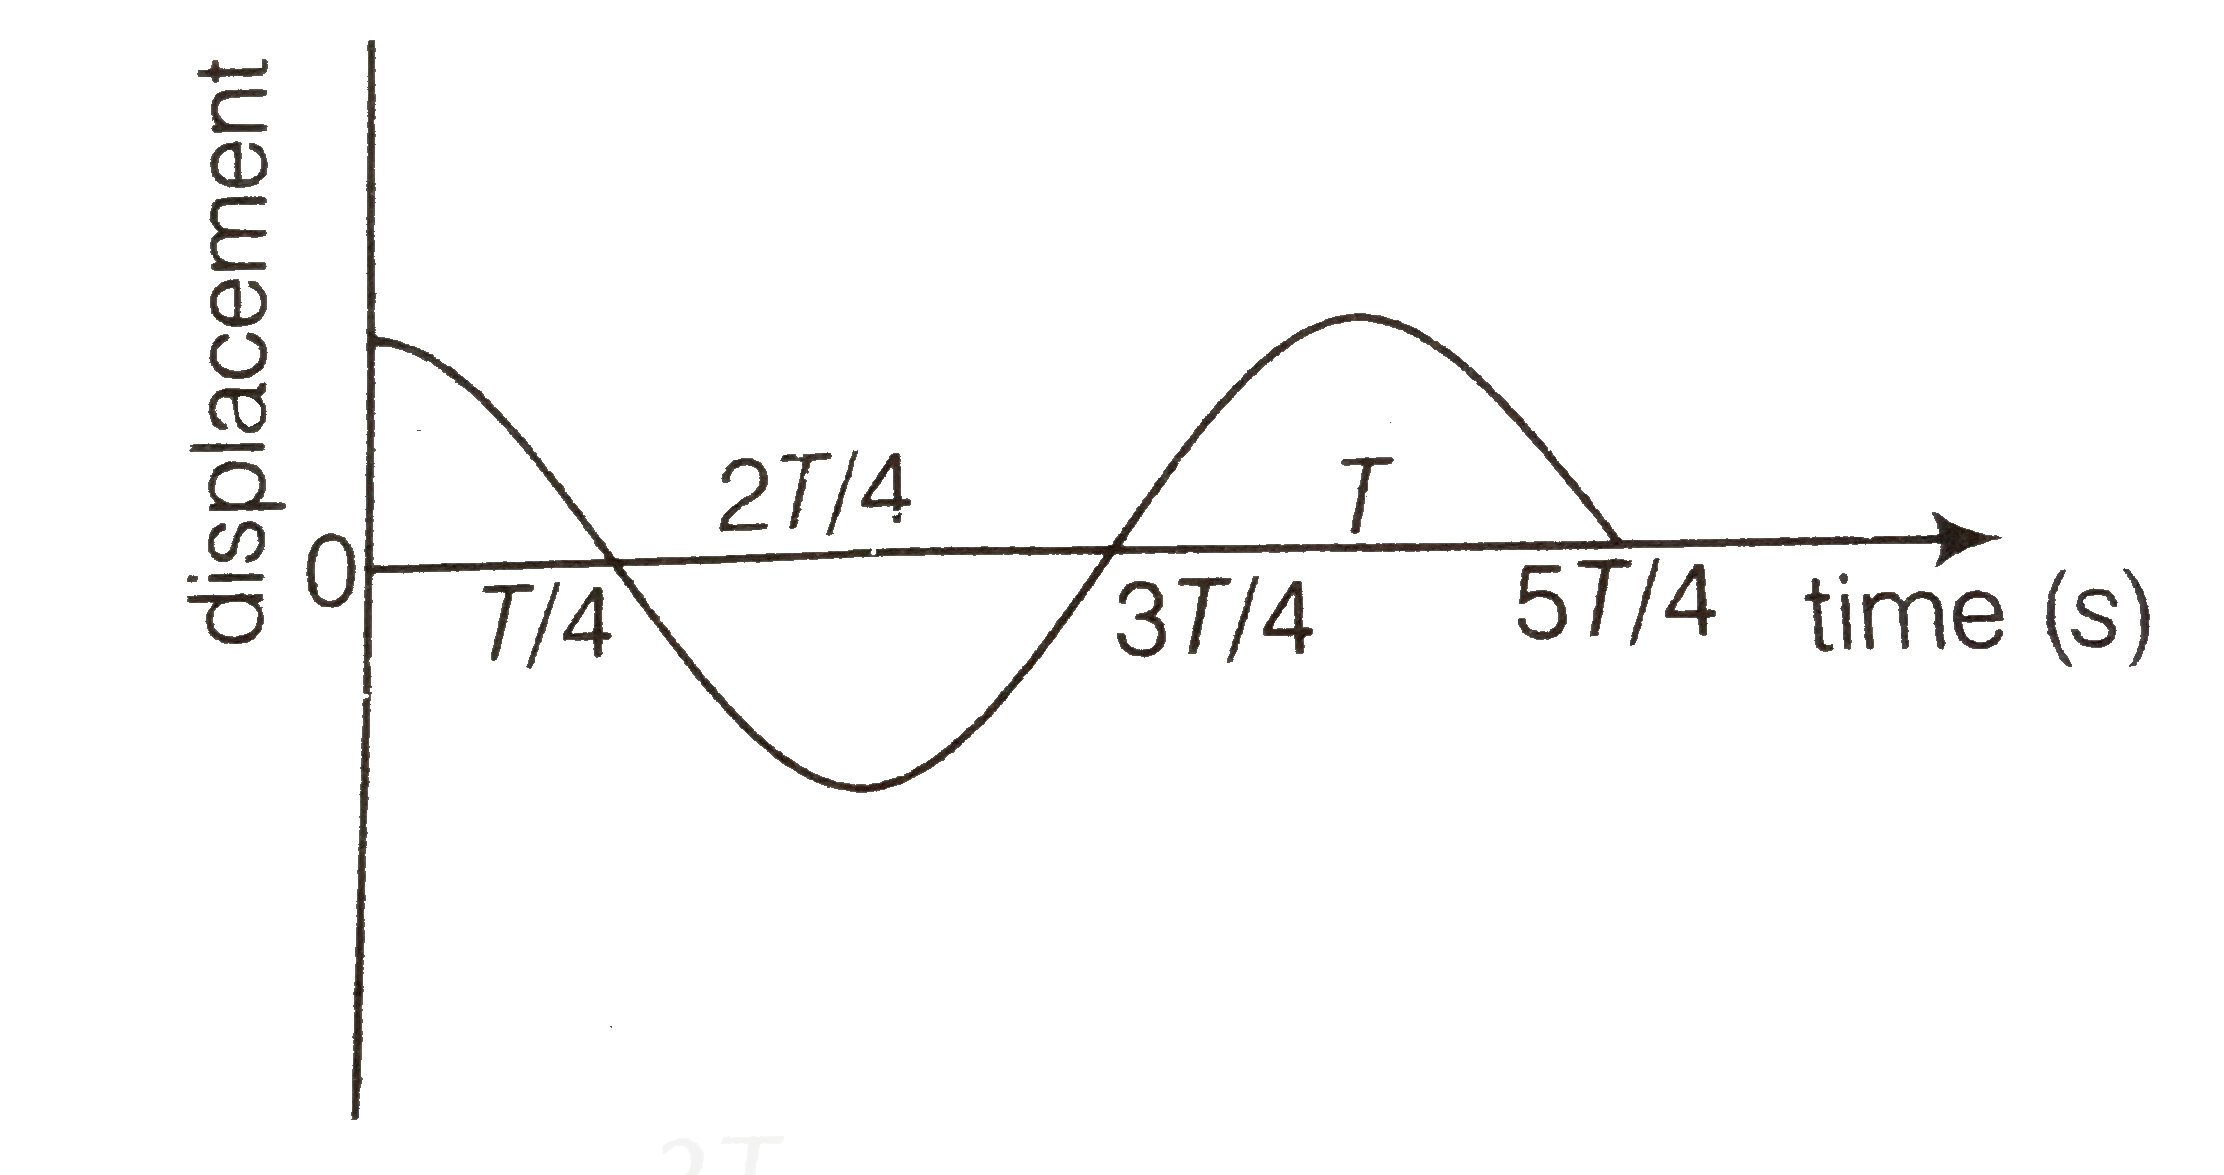 AThe focrce is zero at t=3T4BThe acceleration is maximum at t=4T4CThe velocity is maximum at t=T4DThe PE is equal to KE of oscillation at t=T2
If graph of y= f(x) is as shown in figure, then which of the following options is/are correct?
View SolutionThe displacement - time graph of a particle executing SHM is shown in figure. Which of the following statements is//are true ?
View SolutionThe displacement -time graph of a particle executing SHM is shown in figure. Which of the following statements is/are true ?
View SolutionThe velocity − time graph of a particle is as shown in figure

View SolutionThe displacement-time graph of a particle is as shown below. It indicates that
View Solution


