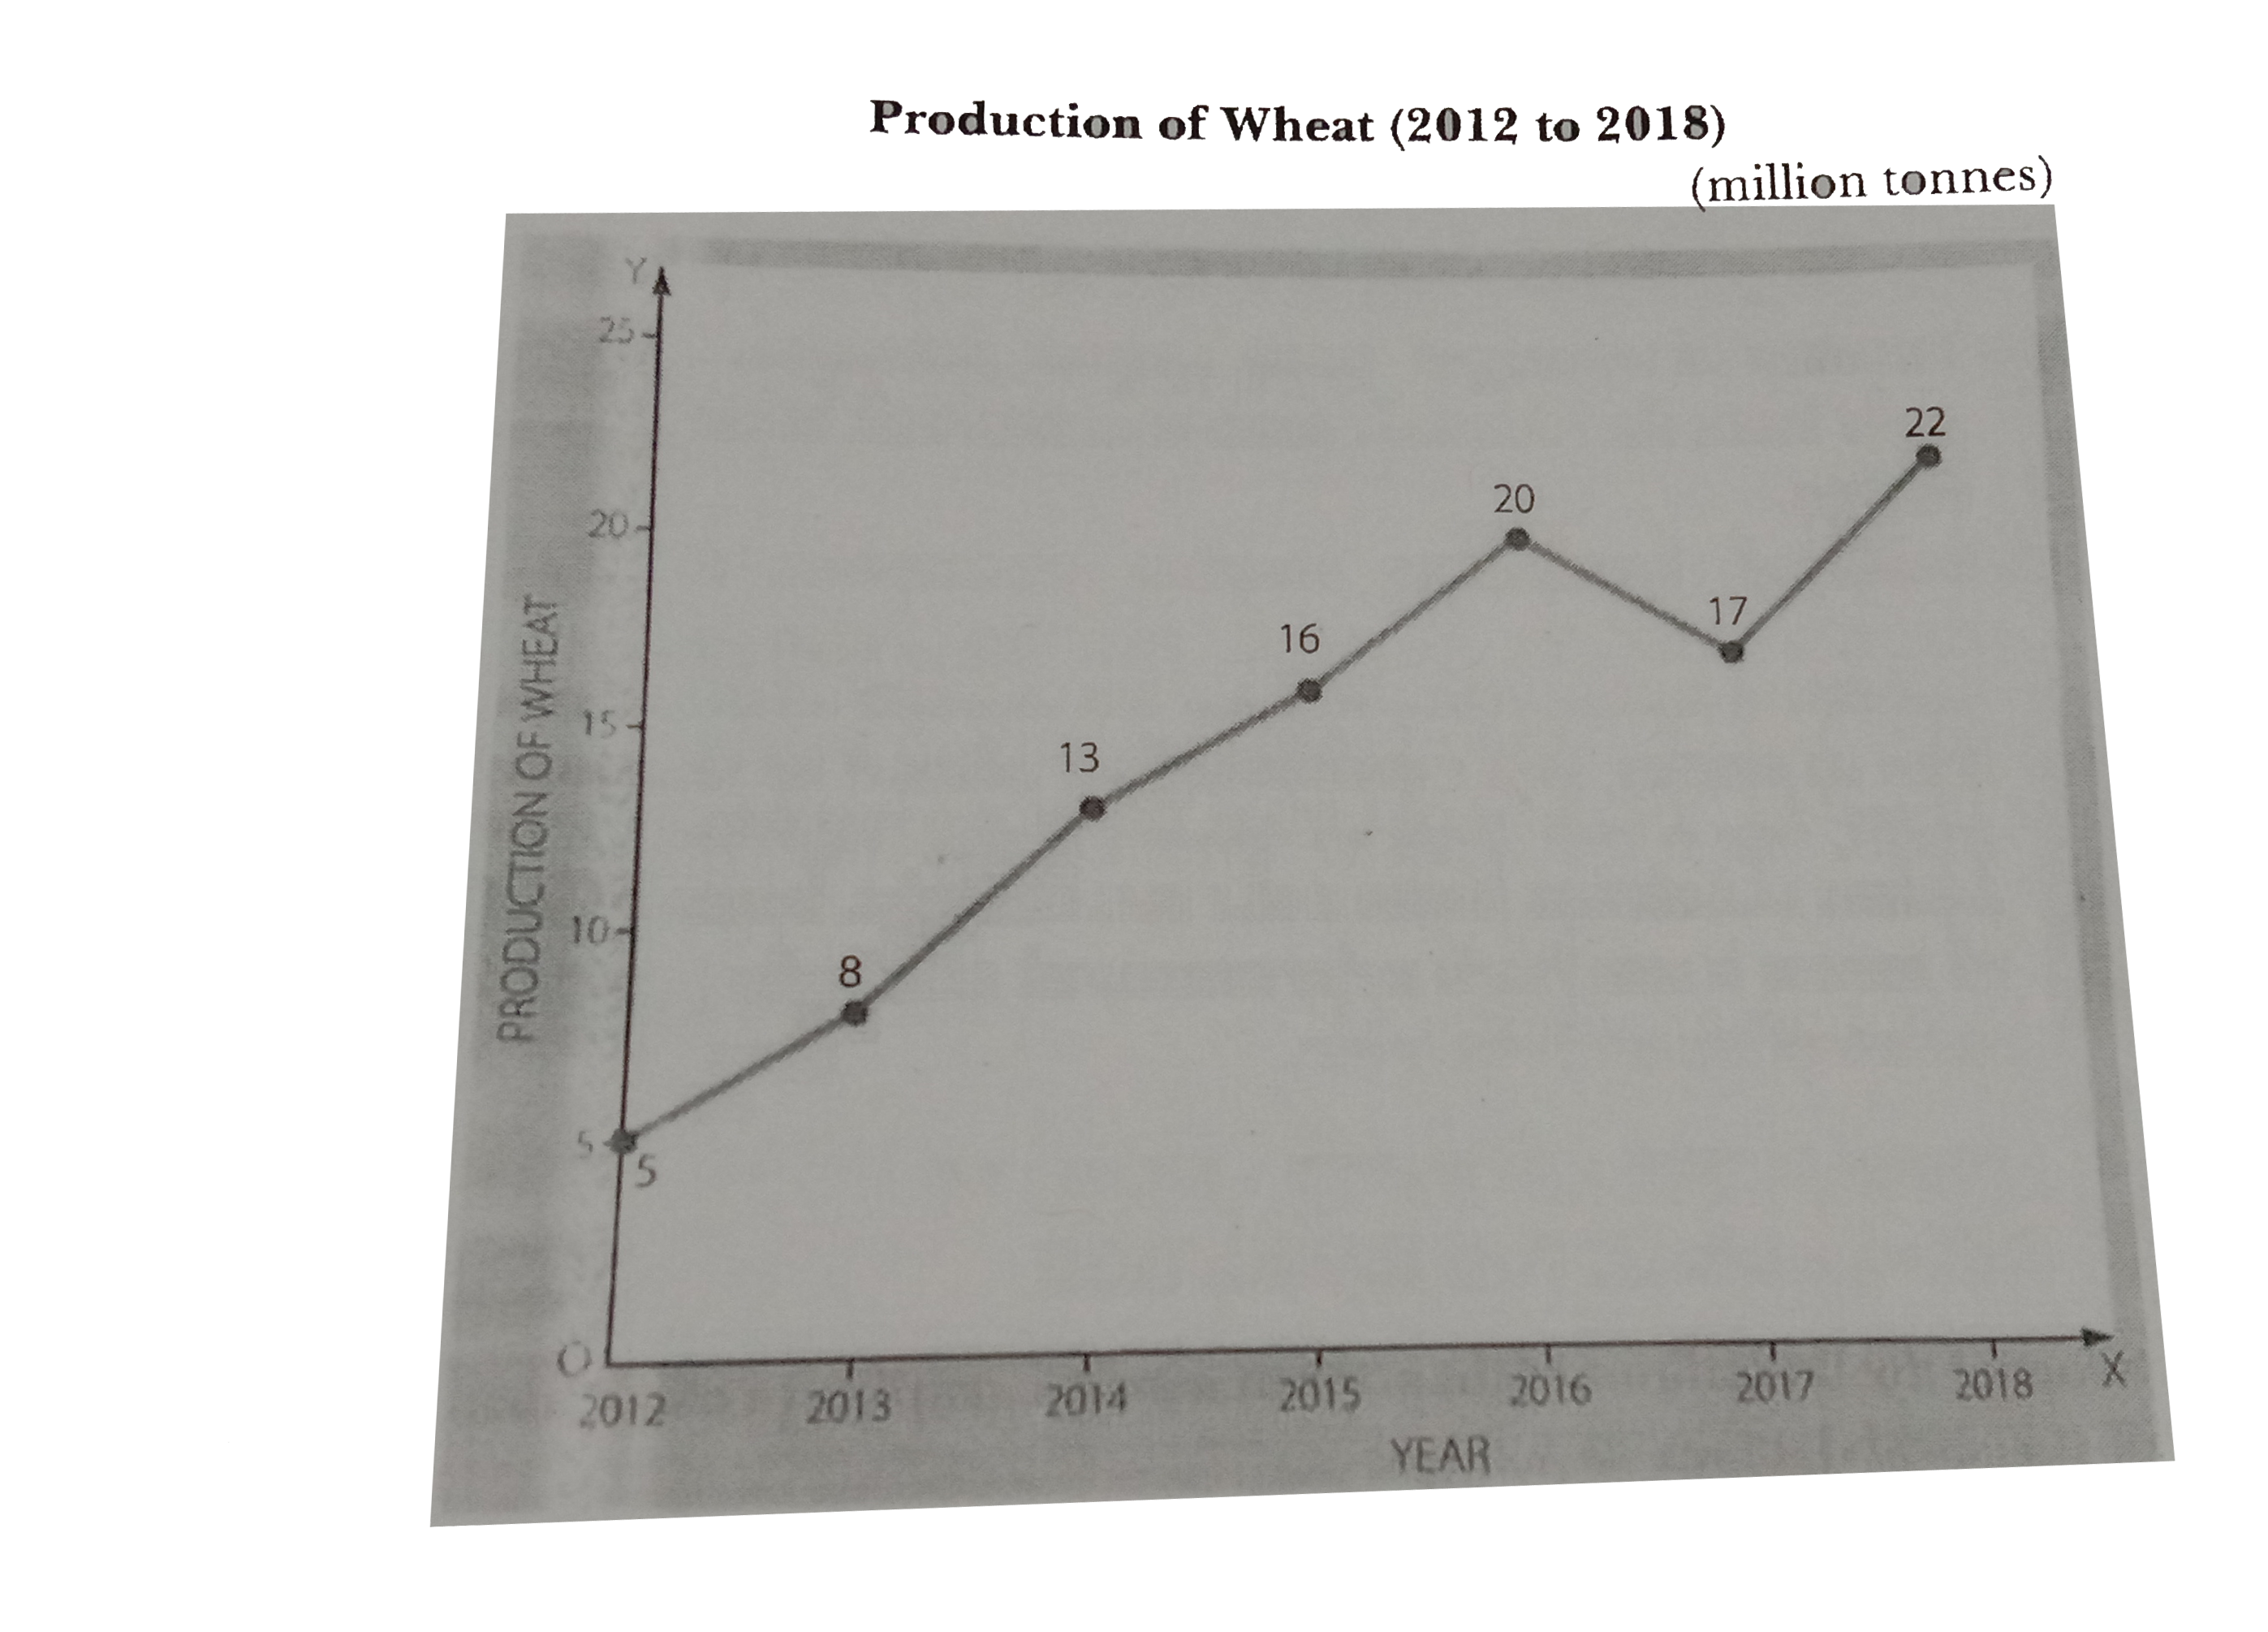
Represent the following data (hypothetical data) graphically:
Year2012201320142015201620172018Production of Wheat (in million tonnes)581316201722
Topper's Solved these Questions
- ARITHMETIC LINE-GRAPHS OR TIME SERIES GRAPHSBOOK - TARUN JAIN & VK OHRICHAPTER - ARITHMETIC LINE-GRAPHS OR TIME SERIES GRAPHSEXERCISE - A. Mupltiple Choice Questions
6 Videos
- ARITHMETIC LINE-GRAPHS OR TIME SERIES GRAPHSBOOK - TARUN JAIN & VK OHRICHAPTER - ARITHMETIC LINE-GRAPHS OR TIME SERIES GRAPHSEXERCISE - B. Fill in the blank
4 Videos
- CENSUS AND SAMPLE METHODS OF COLLECTION OF DATABOOK - TARUN JAIN & VK OHRICHAPTER - CENSUS AND SAMPLE METHODS OF COLLECTION OF DATAEXERCISE - NCERT Question
9 Videos
Similar Questions
Represent the following data related to export and imports to India (hypothetical figures) graphically:
Year2012201320142015201620172018Exports (in Rs. crore)300350400380450280250Imports (in Rs. crore)420460600480550450400
View SolutionRepresent the following data related to population (in thousands) of men and women in a village in different years graphically:
Year2012201320142015201620172018Number of Men10131514171821Number of Women12181617202224
View SolutionPlot the annual profits of a firm on a time series graph:
Year201320142015201620172018Profit ('000 Rs.)607275658095
View SolutionFollowing table gives hypothetical figures of exports from India during the years 2013-14 to 2017-18. Present the information in the form of a suitable graph.
Year2013−142014−152015−162016−172017−18Exports (Rs. core)600640670780900
View SolutionThe following are the sales figures of TVs of Firm A, during 2013, 2018:
Year201320142015201620172018Sale (in thousand units)2,1552,2012,1902,2502,0952,170
View SolutionTaking 2004 as base year, construct the index numbers of the year 2014 and 2018.
Year200420142015201620172018Prices (Rs.) 10 14 16 20 22 24
View SolutionUse following information of an imaginary country :
Year2014−20152015−20162016−2017Nominal GDP 6.5 8.4 9GDP Deflator 100 140 125
(i) For which year is real GDP and nominal GDP same and why ?
(ii) Calculate Real GDP for the given years. Is there any year for which Real GDP falls ?
View SolutionCalculate the median from the following data :
Size10121416182022Frequency2512201073
View SolutionGiven the following data , calculate mode using the grouping technique .
Size2345678910111213Frequency381012161410817541
View SolutionPlot the following hypothetical figures on time series graphs:
YearImports(Rs. thousand crore)Exports (Rs. thousand crore)2013−14 123 1062014−15 178 1402015−16 215 1592016−17 231 2032017−18 245 209
View Solution

