Given the following data , calculate mode using the grouping technique .
Size2345678910111213Frequency381012161410817541
Video Solution
Text Solution

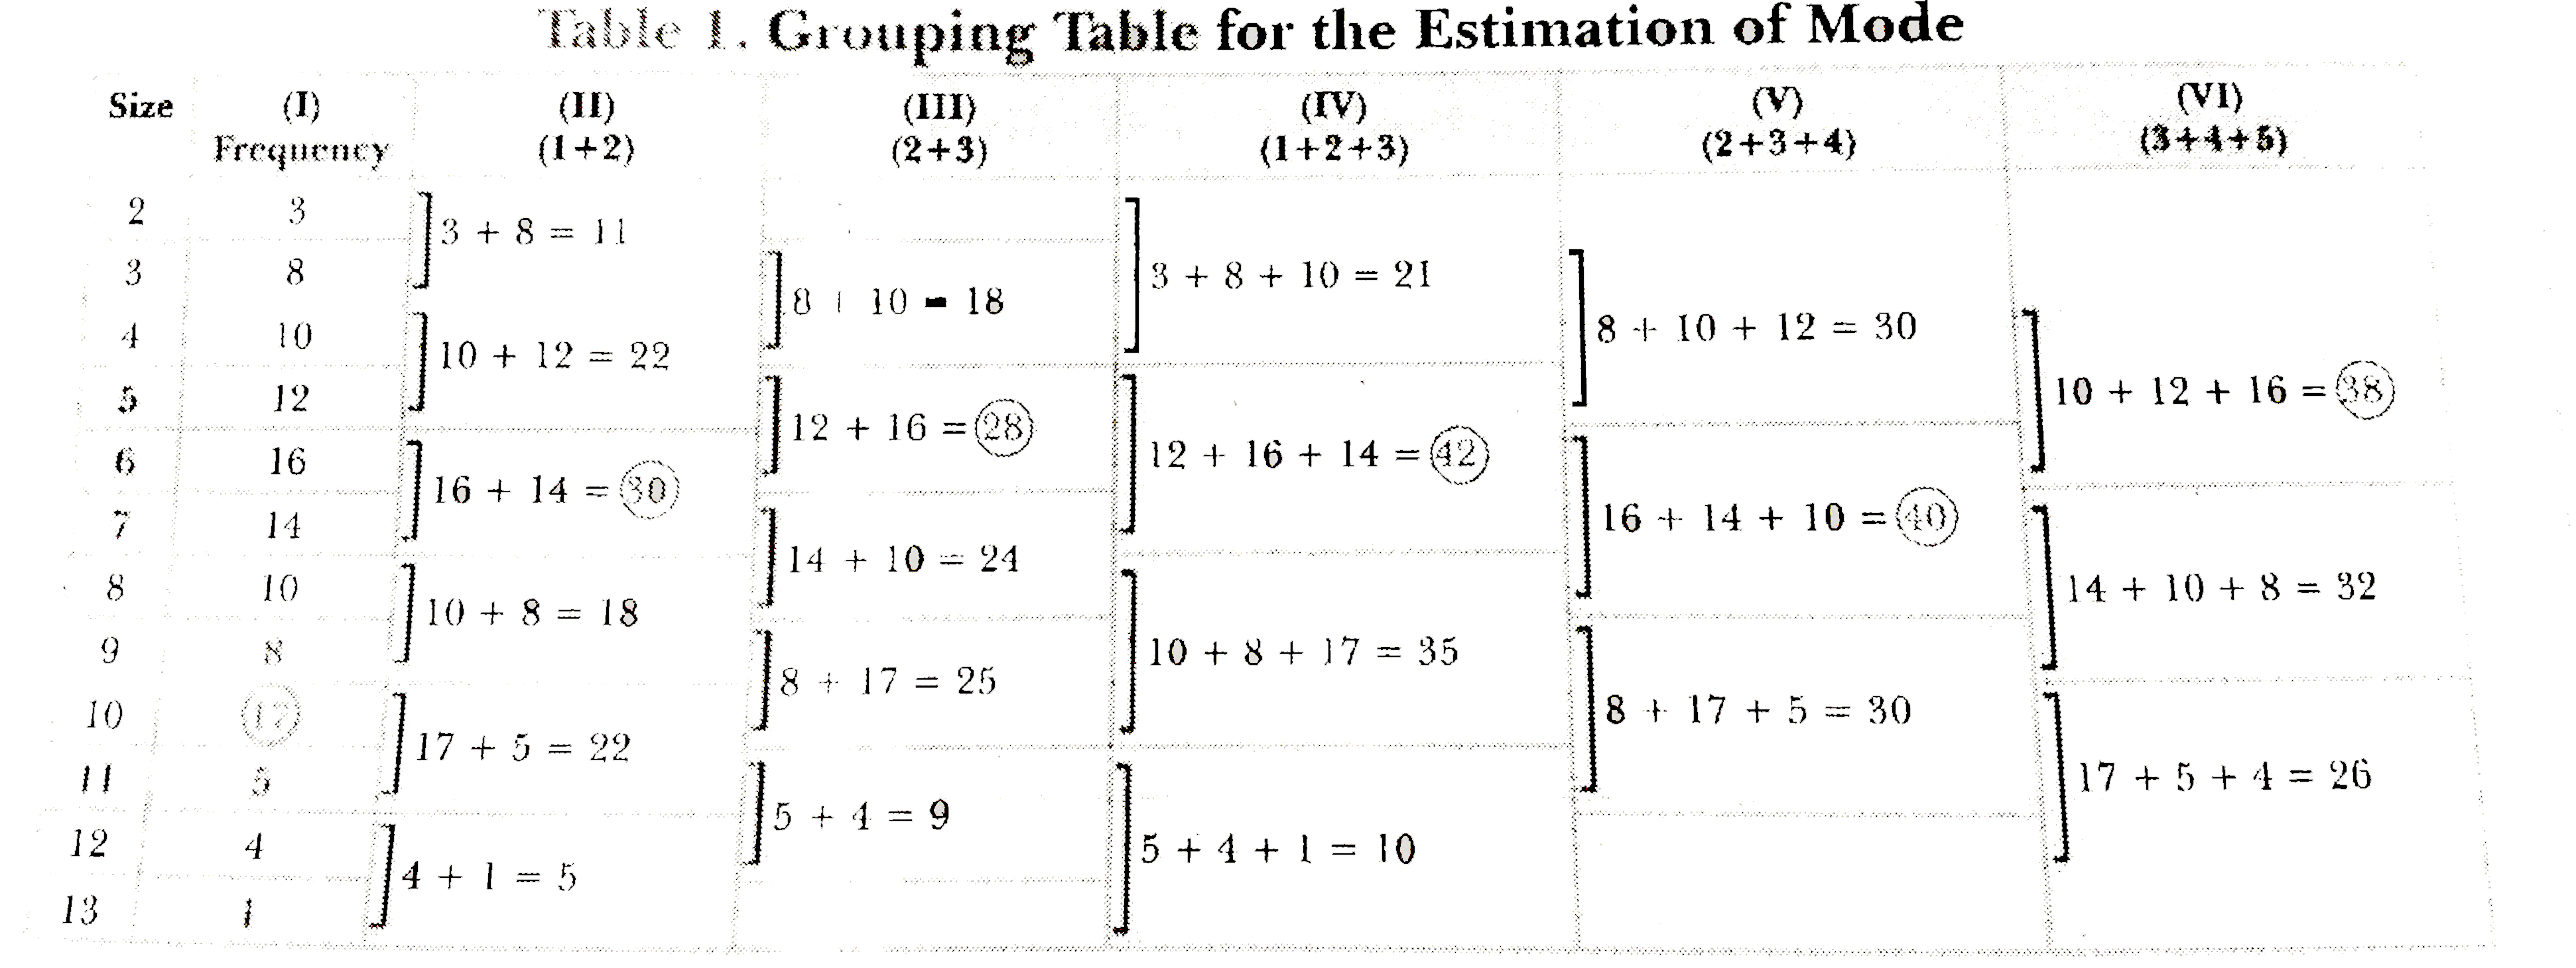
Check the following Tables 1 and 2 and the subsequent details. There are 6 columns in the table on the frequency and its groupings , as in Table 1.
In Column I, the frequencies as given in the question are noted agianst the respective items.
In Column II, the frequencies are grouped in twos beginning with the item.
In Column III, the frequencies are grouped in twos beginning with 2nd item .
In Column Iv , the frequencies are frouped into threes beginning with 1st item.
In Column V the frequencies are frouped into threes beginning with 2nd item.
In Column VI , the frequencies are grouped into threes beginning with 3rd item.
Highest value in all the columns are shown in bold letters or are underlined, or encircled .

Analysis Table shows those items corresponding to which there are highest frequencies in different columns . Thus , in column I Column the highest total is 17 and this corresponds to the item 10. For column I a tick mark (√) is accordingly noted against 10 in the Analysis Table . Likewise , in column II the highest total is 30 and this corresponds to the items 6 and 7 (bracketed). A tick mark (True) is accordingly noted aginst 6 as well as 7 in the Analysis Table.
Similarly , in column III the highest total is 28 and it corresponds to the items 5 and 6. Thus , a tick mark is noted aginst 5,6 , and 7 in column IV . Likewise , tick mark are noted in other columns . the Anakysis Tabl shows that item 6 item 6 has the largest number of tick marks . thus , the Mode (Z) =6.
|
Topper's Solved these Questions
- MEASURES OF CENTRAL TENDENCY MEDIAN AND MODEBook:TARUN JAIN & VK OHRIChapter:MEASURES OF CENTRAL TENDENCY MEDIAN AND MODEExercise:Miscellaneous Illustrations
Explore 30 Videos
- MEASURES OF CENTRAL TENDENCY MEDIAN AND MODEBook:TARUN JAIN & VK OHRIChapter:MEASURES OF CENTRAL TENDENCY MEDIAN AND MODEExercise:Objective Type Questios
Explore 26 Videos
- MEASURES OF CENTRAL TENDENCY - ARITHMETIC MEANBook:TARUN JAIN & VK OHRIChapter:MEASURES OF CENTRAL TENDENCY - ARITHMETIC MEANExercise:Illustration
Explore 72 Videos
- MEASURES OF DISPERSIONBook:TARUN JAIN & VK OHRIChapter:MEASURES OF DISPERSIONExercise:Learning by doing
Explore 30 Videos
Similar Questions
Knowledge Check
4, 6, 8, 9, 10, 11, 12 (a) 10 (b) 11 (c) 12 (d) 9
A10B11C12D957846623?101412
A2B4C61D387101213121517109?14
A12B10C21D25
From the following data , determine the mode by grouping method :
Size7891011121314151617Frequency236122024257531
View SolutionCalculate Q1,Q3,D7andP89 from the following data :
Size1234567891011Frequency581522364428171293
View SolutionCalcilation Q1,Q3,D6andP85 from the following data :
Size101112131415161718Frequency34512107521
View SolutionFind out median of the series of the following table :
Items345678Frequency6911142310
View SolutionFind the mode of the following discrete series.
x123456789f381519121457
View Solution

