Plot the annual profits of a firm on a time series graph:
Year201320142015201620172018Profit ('000 Rs.)607275658095
Step by step video & image solution for Plot the annual profits of a firm on a time series graph: {:("Year",2013,2014,2015,2016,2017,2018),("Profit ('000 Rs.)",60,72,75,65,80,95):} by Economics experts to help you in doubts & scoring excellent marks in Class 11 exams.
Updated on:21/07/2023Topper's Solved these Questions
- ARITHMETIC LINE-GRAPHS OR TIME SERIES GRAPHSBook:TARUN JAIN & VK OHRIChapter:ARITHMETIC LINE-GRAPHS OR TIME SERIES GRAPHSExercise:NCERT Questions
Explore 2 Videos
- ARITHMETIC LINE-GRAPHS OR TIME SERIES GRAPHSBook:TARUN JAIN & VK OHRIChapter:ARITHMETIC LINE-GRAPHS OR TIME SERIES GRAPHSExercise:Long Answer Type Questions
Explore 3 Videos
- CENSUS AND SAMPLE METHODS OF COLLECTION OF DATABook:TARUN JAIN & VK OHRIChapter:CENSUS AND SAMPLE METHODS OF COLLECTION OF DATAExercise:NCERT Question
Explore 9 Videos
Similar Questions
Following table gives hypothetical figures of exports from India during the years 2013-14 to 2017-18. Present the information in the form of a suitable graph.
Year2013−142014−152015−162016−172017−18Exports (Rs. core)600640670780900
View SolutionRepresent the following data related to export and imports to India (hypothetical figures) graphically:
Year2012201320142015201620172018Exports (in Rs. crore)300350400380450280250Imports (in Rs. crore)420460600480550450400
View Solution
Knowledge Check
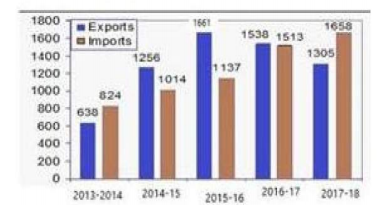
The given Bar Graph present the Imports and Exports of an item (in tonnes) manufactured by a company for the five financial years, 2013-2014 to 2017-2018.
दिया गया दंड आरेख (बार ग्राफ) पांच वित्त वर्षों, 2013-2014 से 2017-2018, के दौरान किसी कंपनी दवारा निर्यात किसी वस्तु (टन में] के आयात और निर्यात को दर्शाता है| What is the ratio of total Imports to total Exports during 2013-2014, 2015-2016 and 2017-2018?
2013-2014, 2015-2016 3X 2017-2018 के दौरान कुल आयात का कुल निर्यात से क्या अनुपात है?A3604:3073B4011:4175C3619:3604D4175:4011
Taking 2004 as base year, construct the index numbers of the year 2014 and 2018.
Year200420142015201620172018Prices (Rs.) 10 14 16 20 22 24
View SolutionThe following are the sales figures of TVs of Firm A, during 2013, 2018:
Year201320142015201620172018Sale (in thousand units)2,1552,2012,1902,2502,0952,170
View SolutionRepresent the following data (hypothetical data) graphically:
Year2012201320142015201620172018Production of Wheat (in million tonnes)581316201722
View SolutionThe profits of a firm for the last five years were as follows :
Year ended 31st MarchProfits (Rs.)201143,000201250,000201352,000201465,000201585,000
You are required to calculate the value of goodwill on the basis of two year's purchase of weighted average profits. The weights to be used are :
2011 - 1, 2012 - 2, 2013 - 3, 2014 - 4, 2015 - 5.
View SolutionCompute the value of goodwill on the basis of four years purchase of the average profits based on the last five years? The profits for the last five years were as follows:
Rs.201340000201450000201560000201650000201760000
View Solution1. The goodwill of a firm is to be worked out at three years’ purchase of the average profits of the last five years which are as follows:
YearProfits(Loss)(Rs)201210000201315000201440002015(5000)20166000
2. The capital employed of the firm is Rs. 1,00,000 and normal rate of return is 8%, the average profits for last 5 years are Rs. 12,000 and goodwill is to be worked out at 3 years’ purchase of super profits,
3. Rama Brothers earn an average profit of Rs. 30,000 with a capital of Rs. 2,00,000. The normal rate of return in the business is 10%. Using capitalisation of super profits method work out the value the goodwill of the firm.
View SolutionA and B are partners sharing profits equally. They agree to admit C for equal share. For this purpose goodwill is to be valued at 150% of the average annual profits of the last 5 year's profits.
Profits were :
Year ended Rs.31st March201540,000 ,,201660,000 ,,20171,00,000 ,,201820,000 (Loss) ,,20191,50,000
It was observed that :
(1) During the year ended 31st March 2016, an asset of the original cost of Rs. 2,00,000 with book value of Rs. 1,50,000 was sold for Rs. 1,24,000. (3) On 1st April 2017, 2 Computer's costing Rs. 1,00,000 were purchased and were wrongly debited to Travelling Expenses. Depreciation on Computers was to be charged @ 20% p.a. on written down value basis.
Calculate the value of goodwill.
View Solution

