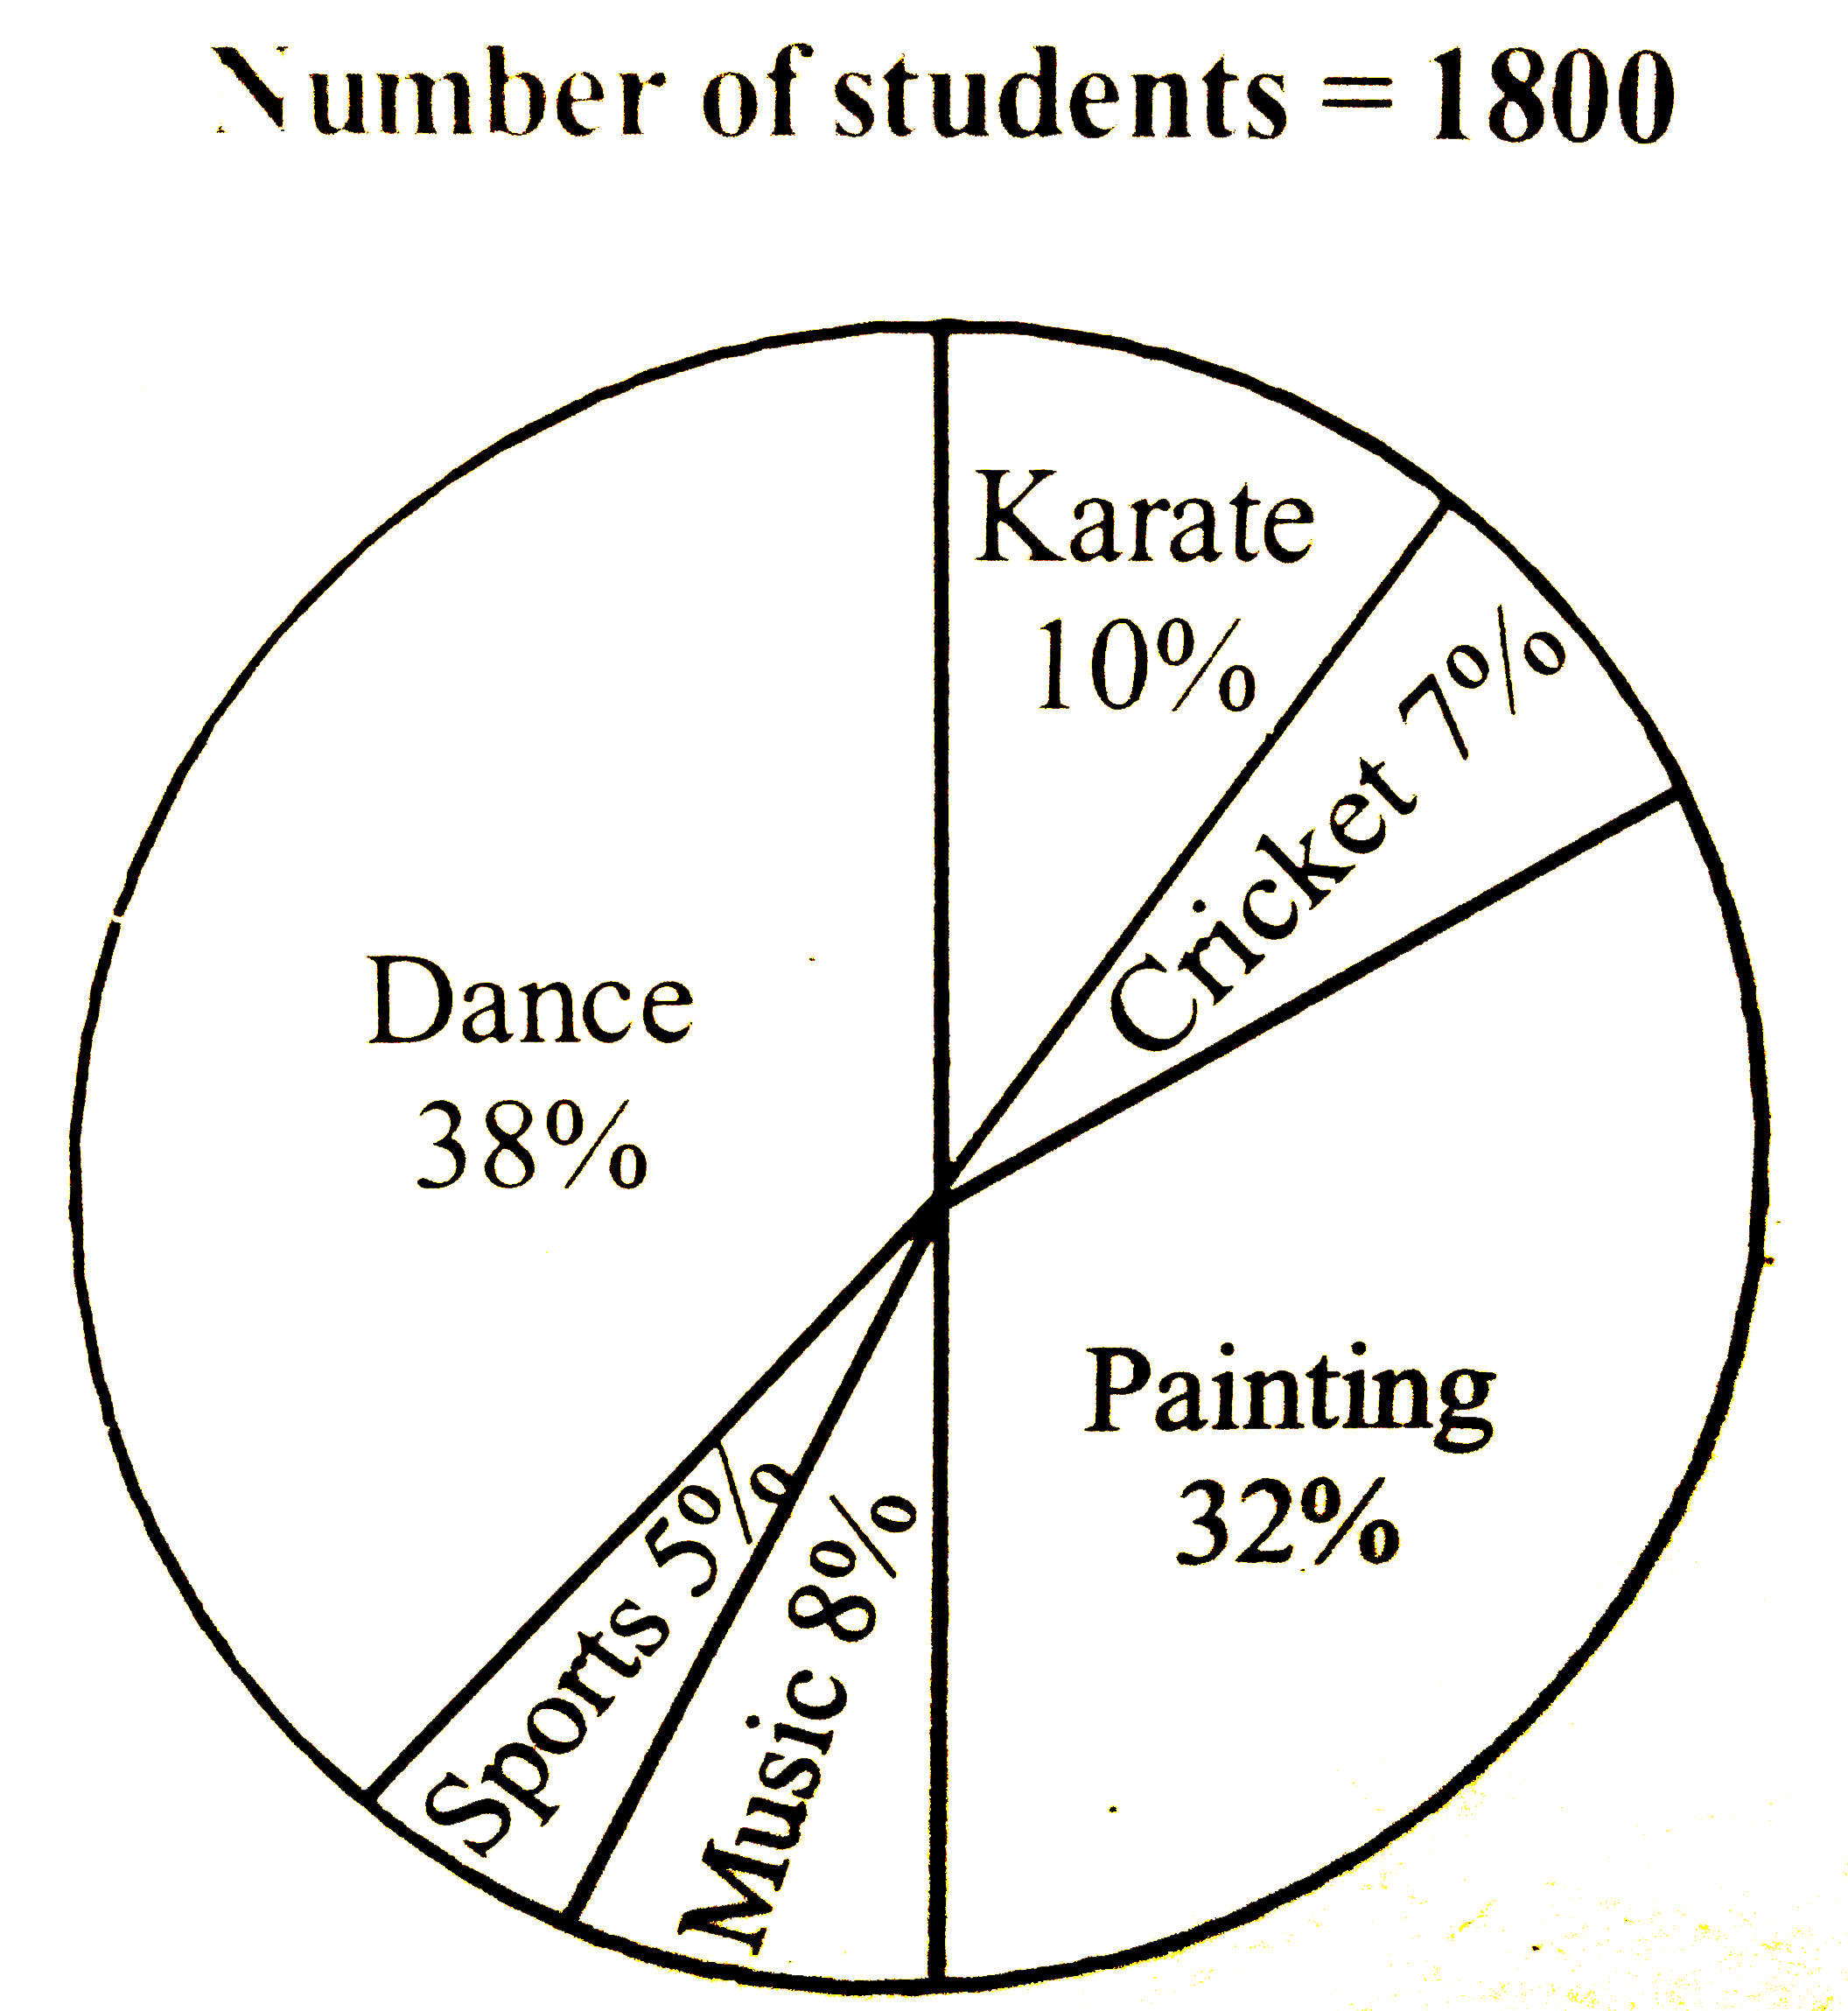
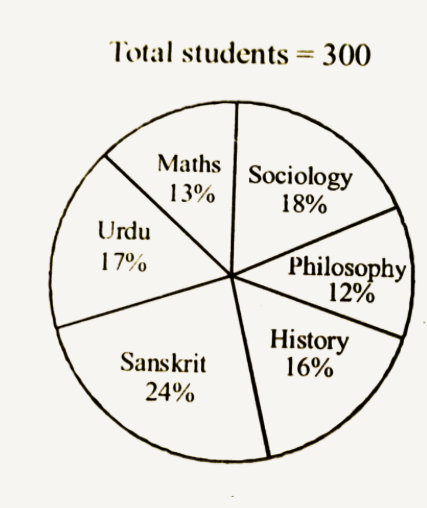
If in the pie chart representing the number of students opting for different streams of study out of a total strength of 1650 students , the central angle of the sector representing arts students is 48∘ then what is the number of students who opted for arts stream ?
220
240
275
320
The correct Answer is:A
Step by step video, text & image solution for If in the pie chart representing the number of students opting for different streams of study out of a total strength of 1650 students , the central angle of the sector representing arts students is 48^@ then what is the number of students who opted for arts stream ? by Maths experts to help you in doubts & scoring excellent marks in Class 8 exams.
Updated on:21/07/2023Topper's Solved these Questions
Similar Questions
Knowledge Check
In the pie chart representing the percentages of students having interest in reading various kinds of books, the central angle of the sector representing students reading novels is 81∘ .What is the percentage of students interested in reading novels ?
A15%B18%C2212%D2712%In the IGNOU (Indira Gandhi National Open University) there are total 16,000 students pursuing MBA, which offers the specialization only in Finance, HR and Marketing IGNOU accepts only Science, Commerce and Engineering Students for the two years course of MBA. The number of science. students is 166.66% of the Commerce students. Number of Engineering students is equal to the number of Science and Commerce students together. Each student can specialize in only one of the marketing , HR and Finance, 20% of Science students opted the Finance, which is 16.66% less than the no. of commerce students who opted Finance. The total Finance students is equal to 18% the total strength of the MBA students. 32% of Science students opted HR. Commerce students who opted HR is equal to 25% of total students specializing in Finance and Engineering students equal to 6.5% of the total strength of the MBA students opted HR.
The number of Engineering students who opted marketing is :A7850B7500C8850Dnone of theseThe pie-chart given below represents the number of students using different transport to a school in which total number of students is 2160.
Answer the questions based on the following diagram.
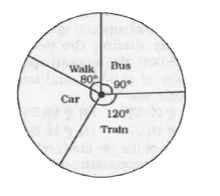
The ratio of the number of students who come to school by car to the number of students who come to school by bus isA21:24B21:27C36:27D36:21
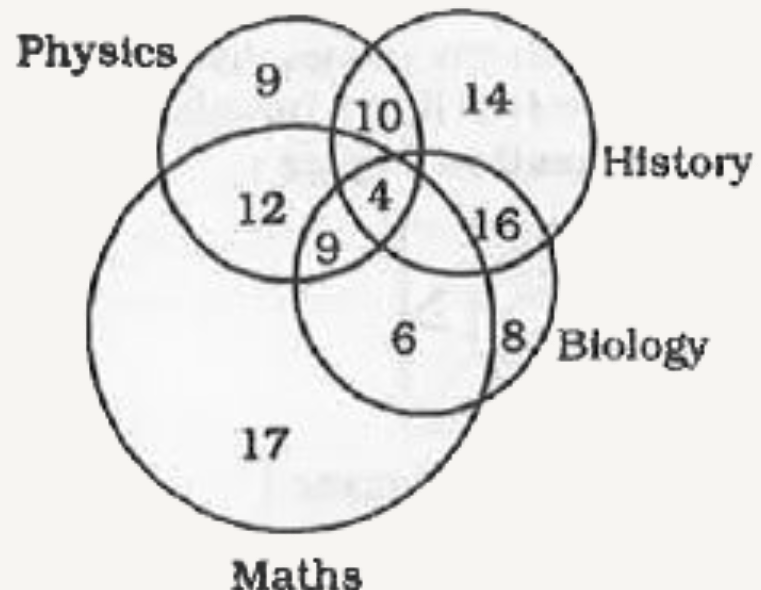
The diagram represents the number of students studying different subjects. What is the number of students who study History and Biology?
View SolutionThe pie chart given below shows the number of students in 6 different sections. The total number of students is 1800.
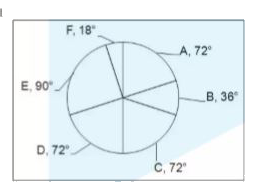
What is the total number of students in section E, C and F?
View SolutionThe pie chart given below sows the number of students in 6 different sections. The total number of students is 1800.
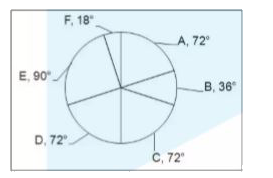
What is the average number of students in section A, B and F?
View SolutionIF the number of passed out students of all five college is represented by a pie chart. What is the central angle of the sector representing the passed out students of college C?
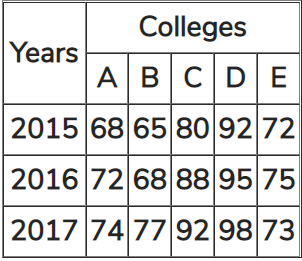
View SolutionThe pie-chart given below represents the number of students using different transport to a school in which total number of students is 2160.
Answer the questions based on the following diagram.
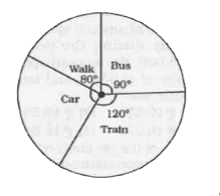
The number of students who come to school by car is
View Solution

