A man's monthly salary is Rs.24000 and his monthly expenses on travel are Rs.2500. The central angle of the sector representing travel expenses in the pie chart would be
The correct Answer is:B
To find the central angle of the sector representing travel expenses in a pie chart, we will follow these steps:
Step 1: Understand the Total Salary and Expenses
The man's monthly salary is Rs. 24,000, and his monthly expenses on travel are Rs. 2,500.
Step 2: Determine the Total Angle of the Circle
The total angle in a pie chart is 360 degrees.
Step 3: Calculate the Value of 1 Degree
To find out how much each degree represents in terms of salary, we can use the formula:
Value of 1 degree=Total SalaryTotal Angle=24000360
Step 4: Perform the Division
Now, we will calculate:
24000360=24000÷120360÷120=2003≈66.67
So, 1 degree of the circle represents approximately Rs. 66.67.
Step 5: Calculate the Central Angle for Travel Expenses
Now, we need to find out how many degrees correspond to the travel expenses of Rs. 2,500. We can use the formula:
Central Angle (θ)=(Travel ExpensesTotal Salary)×Total Angle
Substituting the values:
Central Angle (θ)=(250024000)×360
Step 6: Simplify the Calculation
Calculating the fraction:
250024000=25240=548
Now, substituting this back into the angle calculation:
Central Angle (θ)=(548)×360
Step 7: Perform the Multiplication
Calculating:
Central Angle (θ)=5×36048=180048
Now simplifying:
1800÷1248÷12=1504=37.5
Final Answer
Thus, the central angle of the sector representing travel expenses in the pie chart is 37.5 degrees.
---
The man's monthly salary is Rs. 24,000, and his monthly expenses on travel are Rs. 2,500.
The total angle in a pie chart is 360 degrees.
To find out how much each degree represents in terms of salary, we can use the formula:
Value of 1 degree=Total SalaryTotal Angle=24000360
Now, we will calculate:
24000360=24000÷120360÷120=2003≈66.67
So, 1 degree of the circle represents approximately Rs. 66.67.
Now, we need to find out how many degrees correspond to the travel expenses of Rs. 2,500. We can use the formula:
Central Angle (θ)=(Travel ExpensesTotal Salary)×Total Angle
Substituting the values:
Central Angle (θ)=(250024000)×360
Calculating the fraction:
250024000=25240=548
Now, substituting this back into the angle calculation:
Central Angle (θ)=(548)×360
Calculating:
Central Angle (θ)=5×36048=180048
Now simplifying:
1800÷1248÷12=1504=37.5
Thus, the central angle of the sector representing travel expenses in the pie chart is 37.5 degrees.
Topper's Solved these Questions
Similar Questions
A man's monthly salary is Rs. 2400 and his monthly expenses on travel are Rs. 250. The central angle of the sector representing travel expenses in the pie chart would be
View SolutionMonthly salary of a person is Rs. 15000. Then the amount he spends on food and house rent given the central angle of the sector representing this is 60∘.
View Solution
Knowledge Check
If 35% of the people residing in a locality are Sikhs then the central angle of the sector representing the Sikh community in the pie chart would be
A108∘B115∘C126∘D135∘The following pie chart shows percentage expenditure of a country on different heads .The total expenditure is Rs. 1,680 (in billions).Study the chart and answer the question.
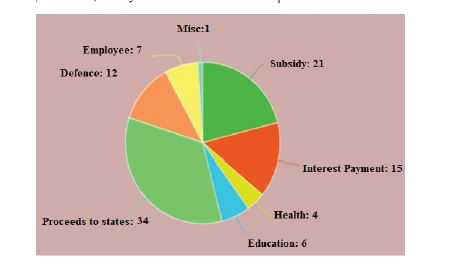
The central angle of the sector representing expenditure on Subsidy is :A75.6∘B108.3∘C90∘D54.9∘IF the data of the total students college wise, is represented by a pie chart, what is the central angle of the sector representing college E.
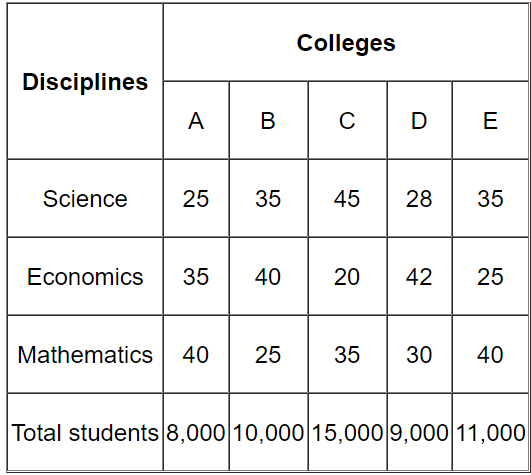 A78∘B75∘C79∘D73∘
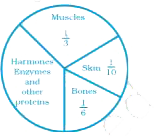
What is the central angle of the sector in the pie chart representing skin and bones together?
View SolutionThis question is to be answered on the basis of the pie chart given below showing how a person's monthly salary is distributed over different expanse heads
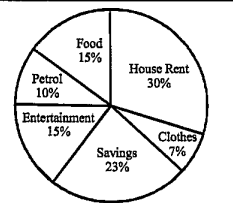
The angle made at the centre of the pie chart by the sector representing the expanse on petrol is
View SolutionThe table shows the production of different types of cars (in thousands).
यह तालिका एक कंपनी द्वारा 5 वर्षों में अलग-अलग कारों के उत्पादन (हज़ार में ) को दर्शाती है | If the data related to the production of type D cars is represented by a pie chart, then the central angle of the sector representing the production of
cars in 2013 will be:
यदि D प्रकार की कारों के उत्पादन से संबंधित आंकड़ों को एक पाई-चार्ट में प्रस्तुत किया जाए, तो 2013 में कारों के उत्पादन को दर्शाने वाले खंड का केंद्रीय कोण होगा :
View SolutionThe table shows the production of different types of cars (in thousands).
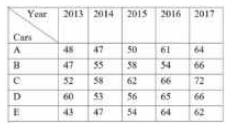
If the data related to the production of type D cars is represented by a pie chart, then the central angle of the sector representing the production of cars in 2016 will be:
View SolutionIf the monthly expenditure pattern of a person who earns a monthly salary of Rs. 15,000 is represented in a pie graph, then the sector angle of an item on transport expenses measures 15∘. What is his monthly expenditure on transport ?
View Solution