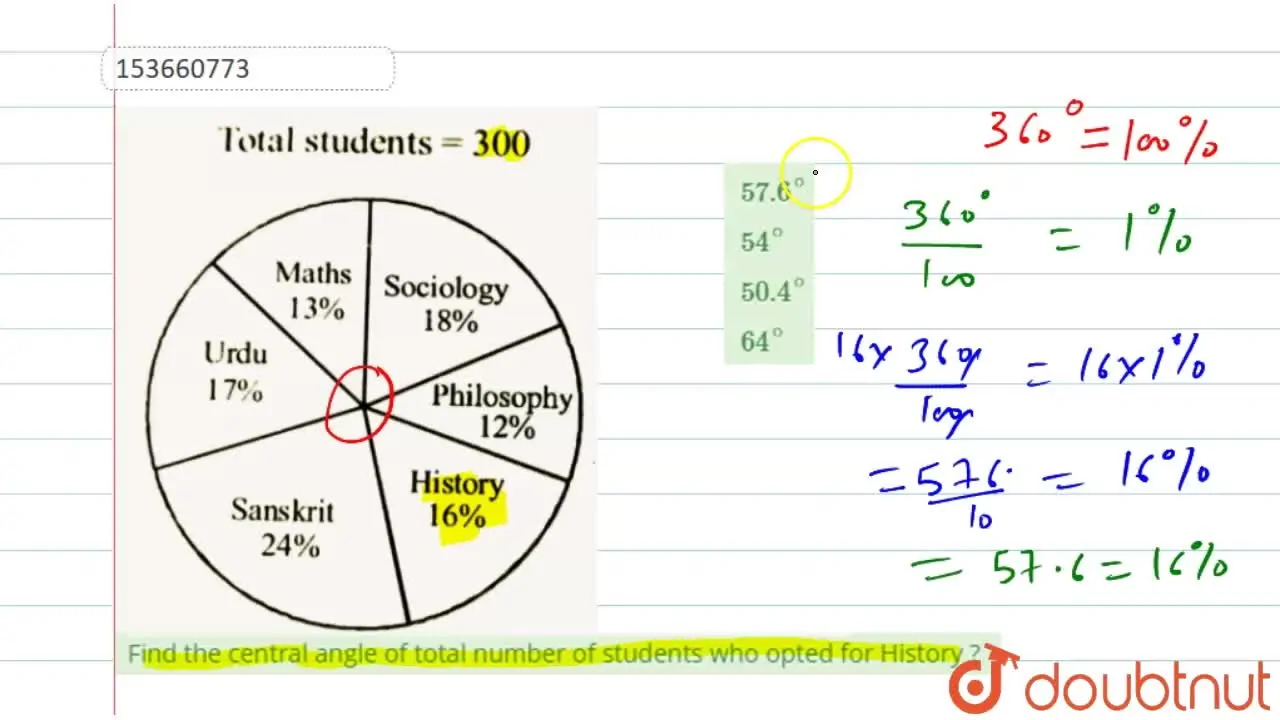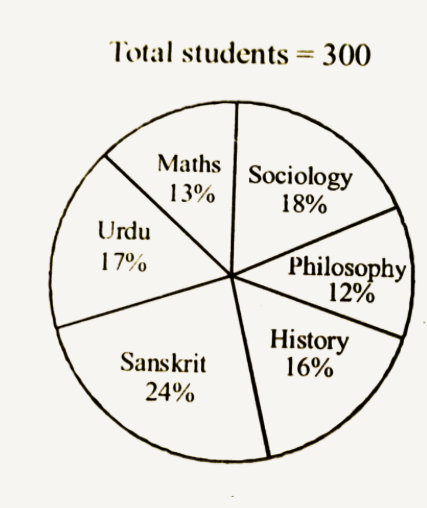
Find the central angle of total number of students who opted for History ?
57.6∘
54∘
50.4∘
64∘
Total number of student who gave exam in Feb. 2018=300×120100=360
Related Playlists
Similar Questions
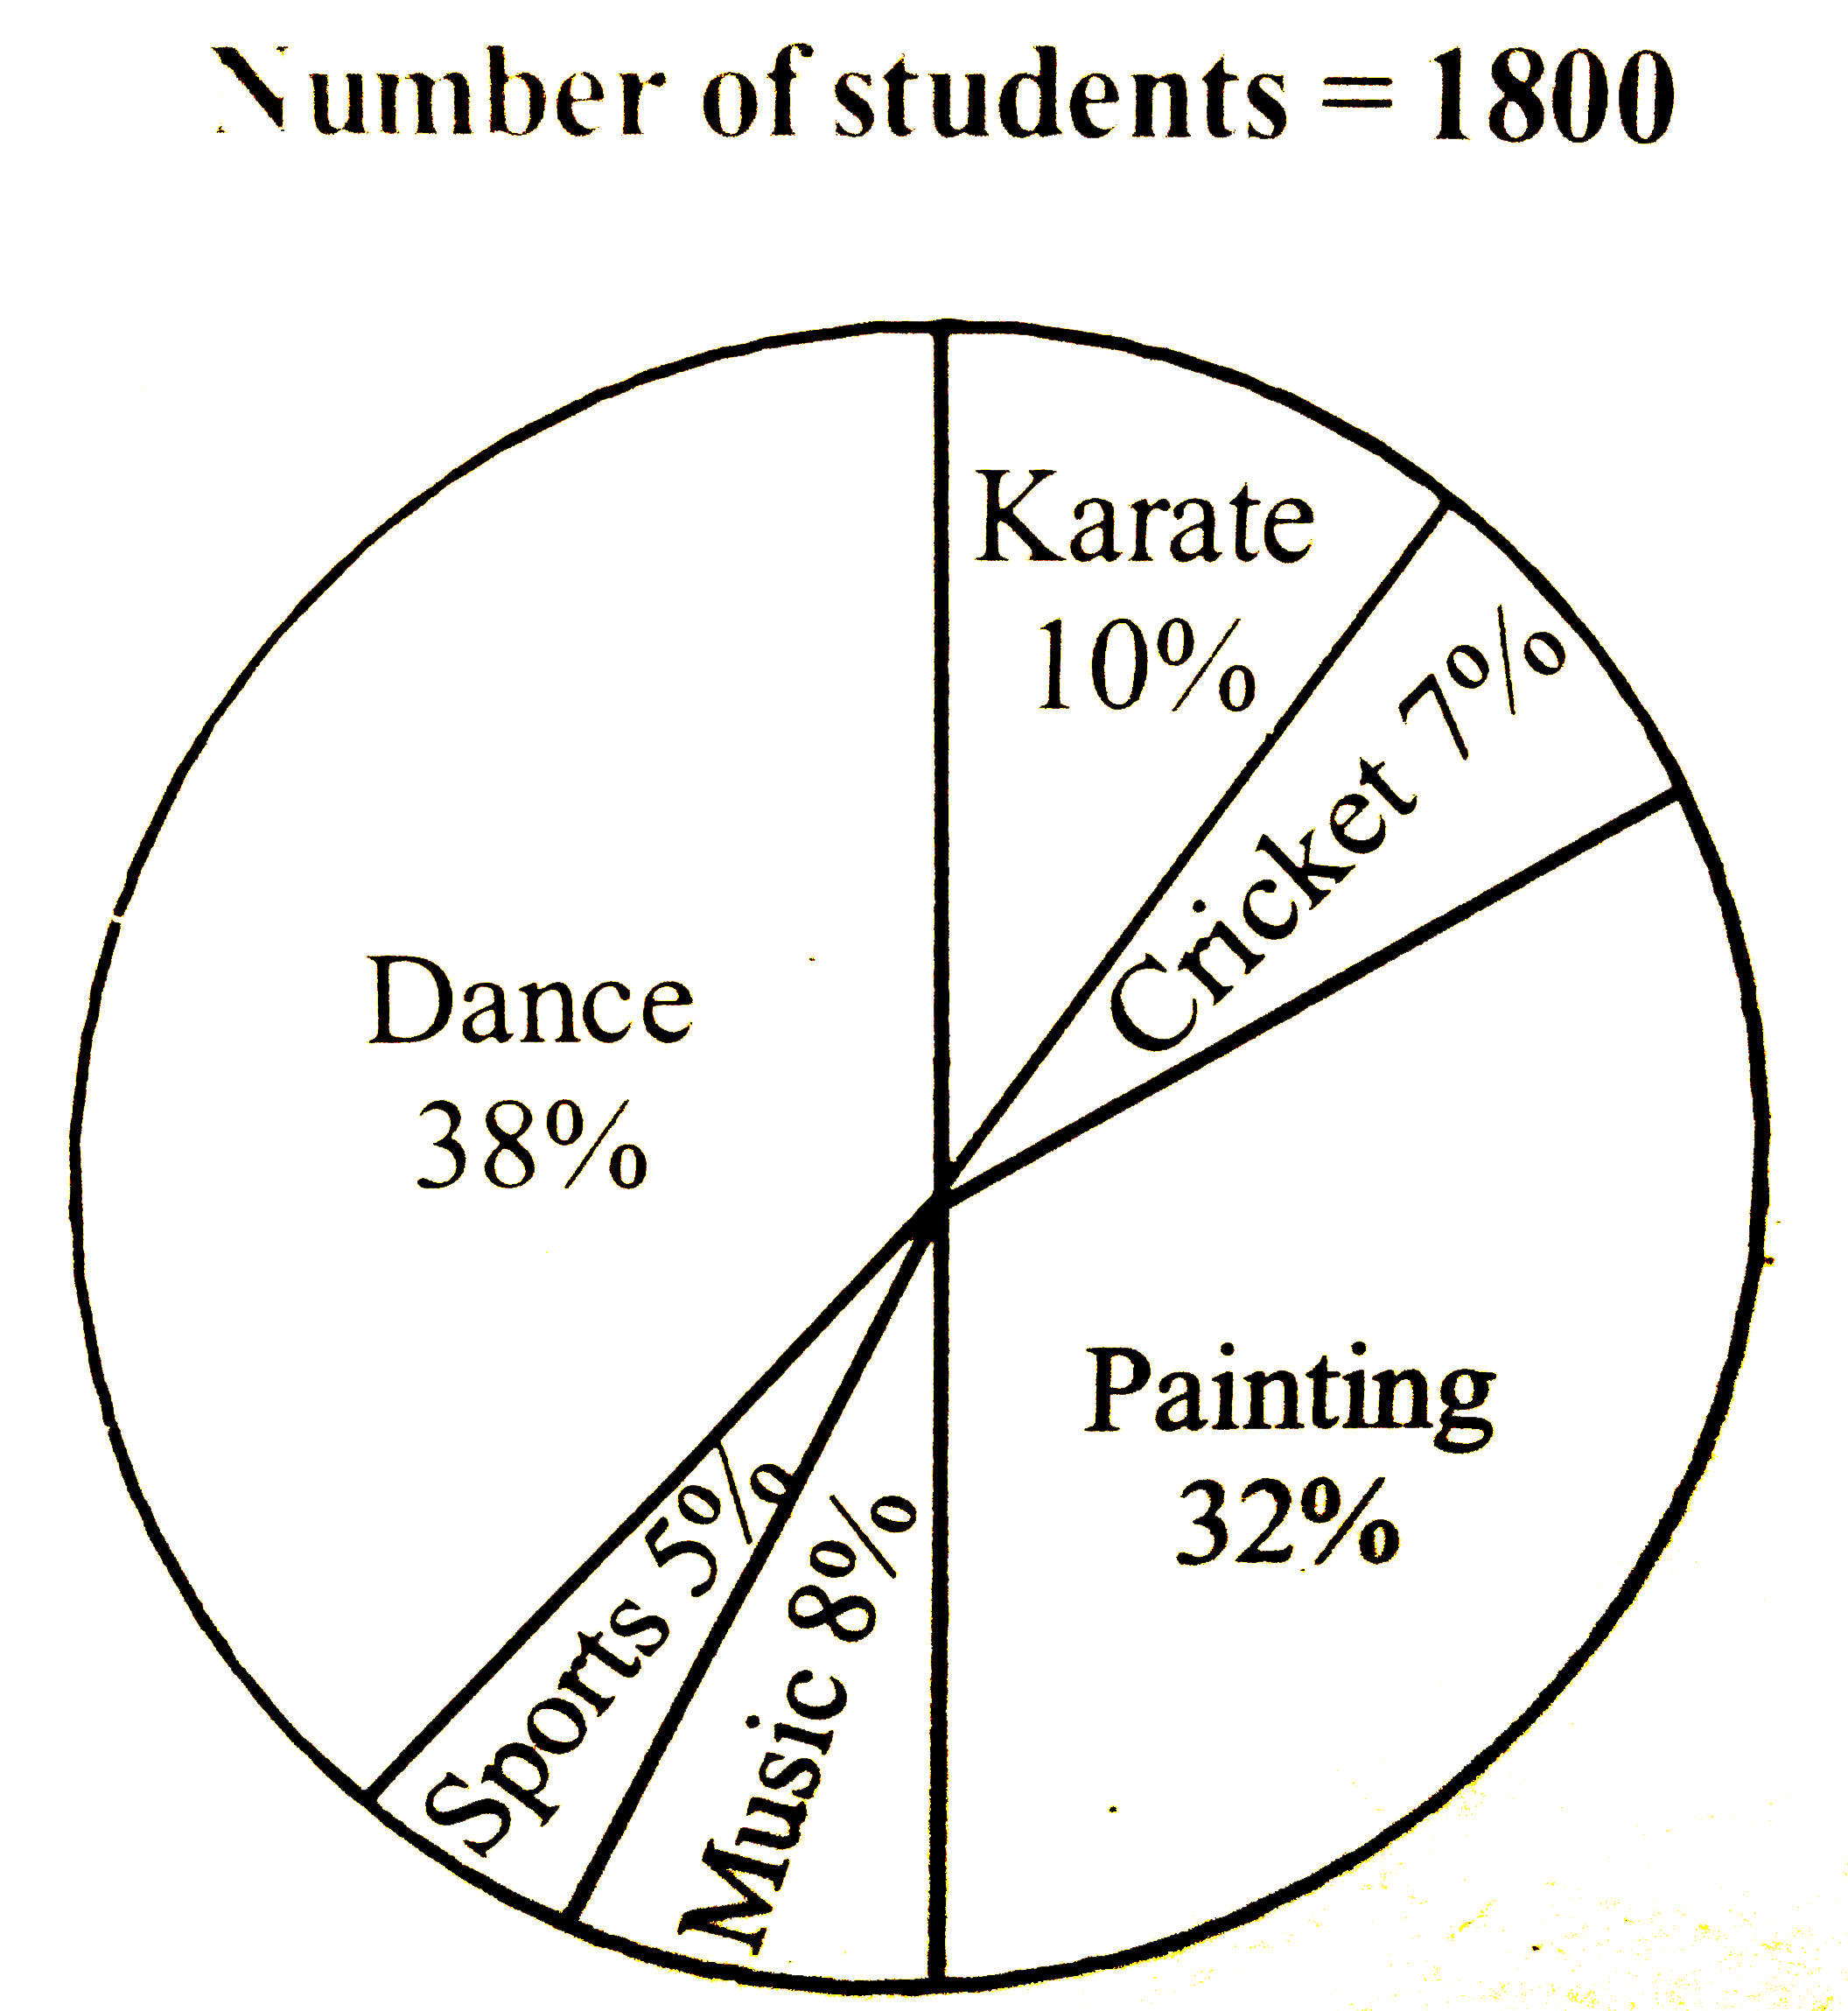
What is the number of students who opted for dancing ?View Solution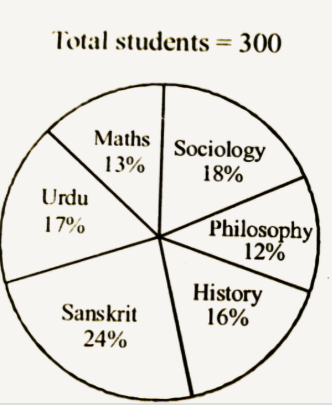
Find the ratio between total number of students who opted for Urdu, Histry and Sociogy together to total number of students who opted for Maths, Urdu and Sanskrit together ?View Solution
Total number of students who opted fo Sociologyy and Philosophy together is how much less than total number of students wo opted for Sanskrit and History together ?View SolutionStudy the following graph and answer the questions given below :
No. of students (in thousands) who opted for three different specializations during the given five years in a University
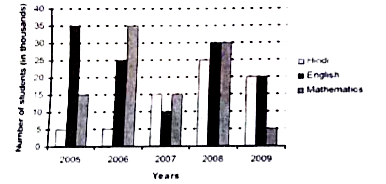
What is the total number of students who opted for Hindi and who opted for Mathematics in the years 2006, 2007 and 2009 together ?View SolutionStudy the following graph and answer the questions given below :
No. of students (in thousands) who opted for three different specializations during the given five years in a University
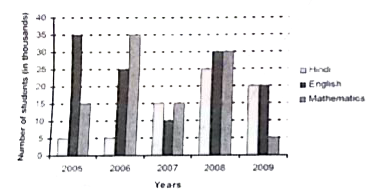
The total number of students who opted for Mathematics in the years 2005 and 2008 together are approximately what percent of the total number of students who opted for all three subjects in the same years ?View SolutionStudy the following graph and answer the questions given below :
No. of students (in thousands) who opted for three different specializations during the given five years in a University
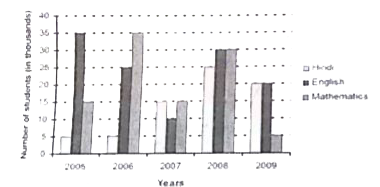
Out of the total number of students who opted for the given three subjects, in the year 2009, 38% were girls. How many boys opted for Mathematics in the same year ?View Solution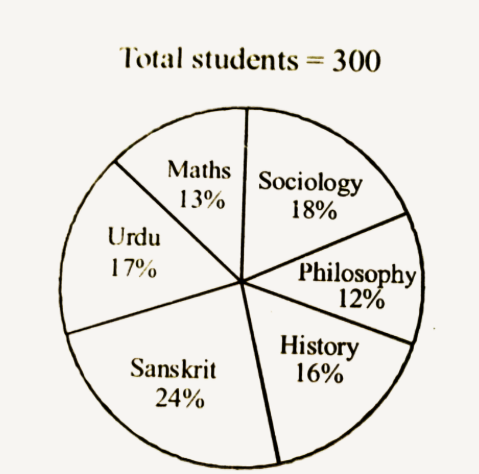
Find the average number of students who opted for Maths, Sociology and Sanskrit together ?View SolutionStudy the following graph and answer the questions given below :
No. of students (in thousands) who opted for three different specializations during the given five years in a University
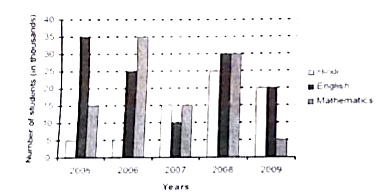
If the total number of students in the University in the year 2007 was 455030, then the total number of students who opted for the given three subjects were approximately what percent of the total students ?View SolutionIf in the pie chart representing the number of students opting for different streams of study out of a total strength of 1650 students , the central angle of the sector representing arts students is 48∘ then what is the number of students who opted for arts stream ?
View SolutionOut of 1800 students in a school, 750 opted basketball, 800 opted cricket and remaining opted table tennis. If a student can opt only one game, find the ratio of(a) Number of students who opted basketball to the number of students who opted table tennis.(b) Number of students who opted cricket to the number of students optingbasketball.(c) Number of students who opted basketball to the total number of students.
View Solution

