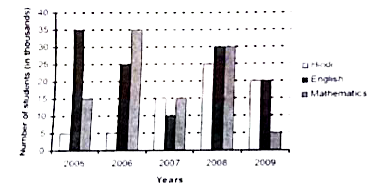
Study the following graph and answer the questions given below :
No. of students (in thousands) who opted for three different specializations during the given five years in a University
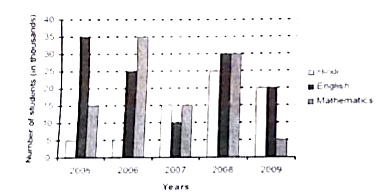
If the total number of students in the University in the year 2007 was 455030, then the total number of students who opted for the given three subjects were approximately what percent of the total students ?
19
9
12
5
The correct Answer is:A
Step by step video, text & image solution for Study the following graph and answer the questions given below : No. of students (in thousands) who opted for three different specializations during the given five years in a University If the total number of students in the University in the year 2007 was 455030, then the total number of students who opted for the given three subjects were approximately what percent of the total students ? by Maths experts to help you in doubts & scoring excellent marks in Class 14 exams.
Topper's Solved these Questions
Similar Questions
Knowledge Check
- Question 1 - Select One
Study the following graph and answer the questions given below :
No. of students (in thousands) who opted for three different specializations during the given five years in a University
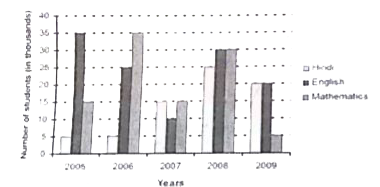
Out of the total number of students who opted for the given three subjects, in the year 2009, 38% were girls. How many boys opted for Mathematics in the same year ?A1322B1332C1312DNone of these - Question 2 - Select One
Study the following graph and answer the questions given below :
No. of students (in thousands) who opted for three different specializations during the given five years in a University
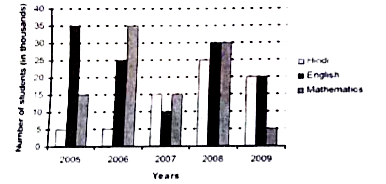
What is the total number of students who opted for Hindi and who opted for Mathematics in the years 2006, 2007 and 2009 together ?A97000B93000C85000D95000 - Question 3 - Select One
Study the following graph and answer the questions given below :
No. of students (in thousands) who opted for three different specializations during the given five years in a University
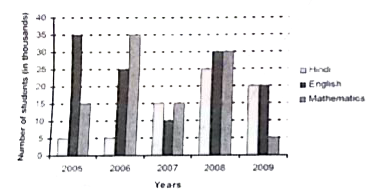
The total number of students who opted for Mathematics in the years 2005 and 2008 together are approximately what percent of the total number of students who opted for all three subjects in the same years ?A38B28C42D32
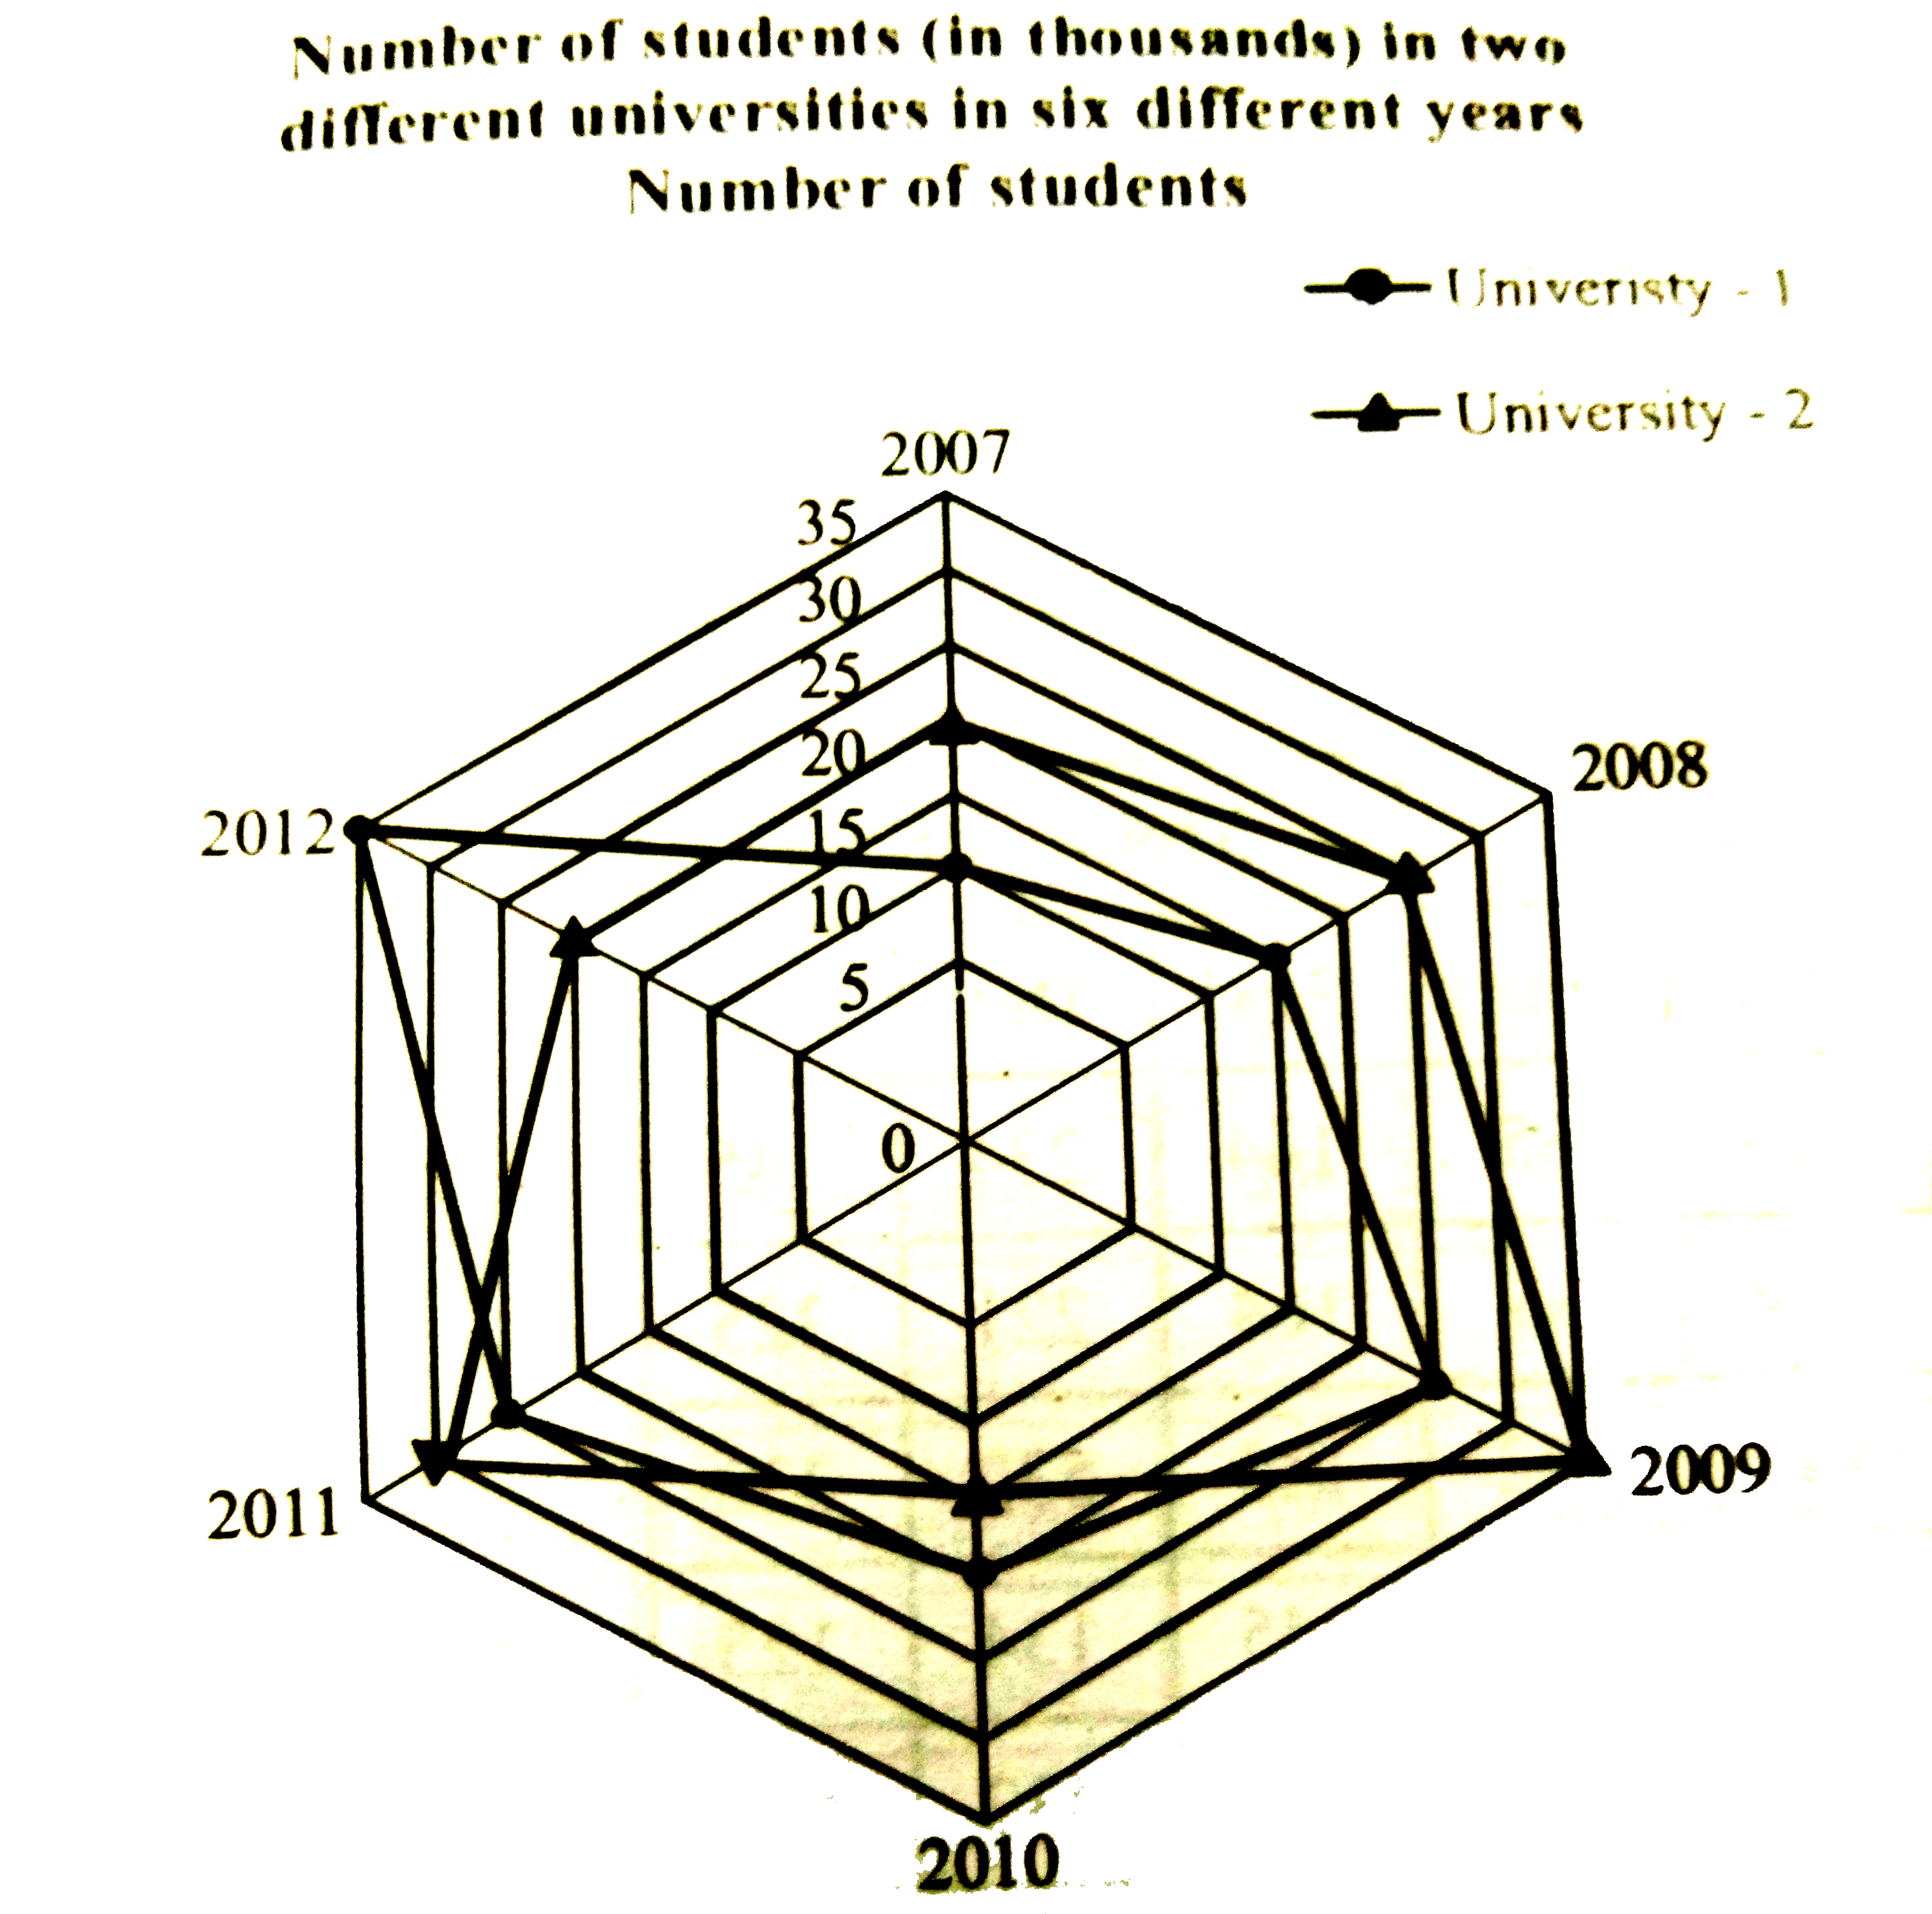
What is the sum of the number of students in university-1 in the year 2007 and the number of students in university-2 in the year 2011 together ?View Solution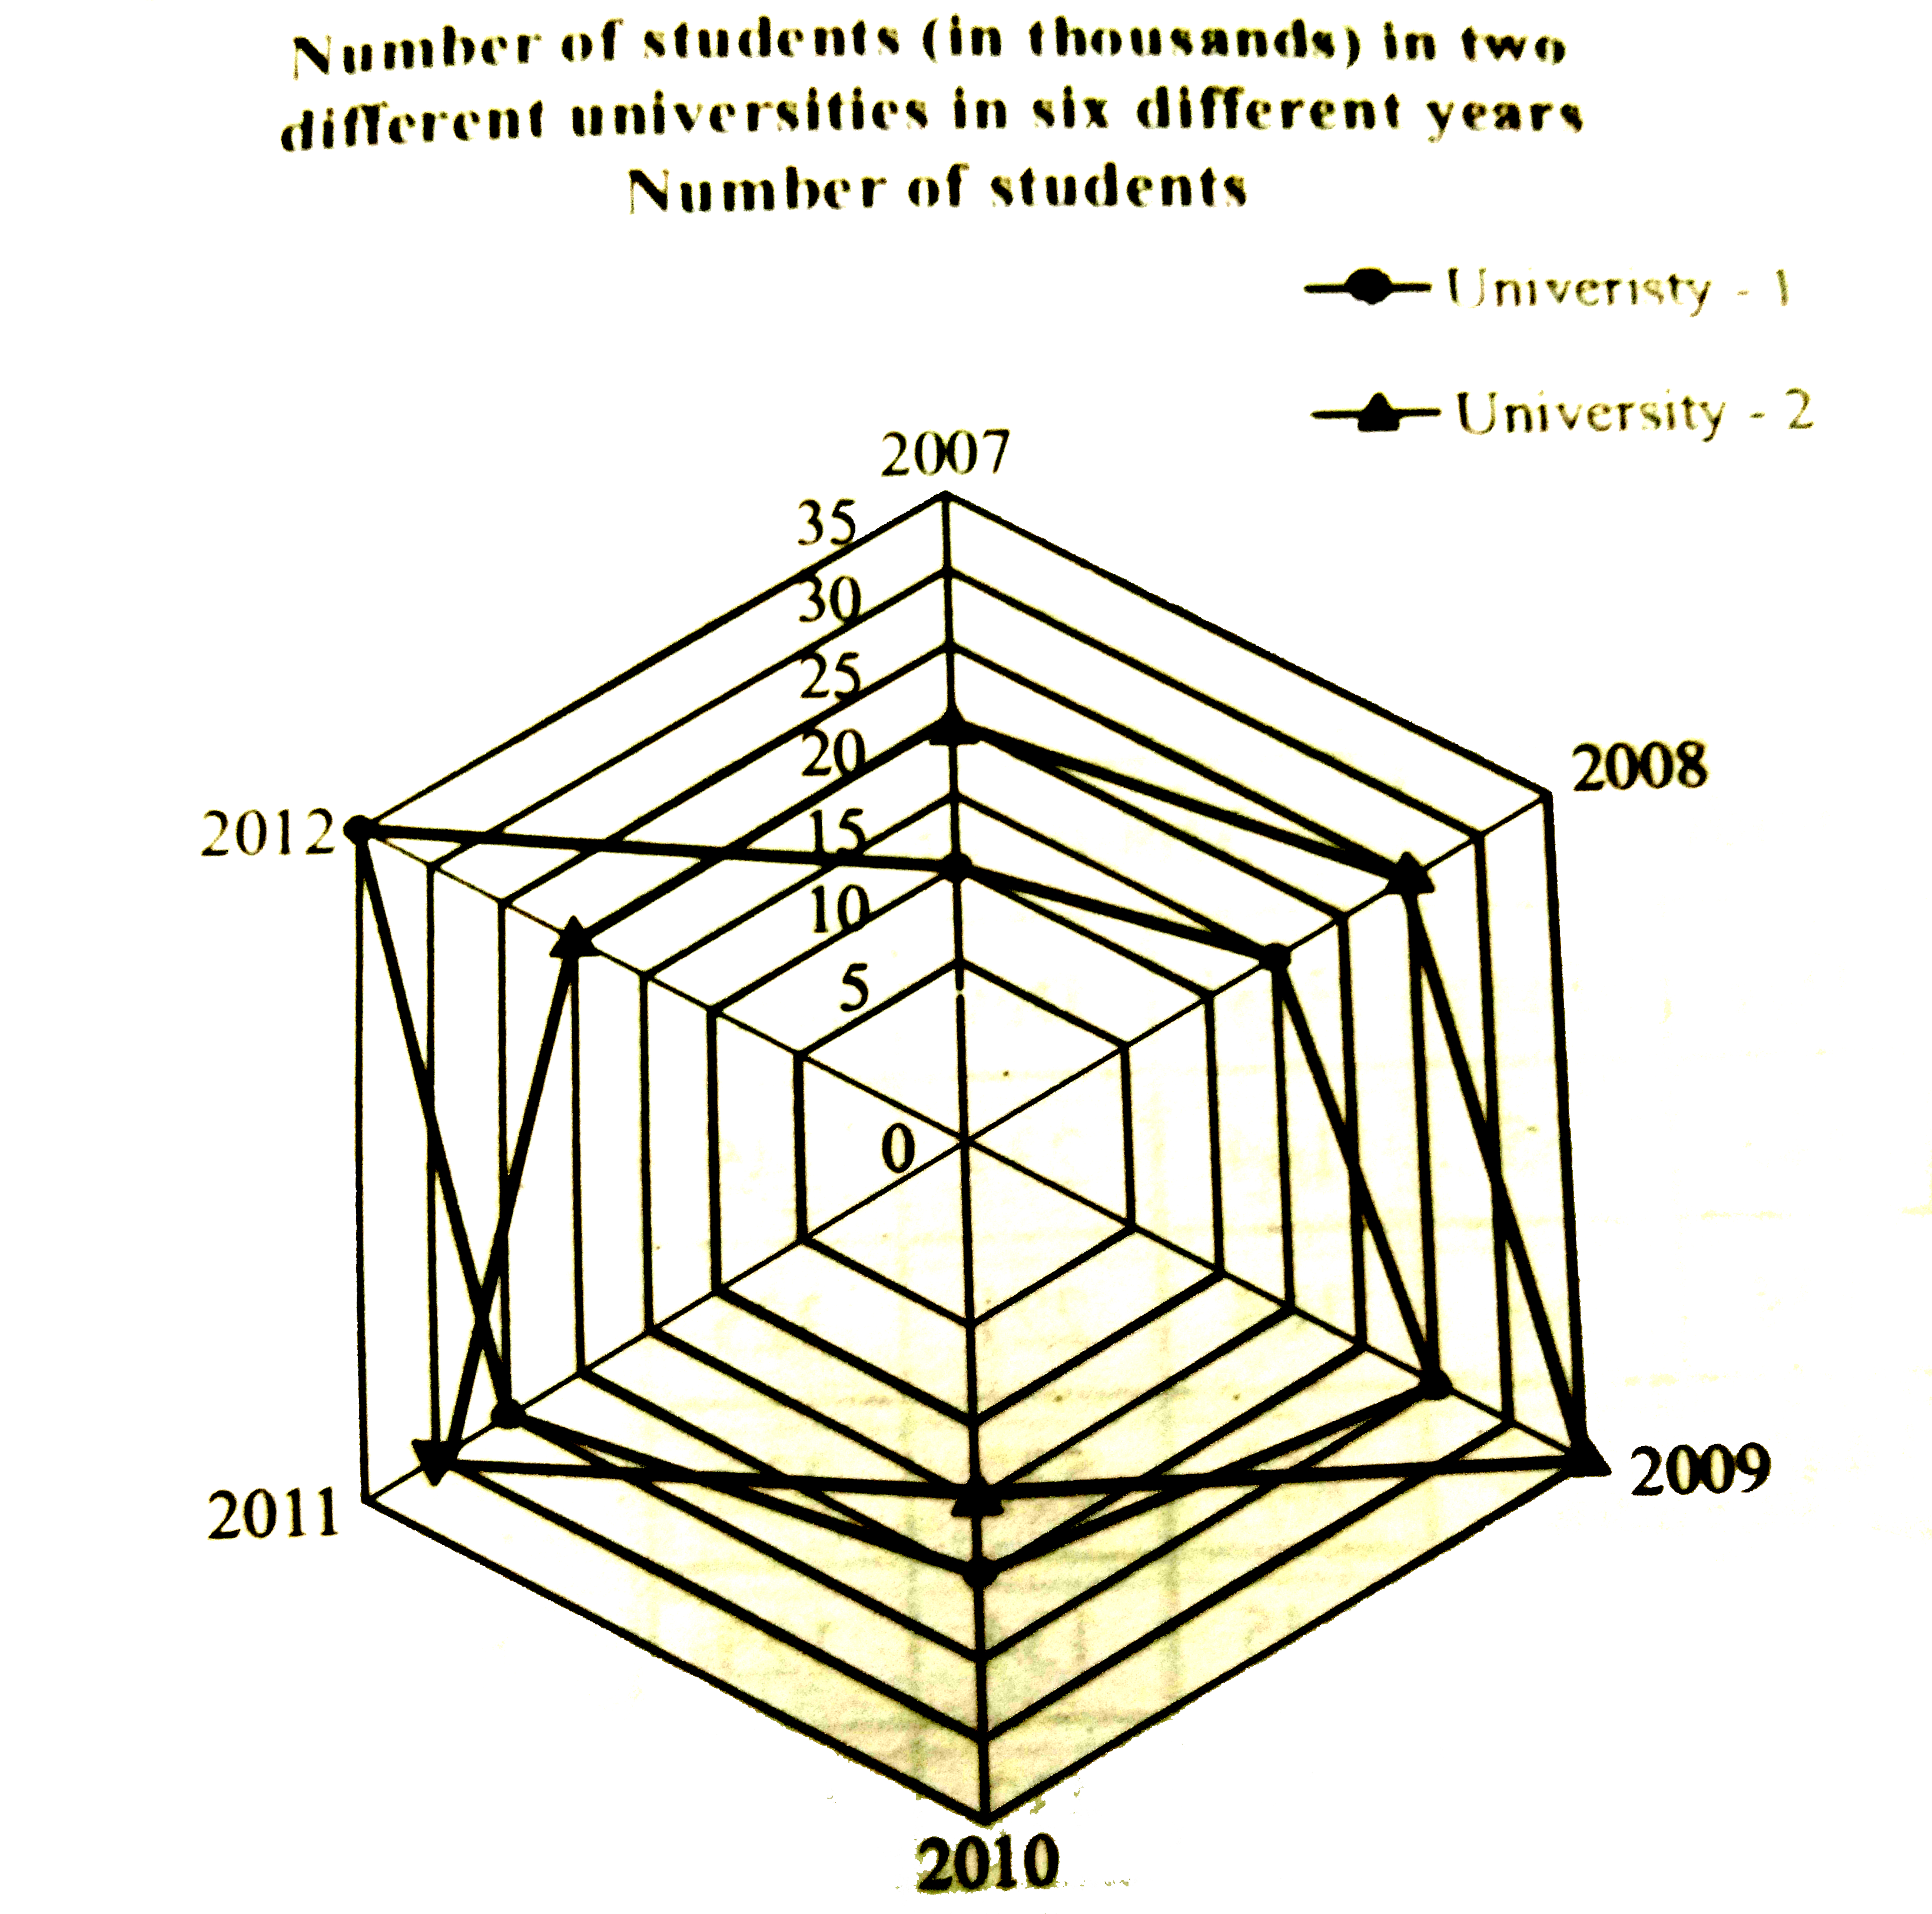
What was the difference between the number of students in university-1 in the year 2010 and the number of students in university-2 in the year 2012 ?View SolutionStudy the following graph and answer the questions given below :
No. of students (in thousands) who opted for three different specializations during the given five years in a University
What is the respective ratio between the number of students who opted for English in the years 2006 and 2008 together and the number of students who opted for Hindi in the year 2005 and 2009 together ?View SolutionStudy the following graph carefully and answer the questions given below :
Number of students studying in different University in a year (Number in lakhs)
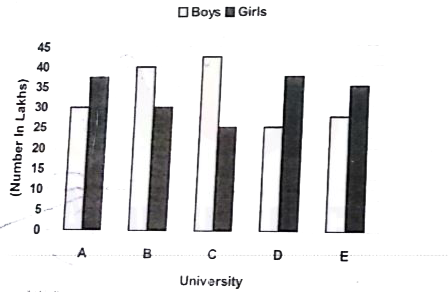
What is the total number of students (Boys & Girls) in university A and C together ?View SolutionStudy the following graph carefully and answer the questions given below :
Number of students studying in different University in a year (Number in lakhs)
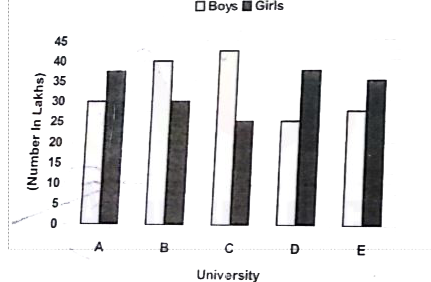
If the total number of girls in university E increases by 50%. What would be the total number of students (Boys & Girls together) in that university ?View Solution

