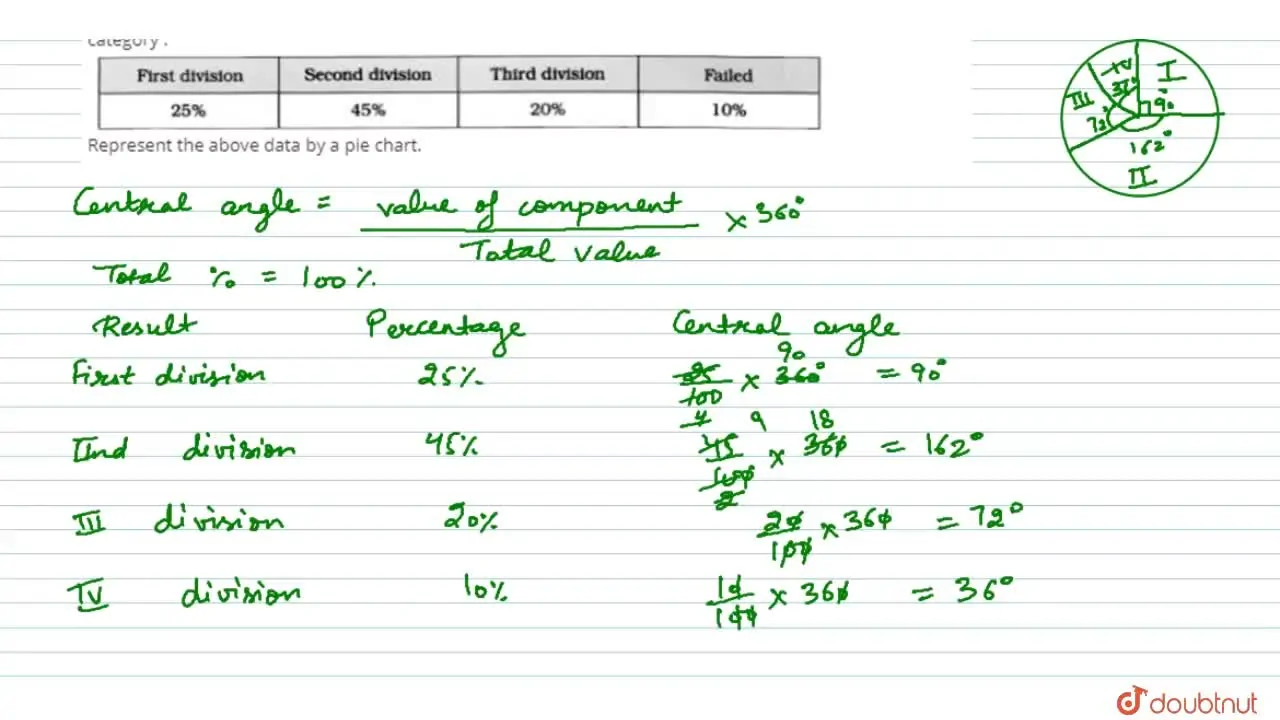
Given below is the result of an annual examination of a class, showing the percentage of students in each category .

Represent the above data by a pie chart.
Step by step video & image solution for Given below is the result of an annual examination of a class, showing the percentage of students in each category . Represent the above data by a pie chart. by Maths experts to help you in doubts & scoring excellent marks in Class 8 exams.
Related Playlists
- BOOK - RS AGGARWALCHAPTER - PIE CHARTS EXERCISE - Exercise 24B4videos
PIE CHARTS
- BOOK - RS AGGARWALCHAPTER - PIE CHARTS EXERCISE - Exercise 24B4videos
PIE CHARTS
- BOOK - RS AGGARWALCHAPTER - PERCENTAGEEXERCISE - TEST PAPER -9 ( TRUE AND FALSE )4videos
PERCENTAGE
- BOOK - RS AGGARWALCHAPTER - PLAYING WITH NUMBERSEXERCISE - Test Paper-511videos
PLAYING WITH NUMBERS
Similar Questions
The following table shows the percentage of buyers of four different brands of bathing soaps.

Represent the above data by a pie chart.View SolutionThe following table shows the expenditure of a family whose monthly income is * 22,000.Represent the above data by a pie chart.
View SolutionIn a school, there are five sections of Class VI. The number of students in each section is given below:

Represent the above data using a bar graph.View SolutionDraw a pictograph for representing the number of students in each class based on the given data.
 View Solution
The table shows the marks Porpu obtained in an Examination.Subject Math Science English Hindi. Science Computer. Represent the above data by a pie chart.97
View SolutionThe following table shows the results of the students who have attended an examination . What percentage of students passed
 View Solution
The marks obtained by a student in an examination are given below :

Represent the data using a pie diagram.View SolutionThe following pie chart shows the performance in an examination in a particular year for 360 students. The percentage of students who have failed in the examination is
 View Solution
The marks obtained by a student in an examination are given below:

Represent the data using pie diagramView SolutionThe marks obtained by a student in an examination are given below:

Represent the data using pie diagram.View Solution


