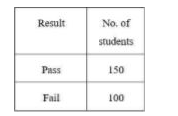
The following table shows the results of the students who have attended an examination . What percentage of students passed

0.3
0.4
0.6
0.5
The correct Answer is:C
Step by step video, text & image solution for The following table shows the results of the students who have attended an examination . What percentage of students passed by Maths experts to help you in doubts & scoring excellent marks in Class 14 exams.
Updated on:21/07/2023Similar Questions
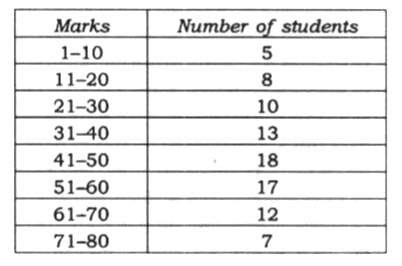
The following table shows the marks of 90 students in a test of 80 marks :

The percentage of students who have obtained less than or equal to 50% marks is
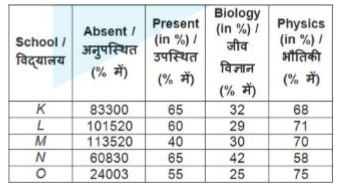
View SolutionThe table given below shows the number of students who were absent and percentage of students who were present in the given two examinations from five different schools. The table also shows the percentage of students who were present in the Biology and Physics examination respectively.

If the number of students who were present in the Physics examination from school A is 250% of the difference of the number of the students who were present in Physics and bilogy examination, from school K, then what is the ratio of the number of students who were present from school L to number of students who were present in Physics examination from school A?
View Solution
Knowledge Check
The following table shows the number of students enrolled in different faculties in college.

The percentage of students studying in faculties other than Science is:A75%B80%C60%D20%In a class of 135 students, the number of boys is twice that of girls. One-sixth of the boys and one third of the girls faild in the final examination . Find the percentage of students who passed the examination .
A75%B71.45%C77.78%D81.23%
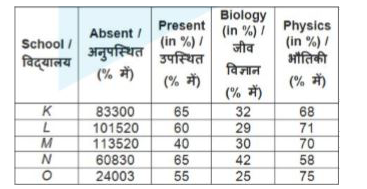
The table given below shows the number of students who were absent and percentage of students who were present in the given two examinations from five different schools. The table shows the percentage of students who were present in the Biology and Physics examination respectively.

If the number of students who were present in the Physics examination from school A is 250% of the difference of the number of the students who were present in Physics and Biology examination, from school K, then what is the ratio of the number of students who were present from school L to number of students who were present in Physics examination from school A?
View SolutionThe table given below shows the number of students who were absent and percentage of students who were present in the given two examinations from five different schools. The table also shows the percentage of students who were present in the Biology and Physics examination respectively.

The number of students who were present in Physics examination from school M is what per cent of number of students who were absent from schools M, L and O?
View SolutionThe table given below shows the number of students who were absent and percentage of students who were present in the given two examinations from five different schools. The table also shows the percentage of students who were present in the Biology and Physics examination respectively.

What is the average of the number of the students who were of the students who were present in Physics examination from schools N. K and L?
View SolutionThe table given below shows the number of students who were absent and percentage of students who were present in the given two examinations from five different schools. The table also shows the percentage of students who were present in the Biology and Physics examination respectively.

What is the difference between the number of students who were present in Physics and that in Biology examination from school N?
View SolutionThe table given below shows the number of students who were absent and percentage of students who were present in the given two examinations from five different schools. The table also shows the percentage of students who were present in the Biology. And Physics examination respectively.
 What is the average of the number of the students who were present in Physics examination from school N, K and L?
View SolutionThe following piechart shows the number of students who failed in different subjects in an examination. Examine the chart and answer the questions 5 to the total number of students who have failed is 500.

Number of students who failed in Mathema tics is less than the students who did not qualify in language is -
View Solution
