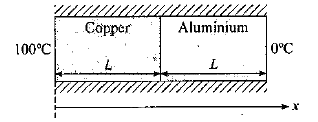
A composite rod of uniform cross-section has copper and aluminium sections of the same length in good thermal contact. The ends of the rod, which is well-lagged, are maintained at 100∘C and at0∘C as shown in the diagram (Figure-4.33). The thermal conductivityof copper is twice that of aluminium.
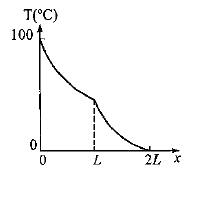
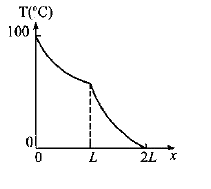
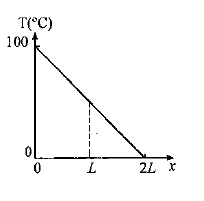
Which one of the following graphs represents the variation of temperature T with x along the rod in the steady state ?
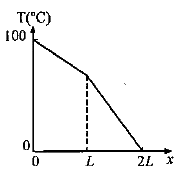
The correct Answer is:D
In steady state ofcondution, temperature gradient is constant but different in the two rods as their thermal conductivities are differenthence option (D) is correct.
Topper's Solved these Questions
- HEAT TRANSFER BOOK - PHYSICS GALAXY - ASHISH ARORACHAPTER - HEAT TRANSFER EXERCISE - Numerical MCQs Single Options Correct
94 Videos
- HEAT TRANSFER BOOK - PHYSICS GALAXY - ASHISH ARORACHAPTER - HEAT TRANSFER EXERCISE - Advance MCQs with One or More Option Correct
20 Videos
- HEAT TRANSFER BOOK - PHYSICS GALAXY - ASHISH ARORACHAPTER - HEAT TRANSFER EXERCISE - Discussion Question
26 Videos
- HEAT AND THERMAL EXPANSIONBOOK - PHYSICS GALAXY - ASHISH ARORACHAPTER - HEAT AND THERMAL EXPANSIONEXERCISE - UNSOLVED NUMRICAL PROBLEMS FOR PREPARATION OF NSEP, INPhO & IPhO
82 Videos
- Kinetic Theory of Gases and Gas LawsBOOK - PHYSICS GALAXY - ASHISH ARORACHAPTER - Kinetic Theory of Gases and Gas LawsEXERCISE - Unsolved Numerical Problems for Preparation of NSEP, INPhO & IPhO
64 Videos
Similar Questions
" A metal rod of area of cross section A has length L and coefficient of thermal conductivity K The thermal resistance of the rod is "
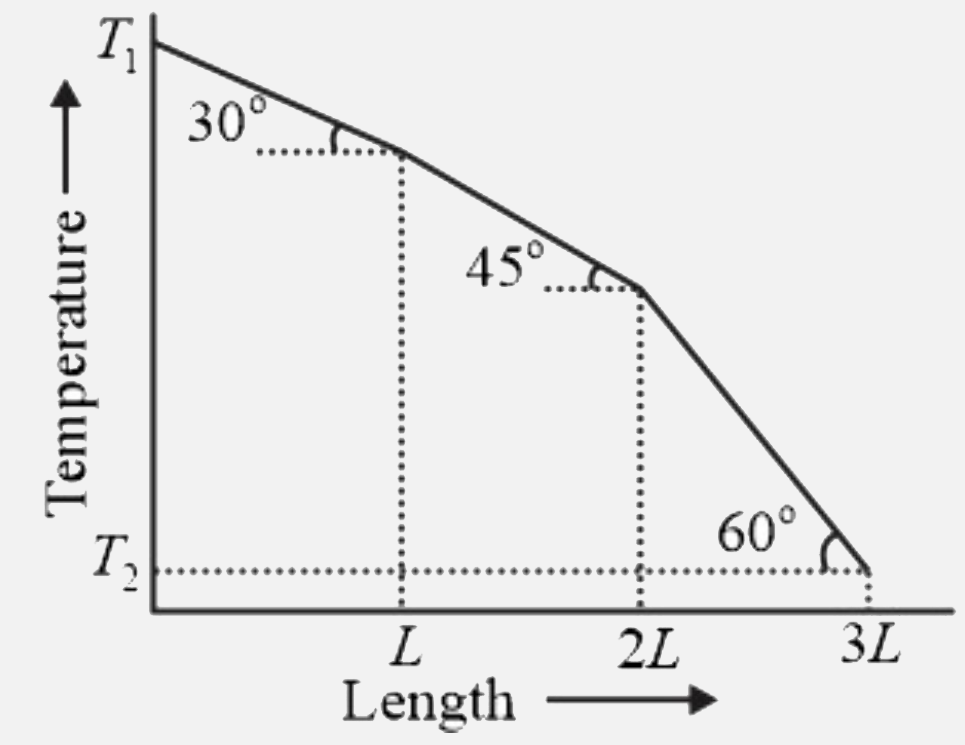
View SolutionThree rods of the same length and the same area of the cross-section are joined. The temperature of two ends one T1 and T2 as shown in the figure.
 As we move along the rod the variation of temperature are as shown in the following [Rods are insulated from the surrounding except at the faces]
View Solution
Knowledge Check
The ends of copper rod of length 1m and area of cross section 1cm2 are maintained at 0∘C and 100∘C. At the centre of rod, there is a source of heat of 32W. The thermal conductivity of copper is 400W/mK
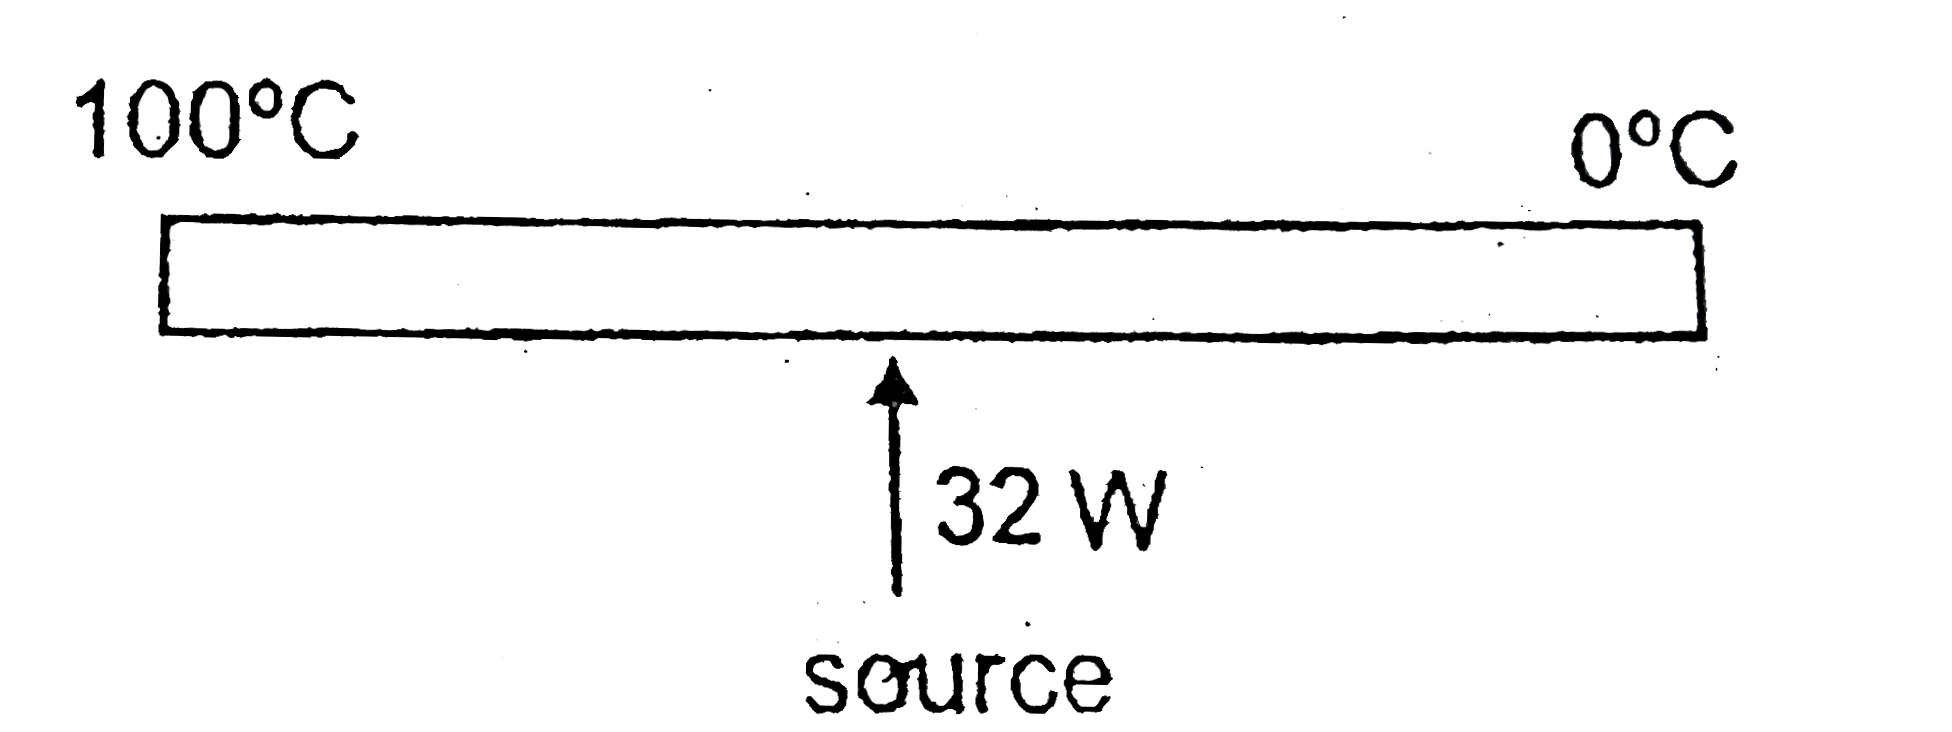 AThe temperature of rod at centre is 250∘CBThe temperature of rod at centre is 50∘CCThe temperature gradient in right half is 500∘C/mDThe temperature gradient in left half is 300∘C/m
A metal rod of area of cross section A has length L and coefficient of thermal conductivity K the thermal resistance of the rod is .
ALKABKLLCKALDAKLTwo rods of copper and brass having the same length and cross - section are joined end to end. The free end of the copper is at 0∘C and of brass is at 80∘C in steady-state. If thermal conductivity of copper is 4 times of that of brass find the temp. at junction of two rods
A80∘CB64∘CC20∘CD16∘C
Three metal rods made of copper, aluminium and brass, each 20cm long 4cm in diameter, are placed end to end with aluminium between the other two. The free ends of copper and brass are maintained at 100 and 0∘C respectively. Assume that the thermal conductivity of copper is twice that of aluminium and four times that of brass. The approximately equilibrium temperatures of the copper-aluminiu and aluminium-brass junctions are respectively.

View SolutionA thin copper rod of uniform cross section A square metres and of length L metres has a spherical metal sphere of radius r metre at tis one end symmetrically attached to the copper rod. The thermal conductivity of copper is K and the emissivity of the spherical surface of the sphere is ε.The free end of the copper rod is maintained at the temperature T kelving by supplying thermal energy from a P watt source. Steady state conditions are allowed ot be established while the rod is properly insulated aginst heat loss from its lateral surface. Surroundings are at 0∘C Stefan's constant=σW/m2K4.
If the metal sphere attached at the end of the copper rod is made of brass, whose thermal conductivity is Kb<K, then which of the following statements is true?
View SolutionTwo rods A and B of same cross sectional are A and length l connected in series between a source
(T1=100∘C) and a sink (T2=0∘C) as shown in The rod is laterally insulated
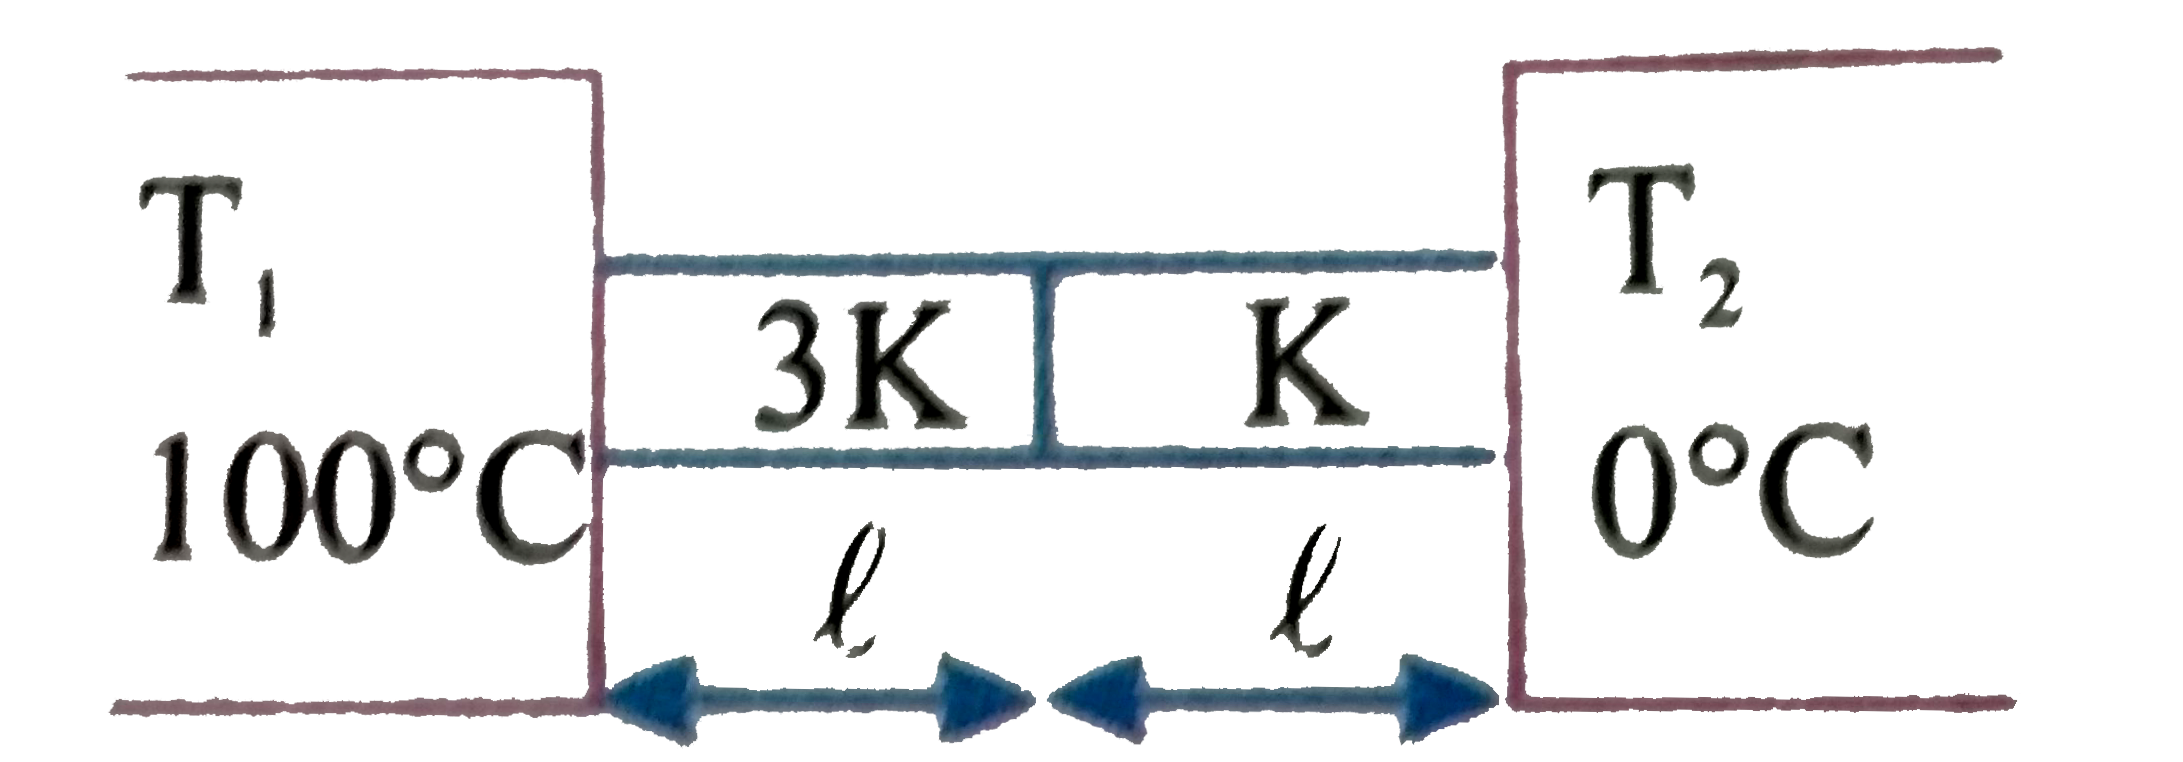
The ratio of thermal resistance of the rod is .
View SolutionTwo rods of similar area of cross section and length are joined as shown in the figure. The ratio of their thermal conductivity is 2:3. The free ends are maintained at 100∘C and 0∘C respectivley. THE temperature at junction in steady state is

View SolutionA large cylindrical rod of length L is made by joining two identical rods of copper and steel of length (L2) each. The rods are completely insulated from the surroundings. If the free end of copper rod is maintained at 100∘C and that of steel at 0∘C then the temperature of junction is (Thermal conductivity of copper is 9 times that of steel)
View Solution