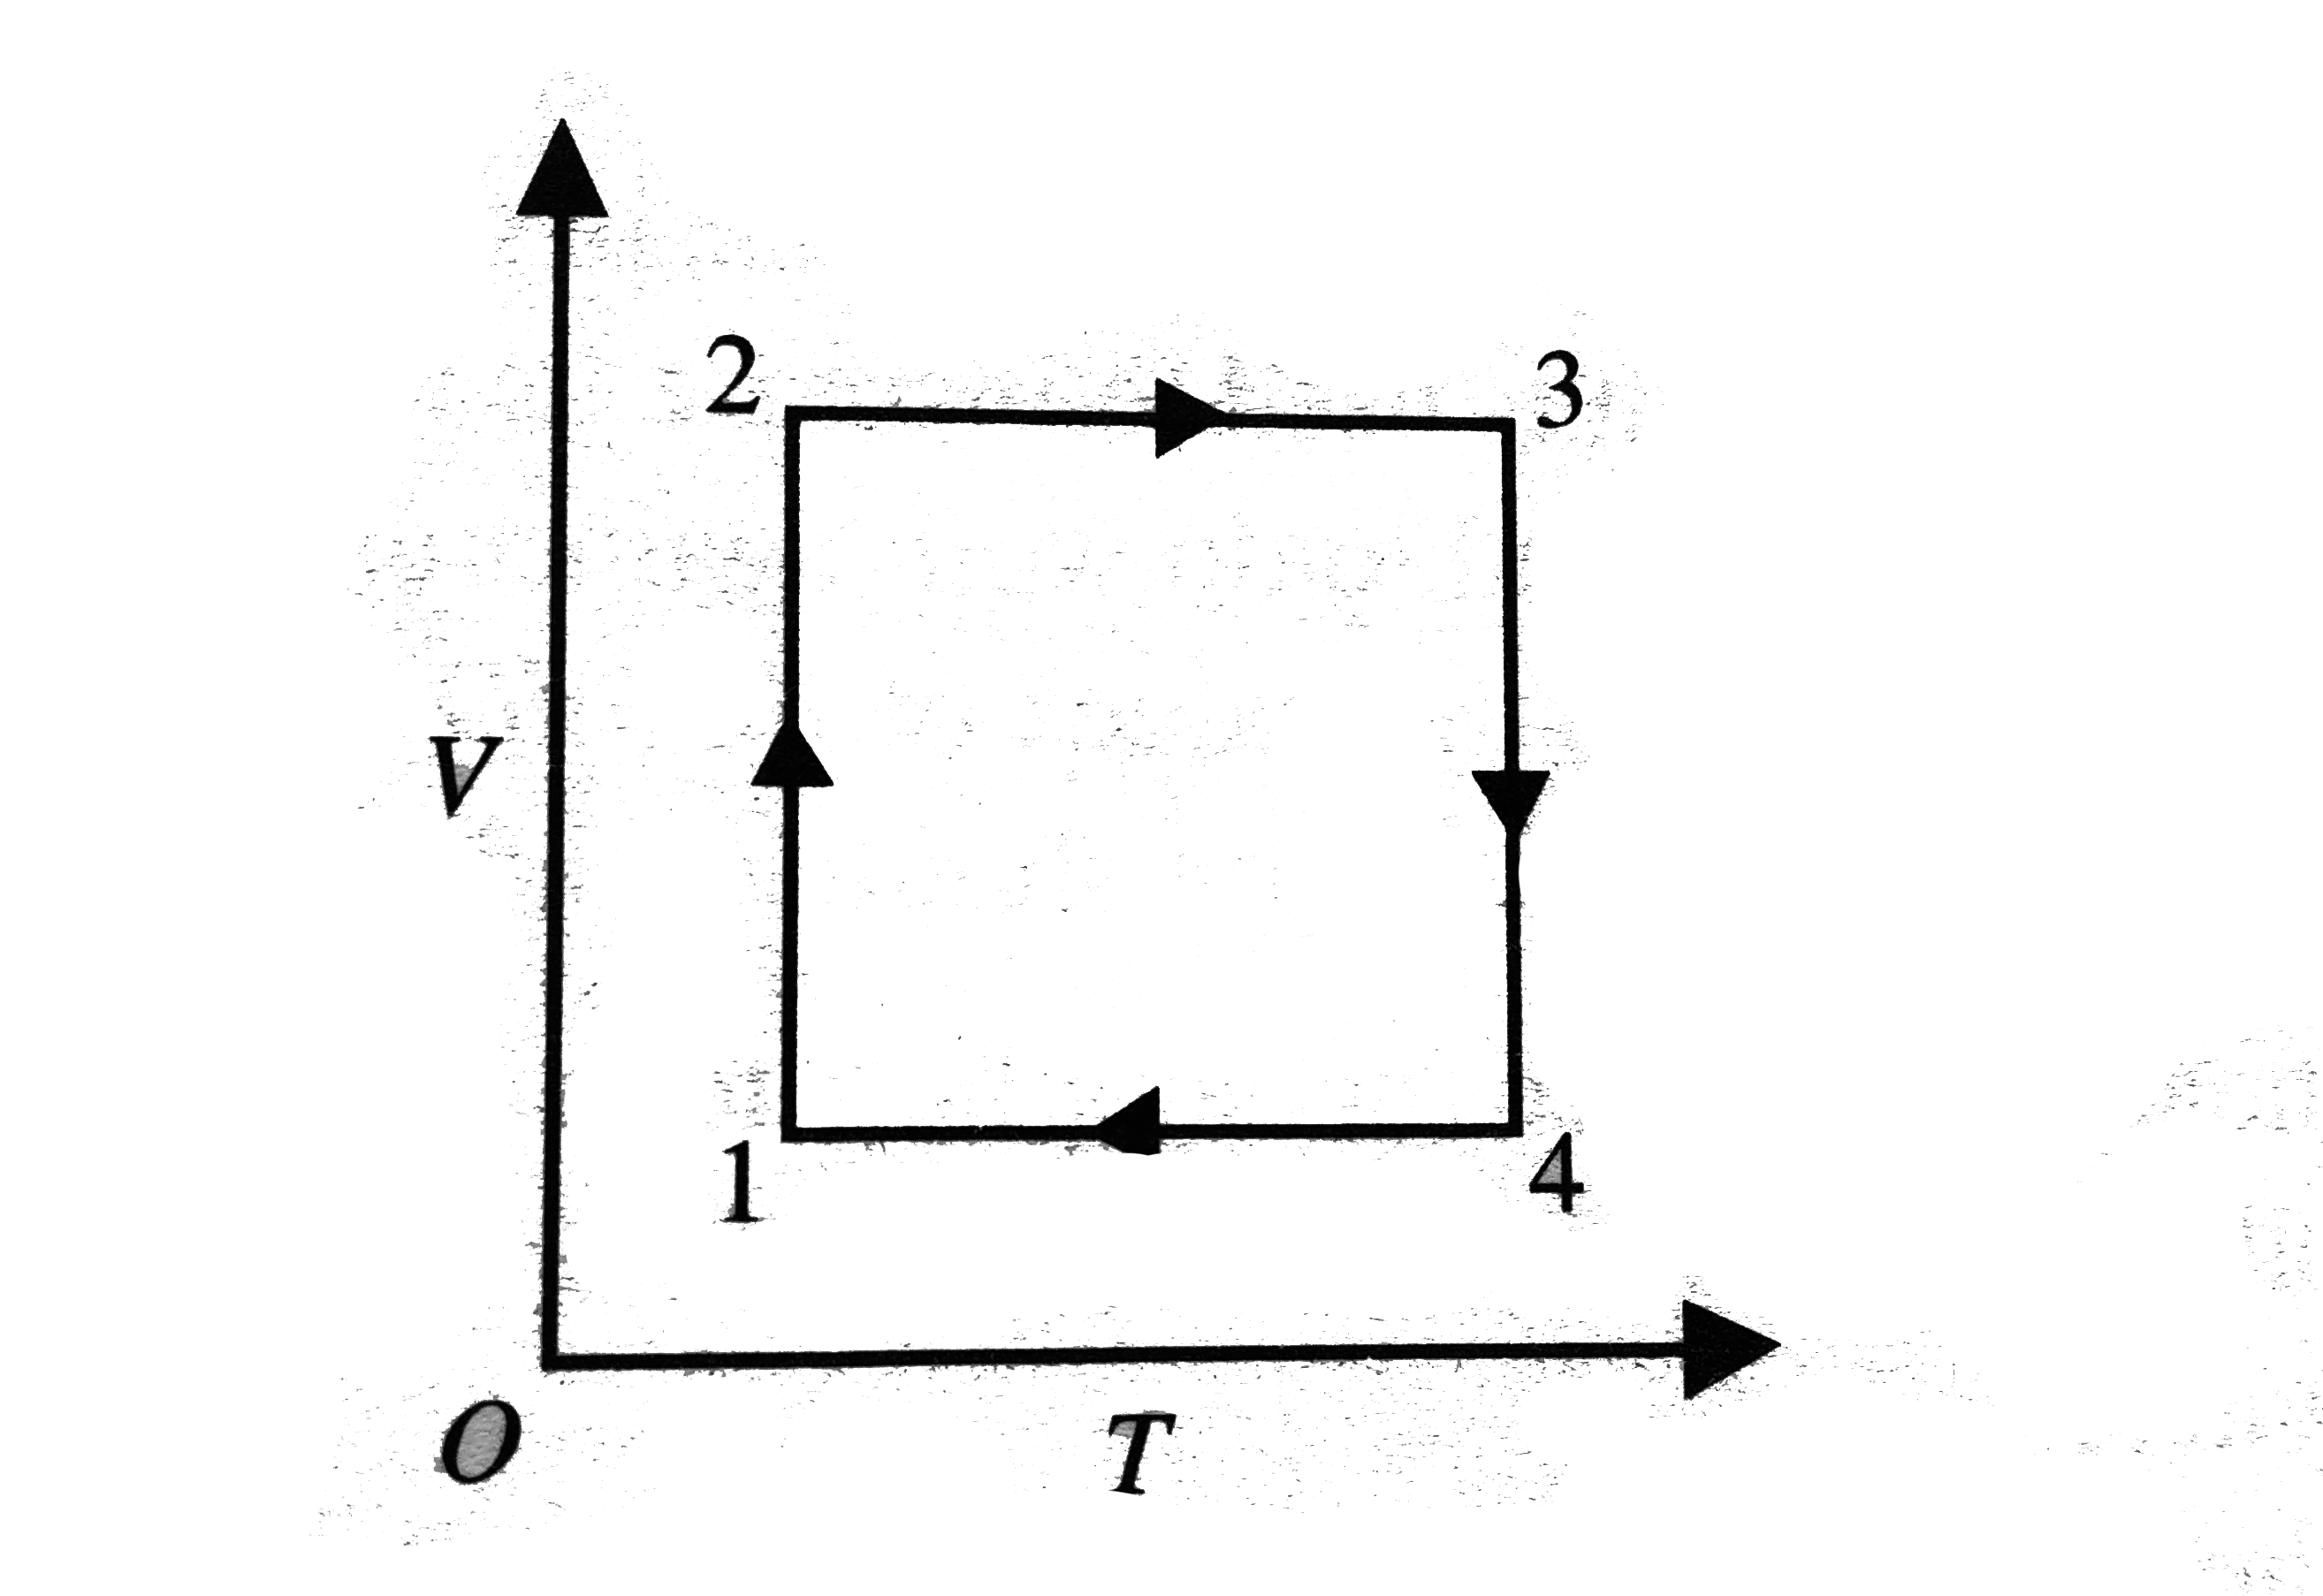
Represent the Carnot cycle on a VT diagram.
To represent the Carnot cycle on a VT (Volume-Temperature) diagram, we need to understand the four processes that make up the Carnot cycle. Here’s a step-by-step solution:
Step 1: Identify the Four Processes of the Carnot Cycle
The Carnot cycle consists of the following four processes:
1. Reversible Isothermal Expansion (1 to 2): The gas expands isothermally at a high temperature (T_H), absorbing heat (Q_H) from the hot reservoir.
2. Reversible Adiabatic Expansion (2 to 3): The gas continues to expand without heat exchange, causing its temperature to drop.
3. Reversible Isothermal Compression (3 to 4): The gas is compressed isothermally at a low temperature (T_C), releasing heat (Q_C) to the cold reservoir.
4. Reversible Adiabatic Compression (4 to 1): The gas is compressed adiabatically, increasing its temperature back to T_H.
Step 2: Draw the VT Diagram
1. Plot the Isothermal Expansion (1 to 2):
- This process occurs at constant temperature (T_H), so it will be represented as a horizontal line on the VT diagram. The volume increases as the gas absorbs heat.
2. Plot the Adiabatic Expansion (2 to 3):
- This process is represented by a curve that slopes downward. As the gas expands adiabatically, its temperature decreases while the volume increases.
3. Plot the Isothermal Compression (3 to 4):
- This process occurs at constant temperature (T_C), so it will also be a horizontal line, but this time the volume decreases as the gas releases heat.
4. Plot the Adiabatic Compression (4 to 1):
- This process is represented by another curve that slopes upward. The gas is compressed adiabatically, which increases its temperature while the volume decreases.
Step 3: Label the Points
- Label the points on the VT diagram as follows:
- Point 1: Start of isothermal expansion (T_H)
- Point 2: End of isothermal expansion (T_H)
- Point 3: End of adiabatic expansion (T_C)
- Point 4: Start of isothermal compression (T_C)
Final Representation
The VT diagram will show two horizontal lines (isothermal processes) and two curves (adiabatic processes), creating a closed loop that represents the Carnot cycle.
The Carnot cycle consists of the following four processes:
1. Reversible Isothermal Expansion (1 to 2): The gas expands isothermally at a high temperature (T_H), absorbing heat (Q_H) from the hot reservoir.
2. Reversible Adiabatic Expansion (2 to 3): The gas continues to expand without heat exchange, causing its temperature to drop.
3. Reversible Isothermal Compression (3 to 4): The gas is compressed isothermally at a low temperature (T_C), releasing heat (Q_C) to the cold reservoir.
4. Reversible Adiabatic Compression (4 to 1): The gas is compressed adiabatically, increasing its temperature back to T_H.
1. Plot the Isothermal Expansion (1 to 2):
- This process occurs at constant temperature (T_H), so it will be represented as a horizontal line on the VT diagram. The volume increases as the gas absorbs heat.
- This process is represented by a curve that slopes downward. As the gas expands adiabatically, its temperature decreases while the volume increases.
- This process occurs at constant temperature (T_C), so it will also be a horizontal line, but this time the volume decreases as the gas releases heat.
- This process is represented by another curve that slopes upward. The gas is compressed adiabatically, which increases its temperature while the volume decreases.
- Label the points on the VT diagram as follows:
- Point 1: Start of isothermal expansion (T_H)
- Point 2: End of isothermal expansion (T_H)
- Point 3: End of adiabatic expansion (T_C)
- Point 4: Start of isothermal compression (T_C)
The VT diagram will show two horizontal lines (isothermal processes) and two curves (adiabatic processes), creating a closed loop that represents the Carnot cycle.
Topper's Solved these Questions
- THERMODYNAMICS LAWS & SPECIFIC HEATS OF GASES BOOK - PHYSICS GALAXY - ASHISH ARORACHAPTER - THERMODYNAMICS LAWS & SPECIFIC HEATS OF GASES EXERCISE - Conceptual MCQs Single Option Correct
21 Videos
- THERMODYNAMICS LAWS & SPECIFIC HEATS OF GASES BOOK - PHYSICS GALAXY - ASHISH ARORACHAPTER - THERMODYNAMICS LAWS & SPECIFIC HEATS OF GASES EXERCISE - Numerical MCQs Single Options Correct
42 Videos
- THERMODYNAMICS LAWS & SPECIFIC HEATS OF GASES BOOK - PHYSICS GALAXY - ASHISH ARORACHAPTER - THERMODYNAMICS LAWS & SPECIFIC HEATS OF GASES EXERCISE - Practice Exercise 3.4
11 Videos
- PHOTOELECTRIC EFFECT AND MATTER WAVESBOOK - PHYSICS GALAXY - ASHISH ARORACHAPTER - PHOTOELECTRIC EFFECT AND MATTER WAVESEXERCISE - Unsolved numerical problems
42 Videos
- WAVE OPTICSBOOK - PHYSICS GALAXY - ASHISH ARORACHAPTER - WAVE OPTICSEXERCISE - Unsolved Numerical Problems
28 Videos
Similar Questions
Knowledge Check
A carnot cycle consists of
ATwo stagesBFour stagesCSix stagesDEight stages.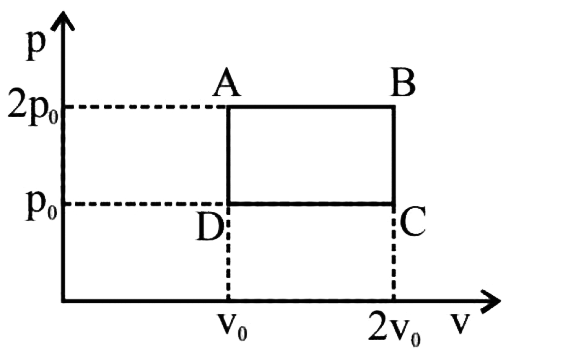
The above p-v diagram represents the thermodymic cycle of an engine, operating with an ideal monatomic gas. The amount of heat, extracted from the source in a single cycle isAp0v0B(132)p0v0C(112)p0v0D4p0v0A carnot cycle consists of
ATwo stagesBFour stagesCSix stagesDEight stages
Nitrogen Cycle
View SolutionThe figure shows a Carnot cycle for an ideal gas on a P-V diagram. Which of the areas A1 or A2 is larger?
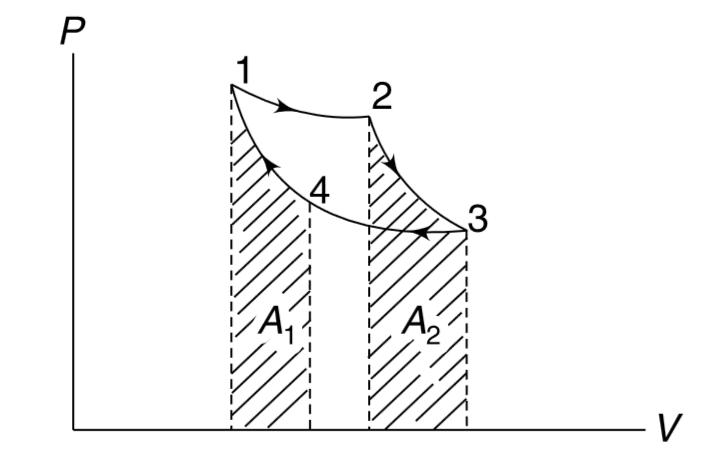
View SolutionFigure. Shows the P−V diagram for a Carnot cycle. In this diagram
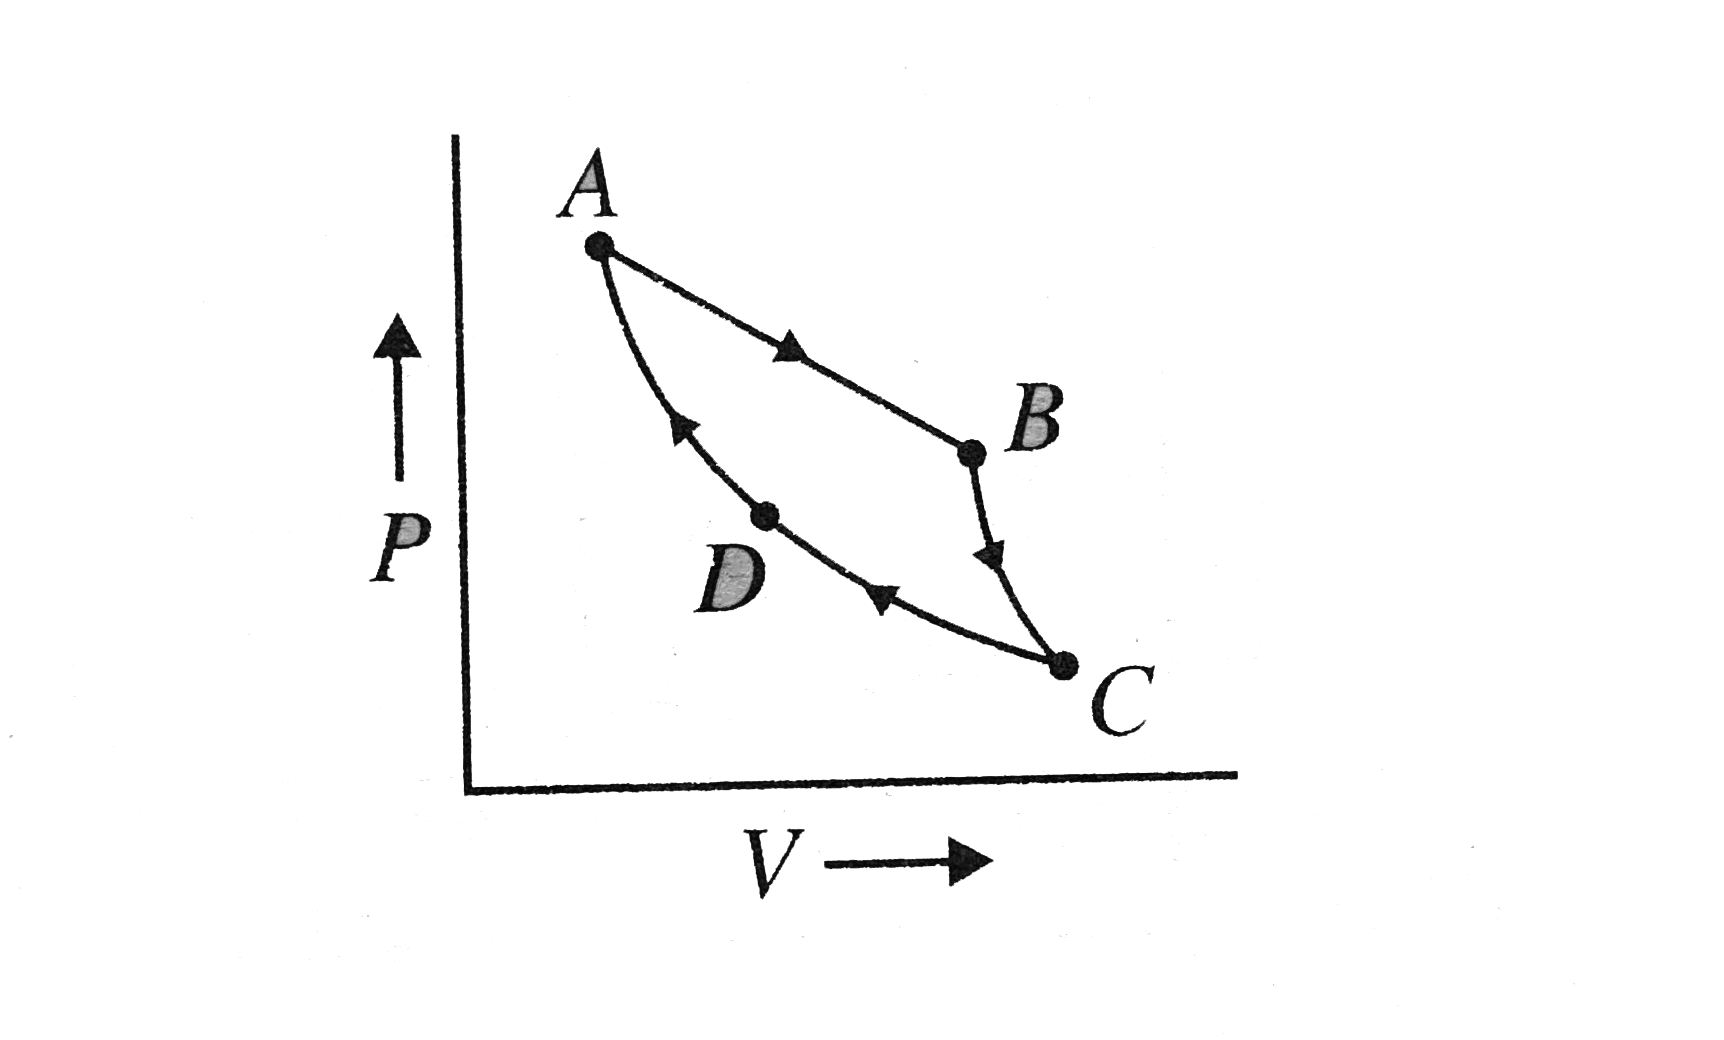
View SolutionAssertion : The Carnot cycle is useful in understanding the performance of heat engines.
Reason : The Carnot cycle provides a way of deteriming the maximum possible efficiency achievable with reservoirs of given temperatures.
View SolutionThe accompanying diagram represents a reversible cannot cycle for an ideal gas:
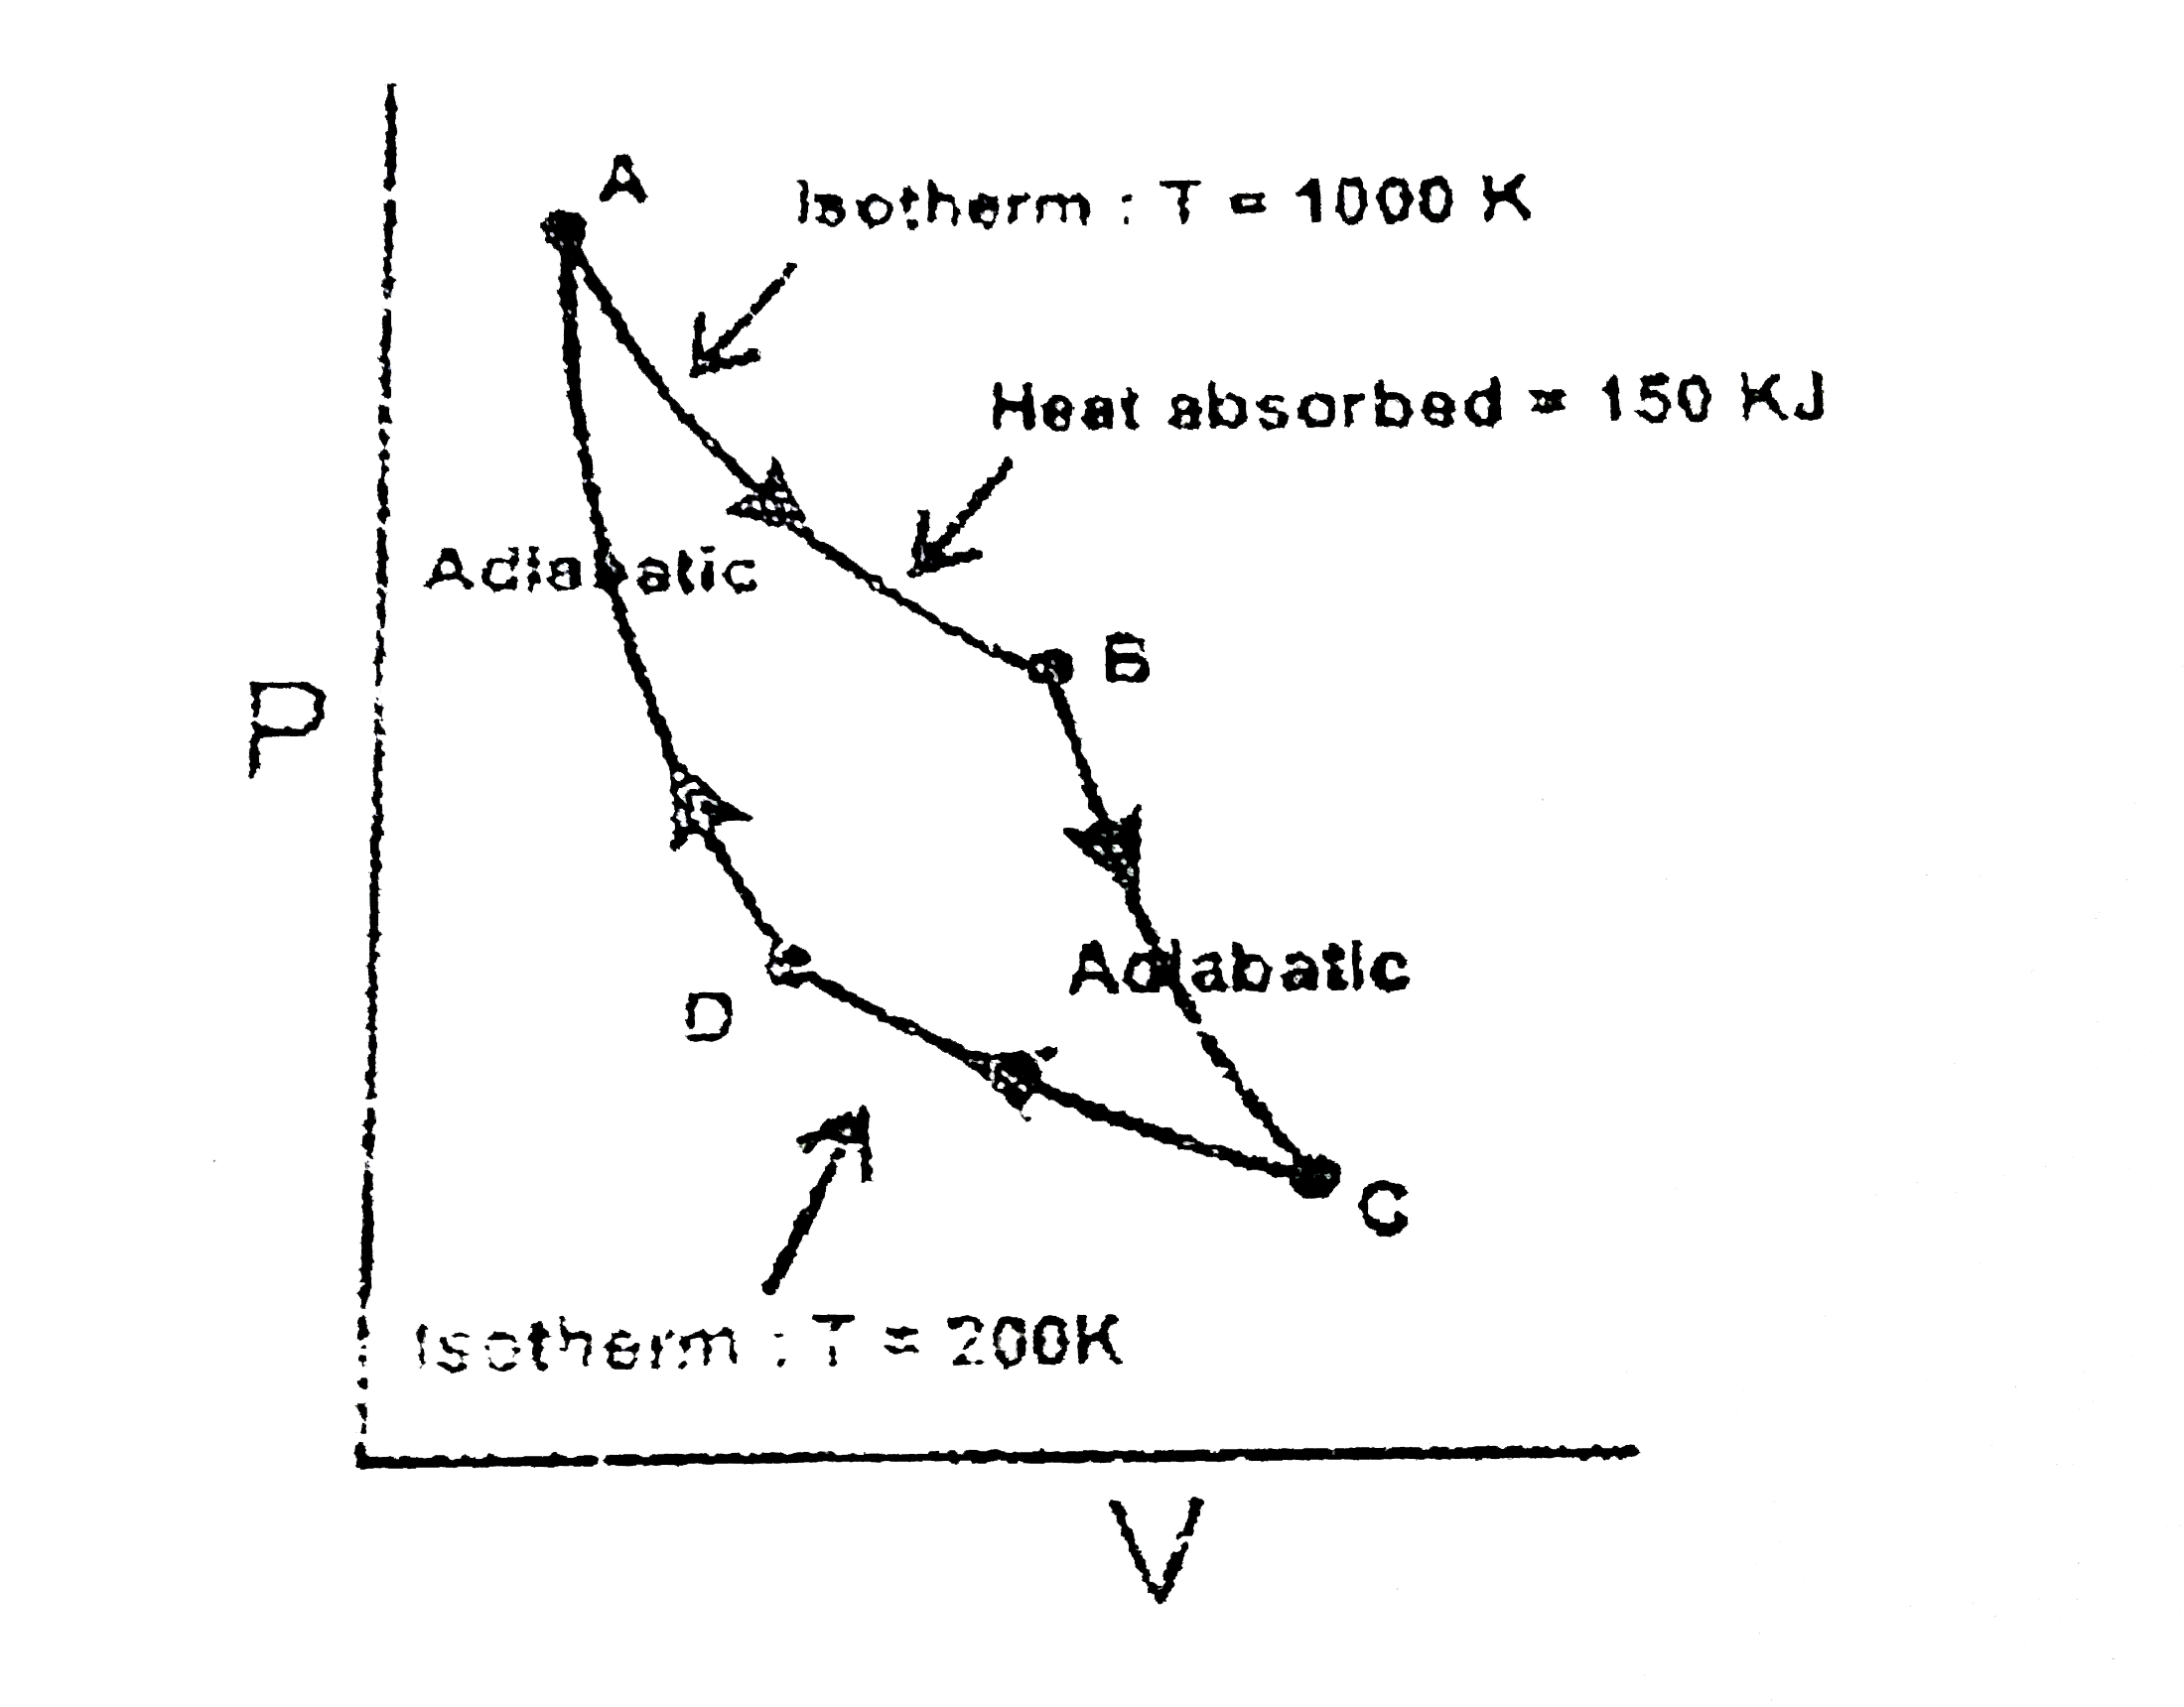
What is the entropy increase during isothermal at 1000K?
View Solution

