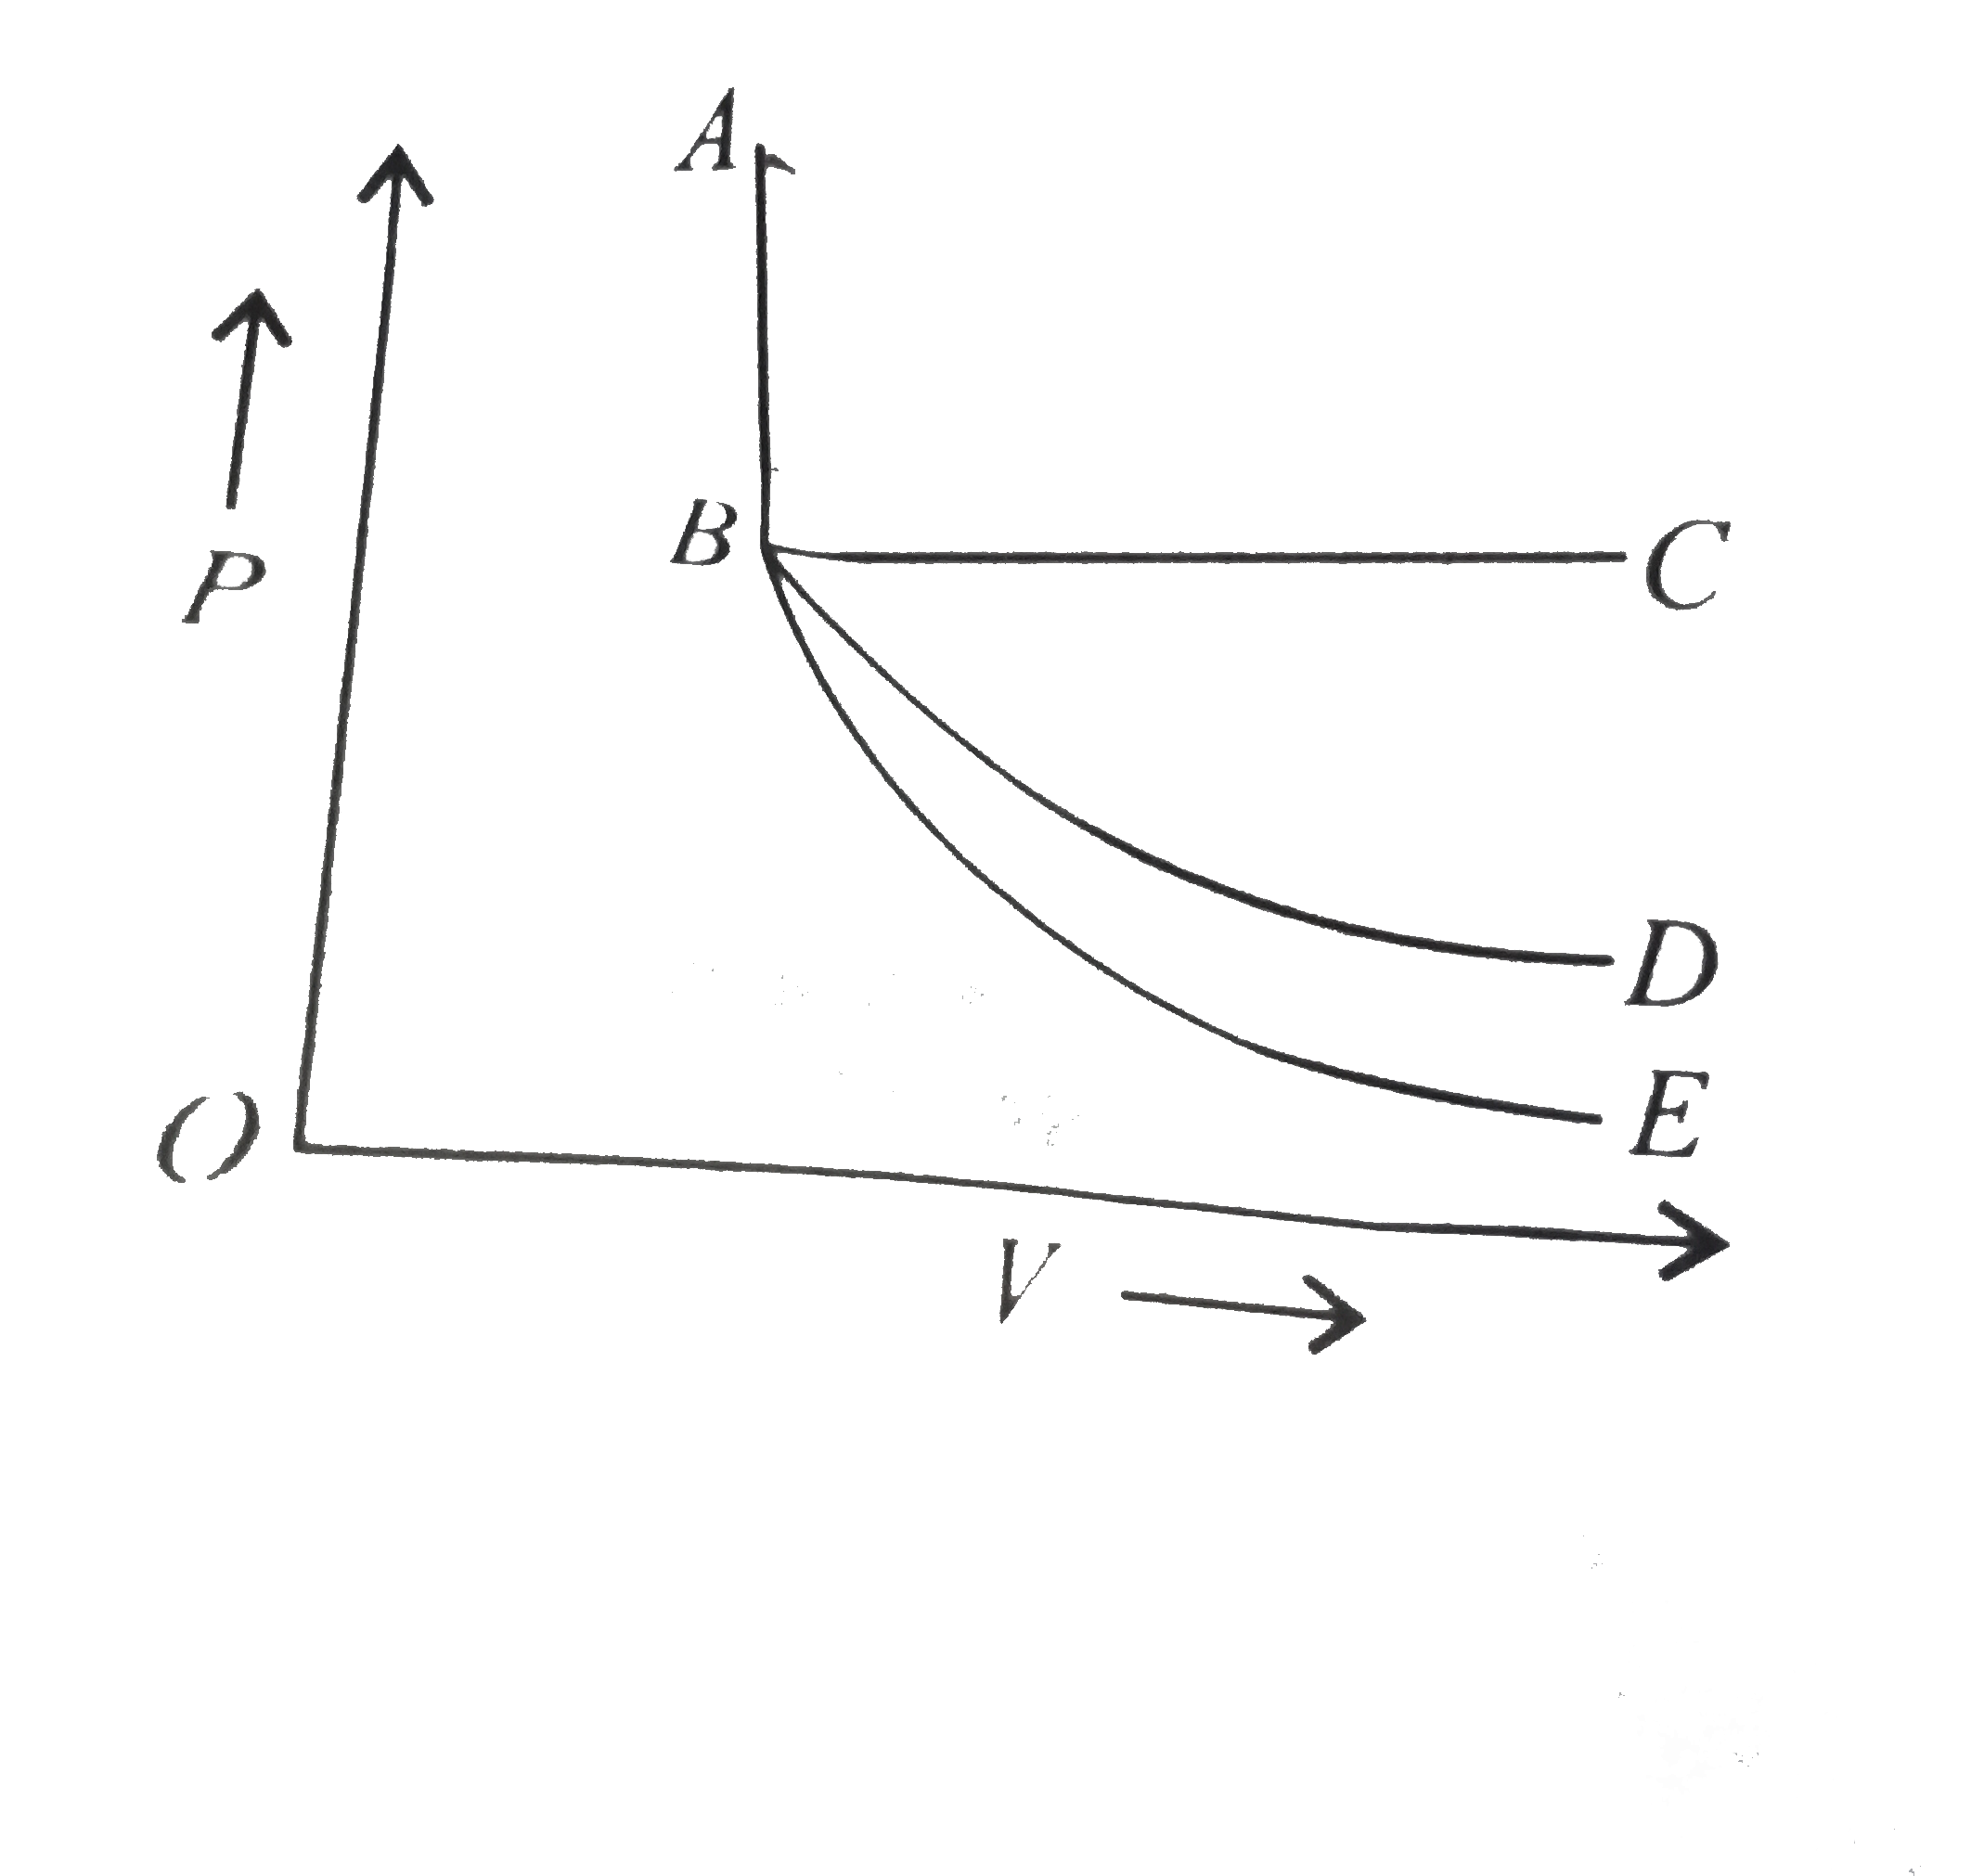
Figure. Shows the P−V diagram for a Carnot cycle. In this diagram
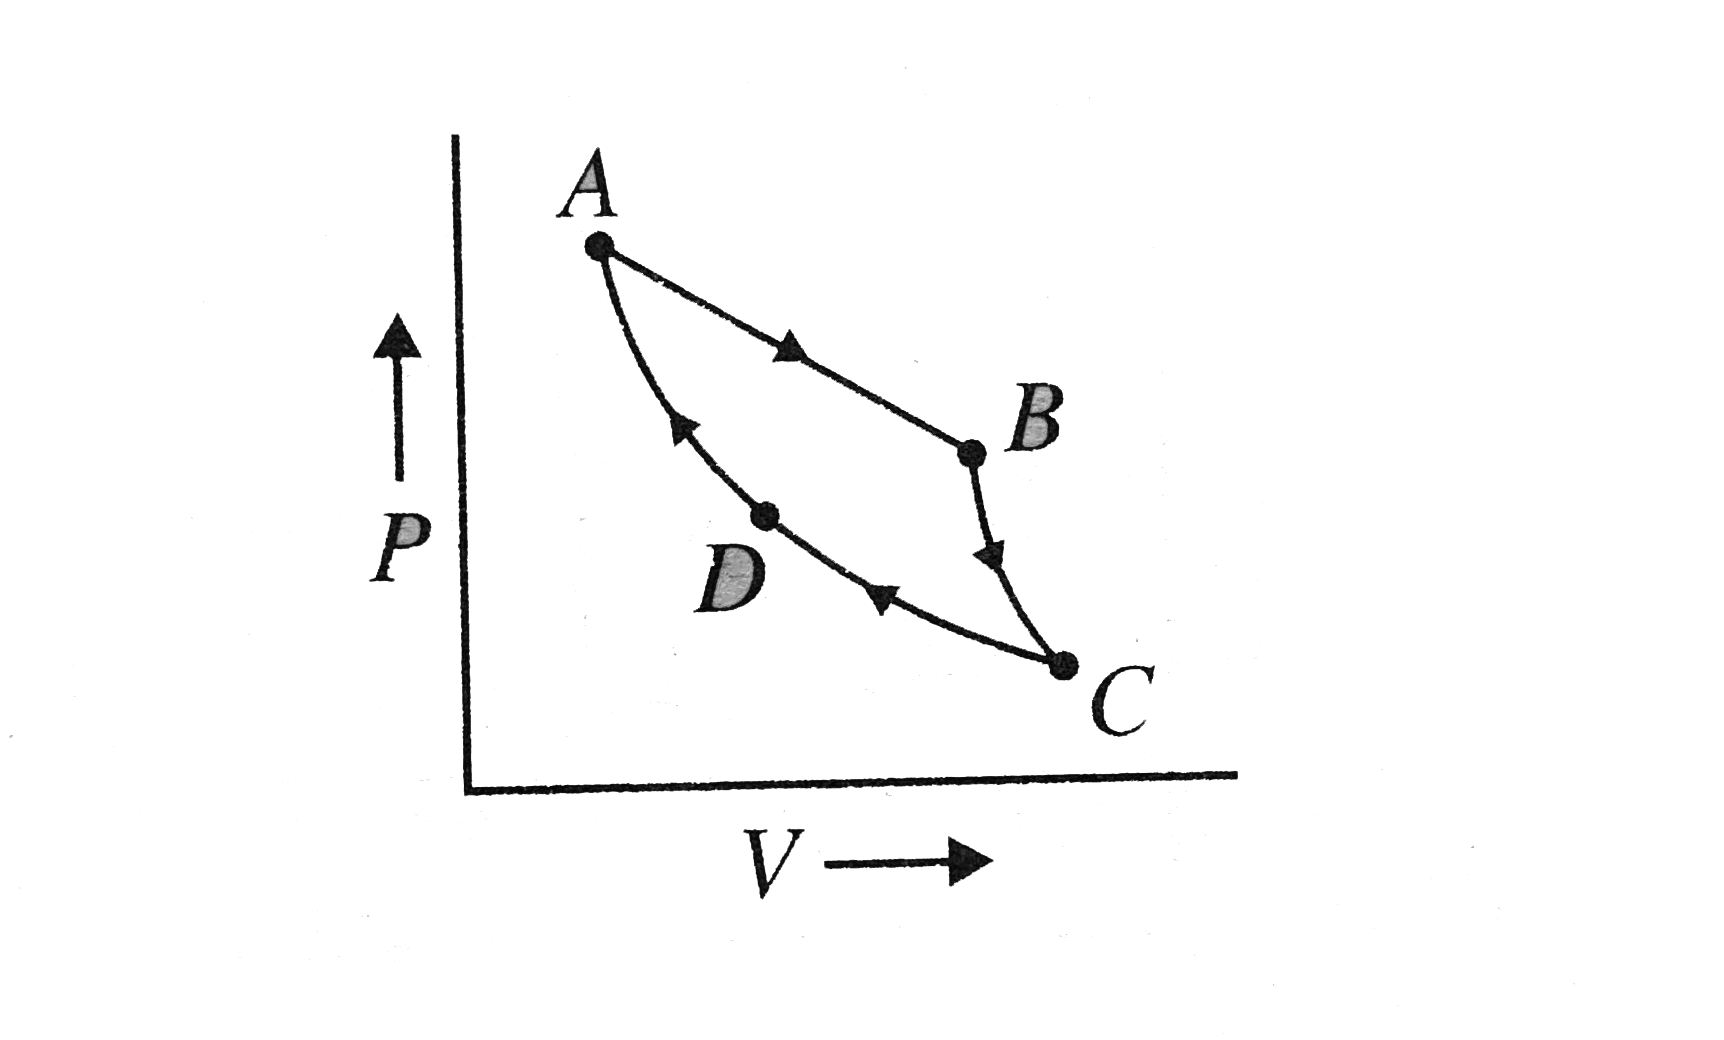
curve AB represents isothemal process and BC adiabatic process
curve AB represents adiabatic process and BC isothermal process
curve CD represents isothermal process and DA adaibatic process
curve CD represent adiabatic process and DA isothermal process
The correct Answer is:A, C
For an adiabatic process, PVγ= constant . Differentiating w.r.t. V, we get
dPdVVγ+PγVγ−1=0
or dPdV=−γPV
For isothermal process, PV= constant.
Hence,
dPdV=−PV
Now, dP/dV is the slope of the (P−V) graph. Thus, the slope of the (P−V) graph for an adiabatic process is γ times that for an isothermal process. Hence, curves BC and DA both represent adaibatic process and curves AB and CD both represent isothermal process. Thus, the correct choices are (a) and (c).
Topper's Solved these Questions
- KINETIC THEORY OF GASES AND FIRST LAW OF THERMODYNAMICSBook:CENGAGE PHYSICSChapter:KINETIC THEORY OF GASES AND FIRST LAW OF THERMODYNAMICSExercise:Assertion-Reasoning
Explore 6 Videos
- KINETIC THEORY OF GASES AND FIRST LAW OF THERMODYNAMICSBook:CENGAGE PHYSICSChapter:KINETIC THEORY OF GASES AND FIRST LAW OF THERMODYNAMICSExercise:Comprehension
Explore 56 Videos
- KINETIC THEORY OF GASES AND FIRST LAW OF THERMODYNAMICSBook:CENGAGE PHYSICSChapter:KINETIC THEORY OF GASES AND FIRST LAW OF THERMODYNAMICSExercise:Single Correct
Explore 140 Videos
- KINETIC THEORY OF GASESBook:CENGAGE PHYSICSChapter:KINETIC THEORY OF GASESExercise:Compression
Explore 2 Videos
- LINEAR AND ANGULAR SIMPLE HARMONIC MOTIONBook:CENGAGE PHYSICSChapter:LINEAR AND ANGULAR SIMPLE HARMONIC MOTIONExercise:Multiple Correct Answer Type
Explore 9 Videos
Similar Questions
Knowledge Check
The given figure shows the P−Vdiagram for a Camot cycle. In this diagram,
 Acurve AB represents isothermal process and BC adiabatic processBcurve AB represents adiabatic process and BC isothermal processCcurve CD represents isothermal process and DA adiabatic processDcurve CD represents adiabatic process and DA isothermal process.
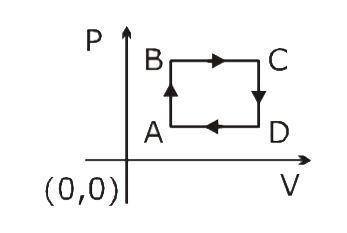
The figure shows P - V diagram of a thermodynamic cycle
Identify the diagram which correctly represents the heat inflow and outflow of the systemA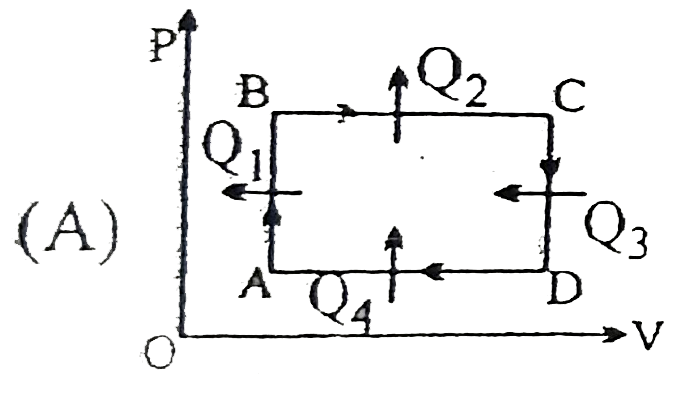 B
B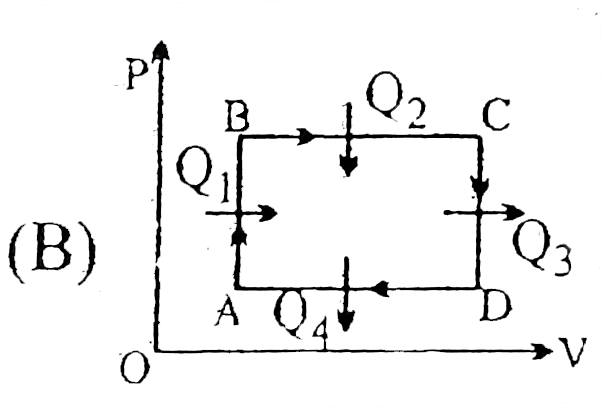 C
C D
D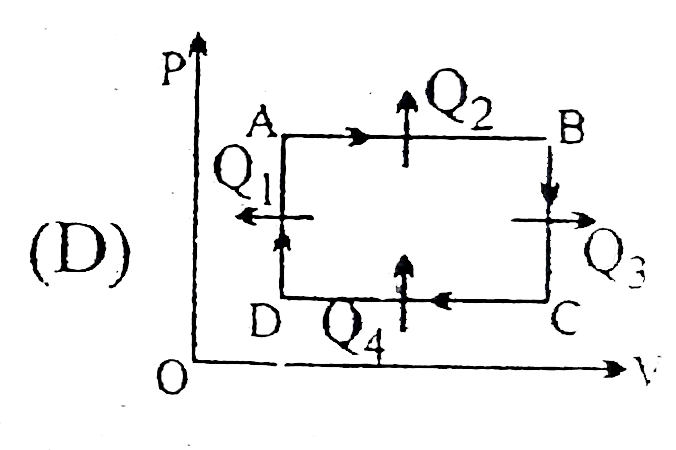
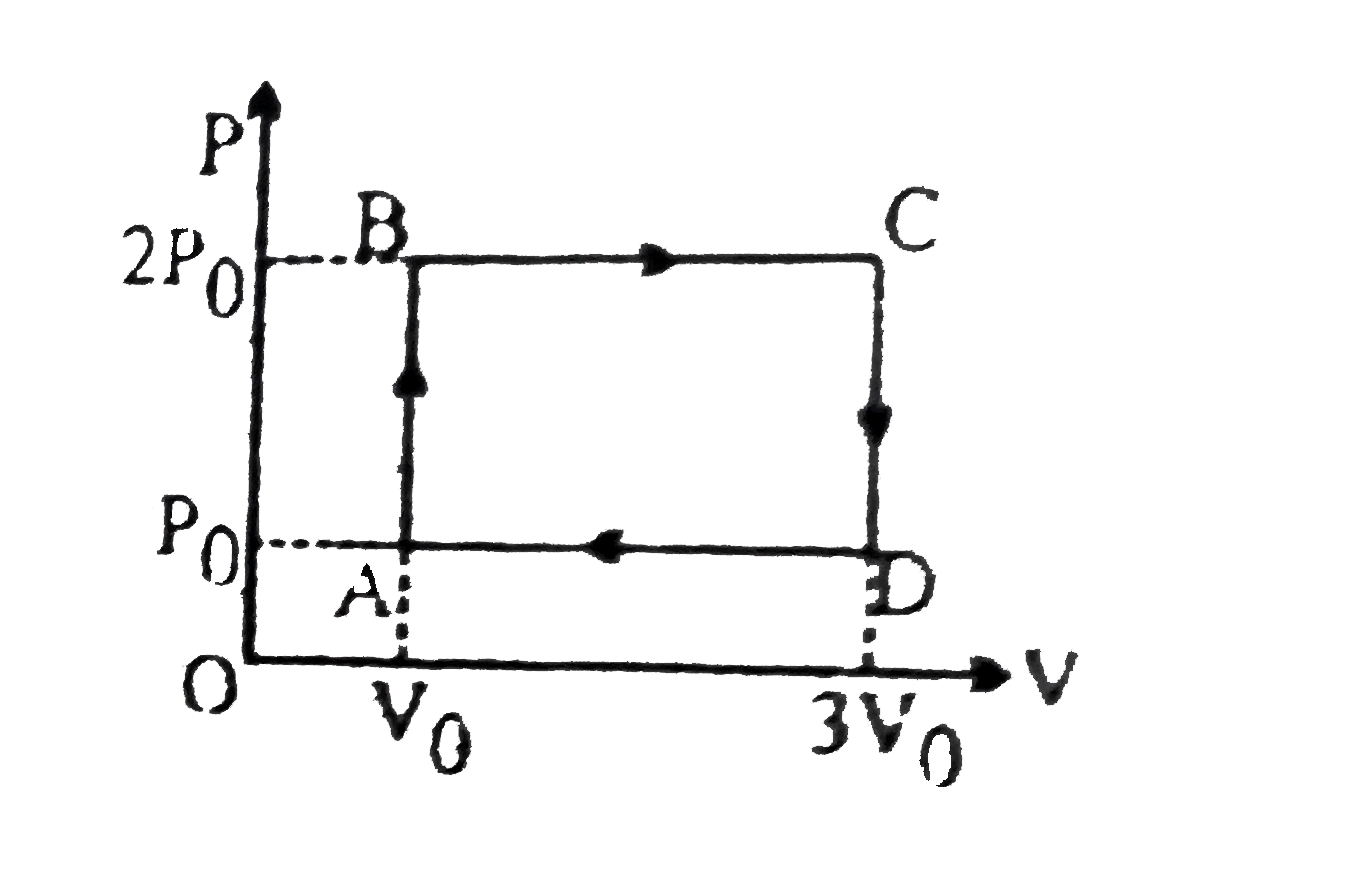
The figure shows P - V diagram of a thermodynamic cycle
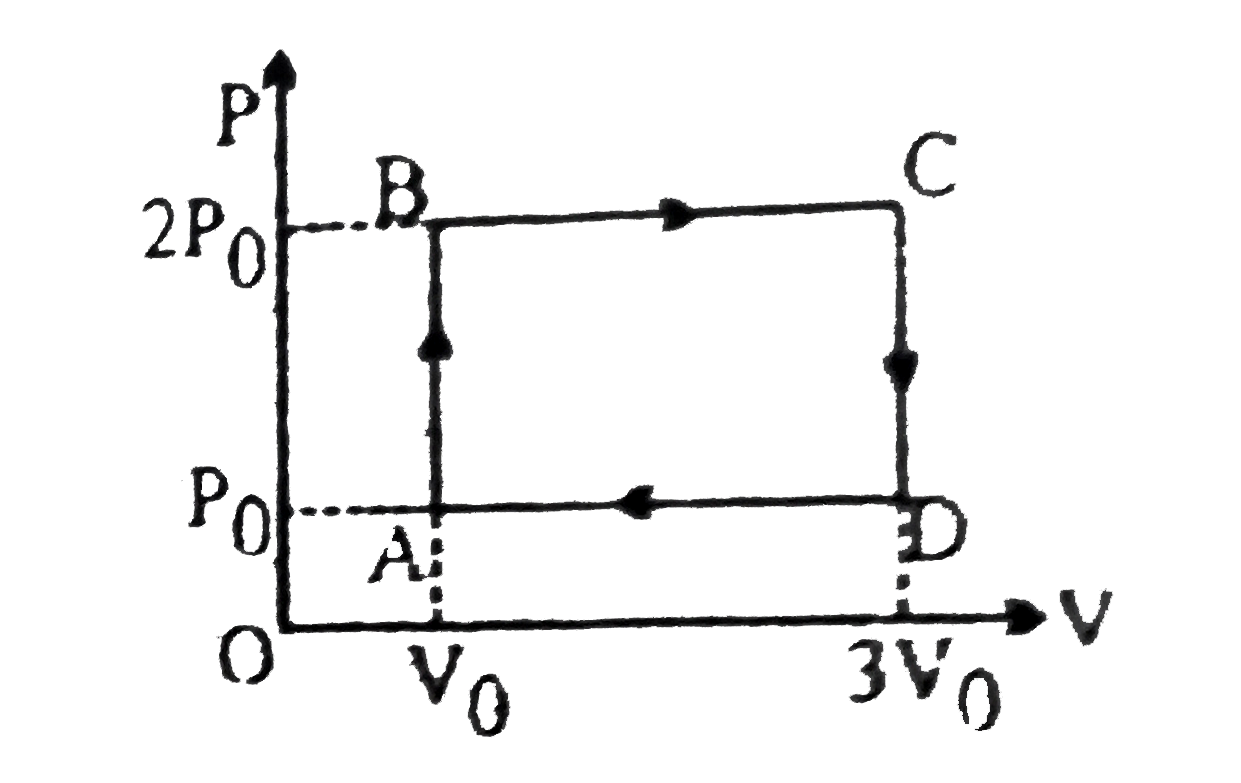
The work done in the cycle isA2P0V0B3P0V0CP0V0D6P0V0
Represent the Carnot cycle on a VT diagram.
View SolutionA thermodynamic cycle xyzx is shown on a V-T diagram.
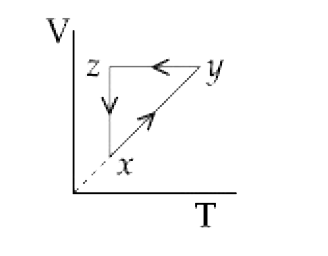
The P-V diagram that best describe this cycle is: (Diagrams are schematic and not to scale).
View SolutionThe figure shows P - V diagram of a thermodynamic cycle
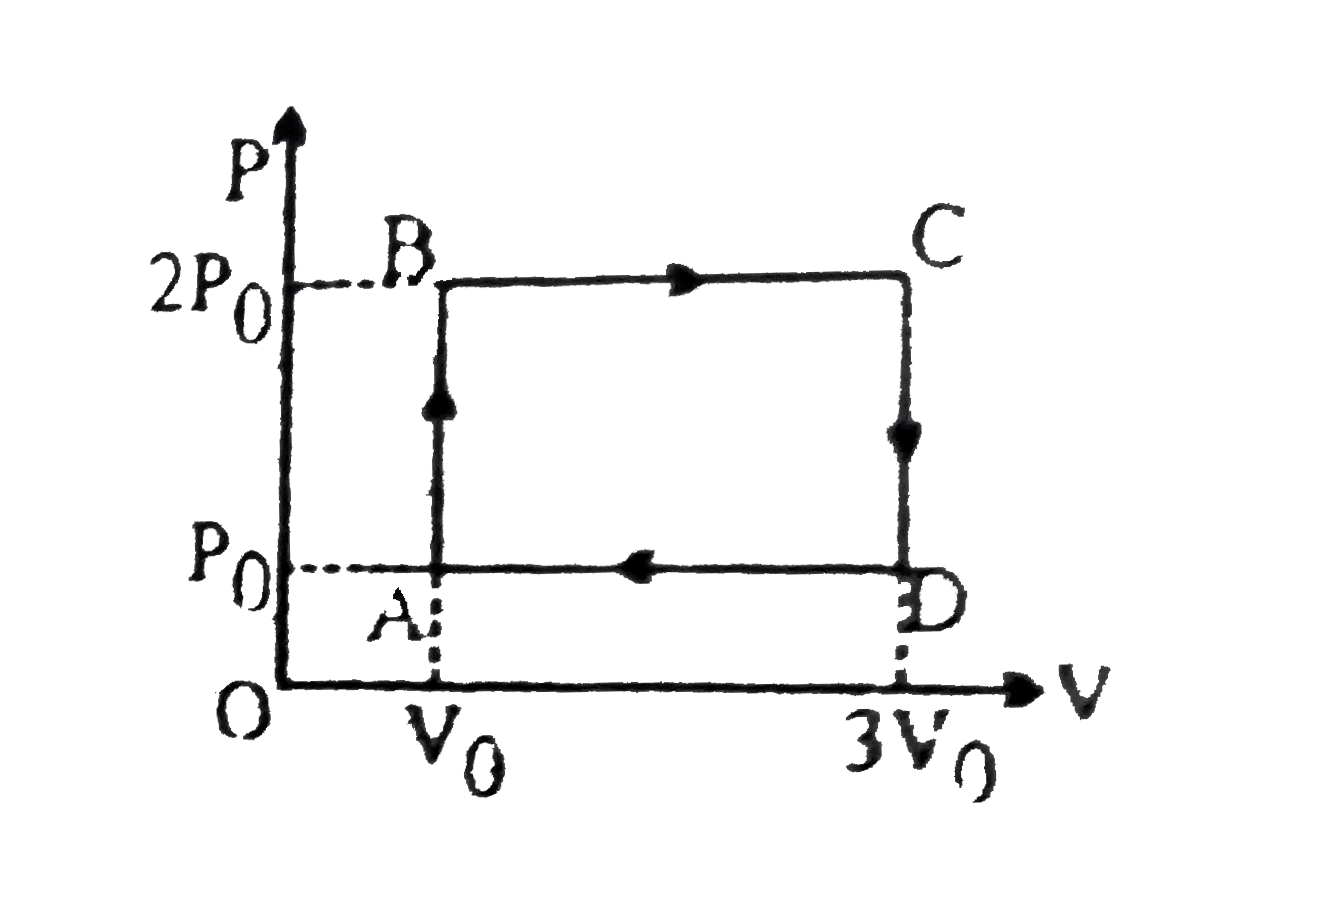
Choose the correct V - T diagram for the given cyclic process.
View SolutionThe figure shows P - V diagram of a thermodynamic cycle
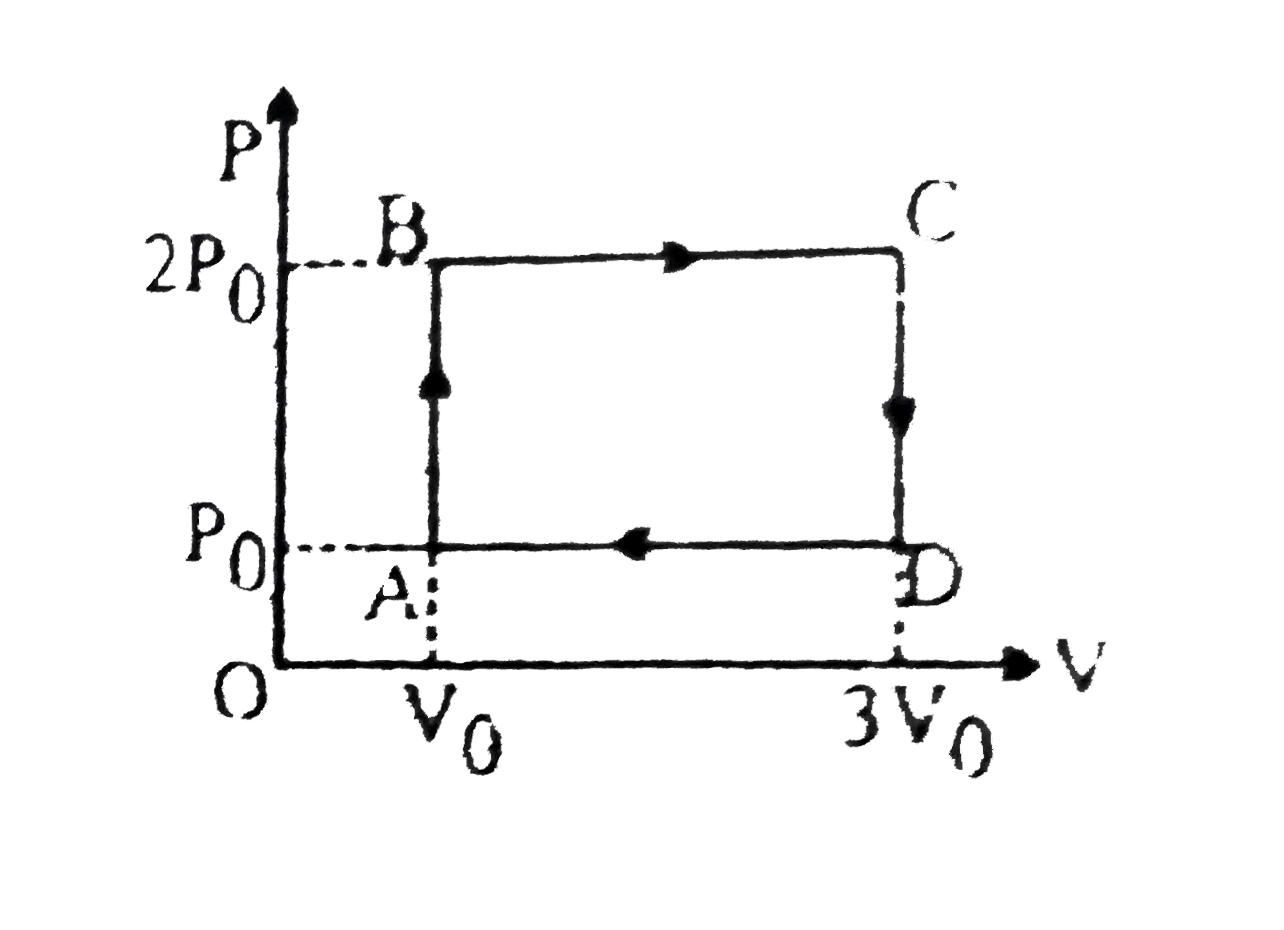
Choose the correct V - T diagram for the given cyclic process.
View SolutionIn P−V diagram shown below,
View Solution


