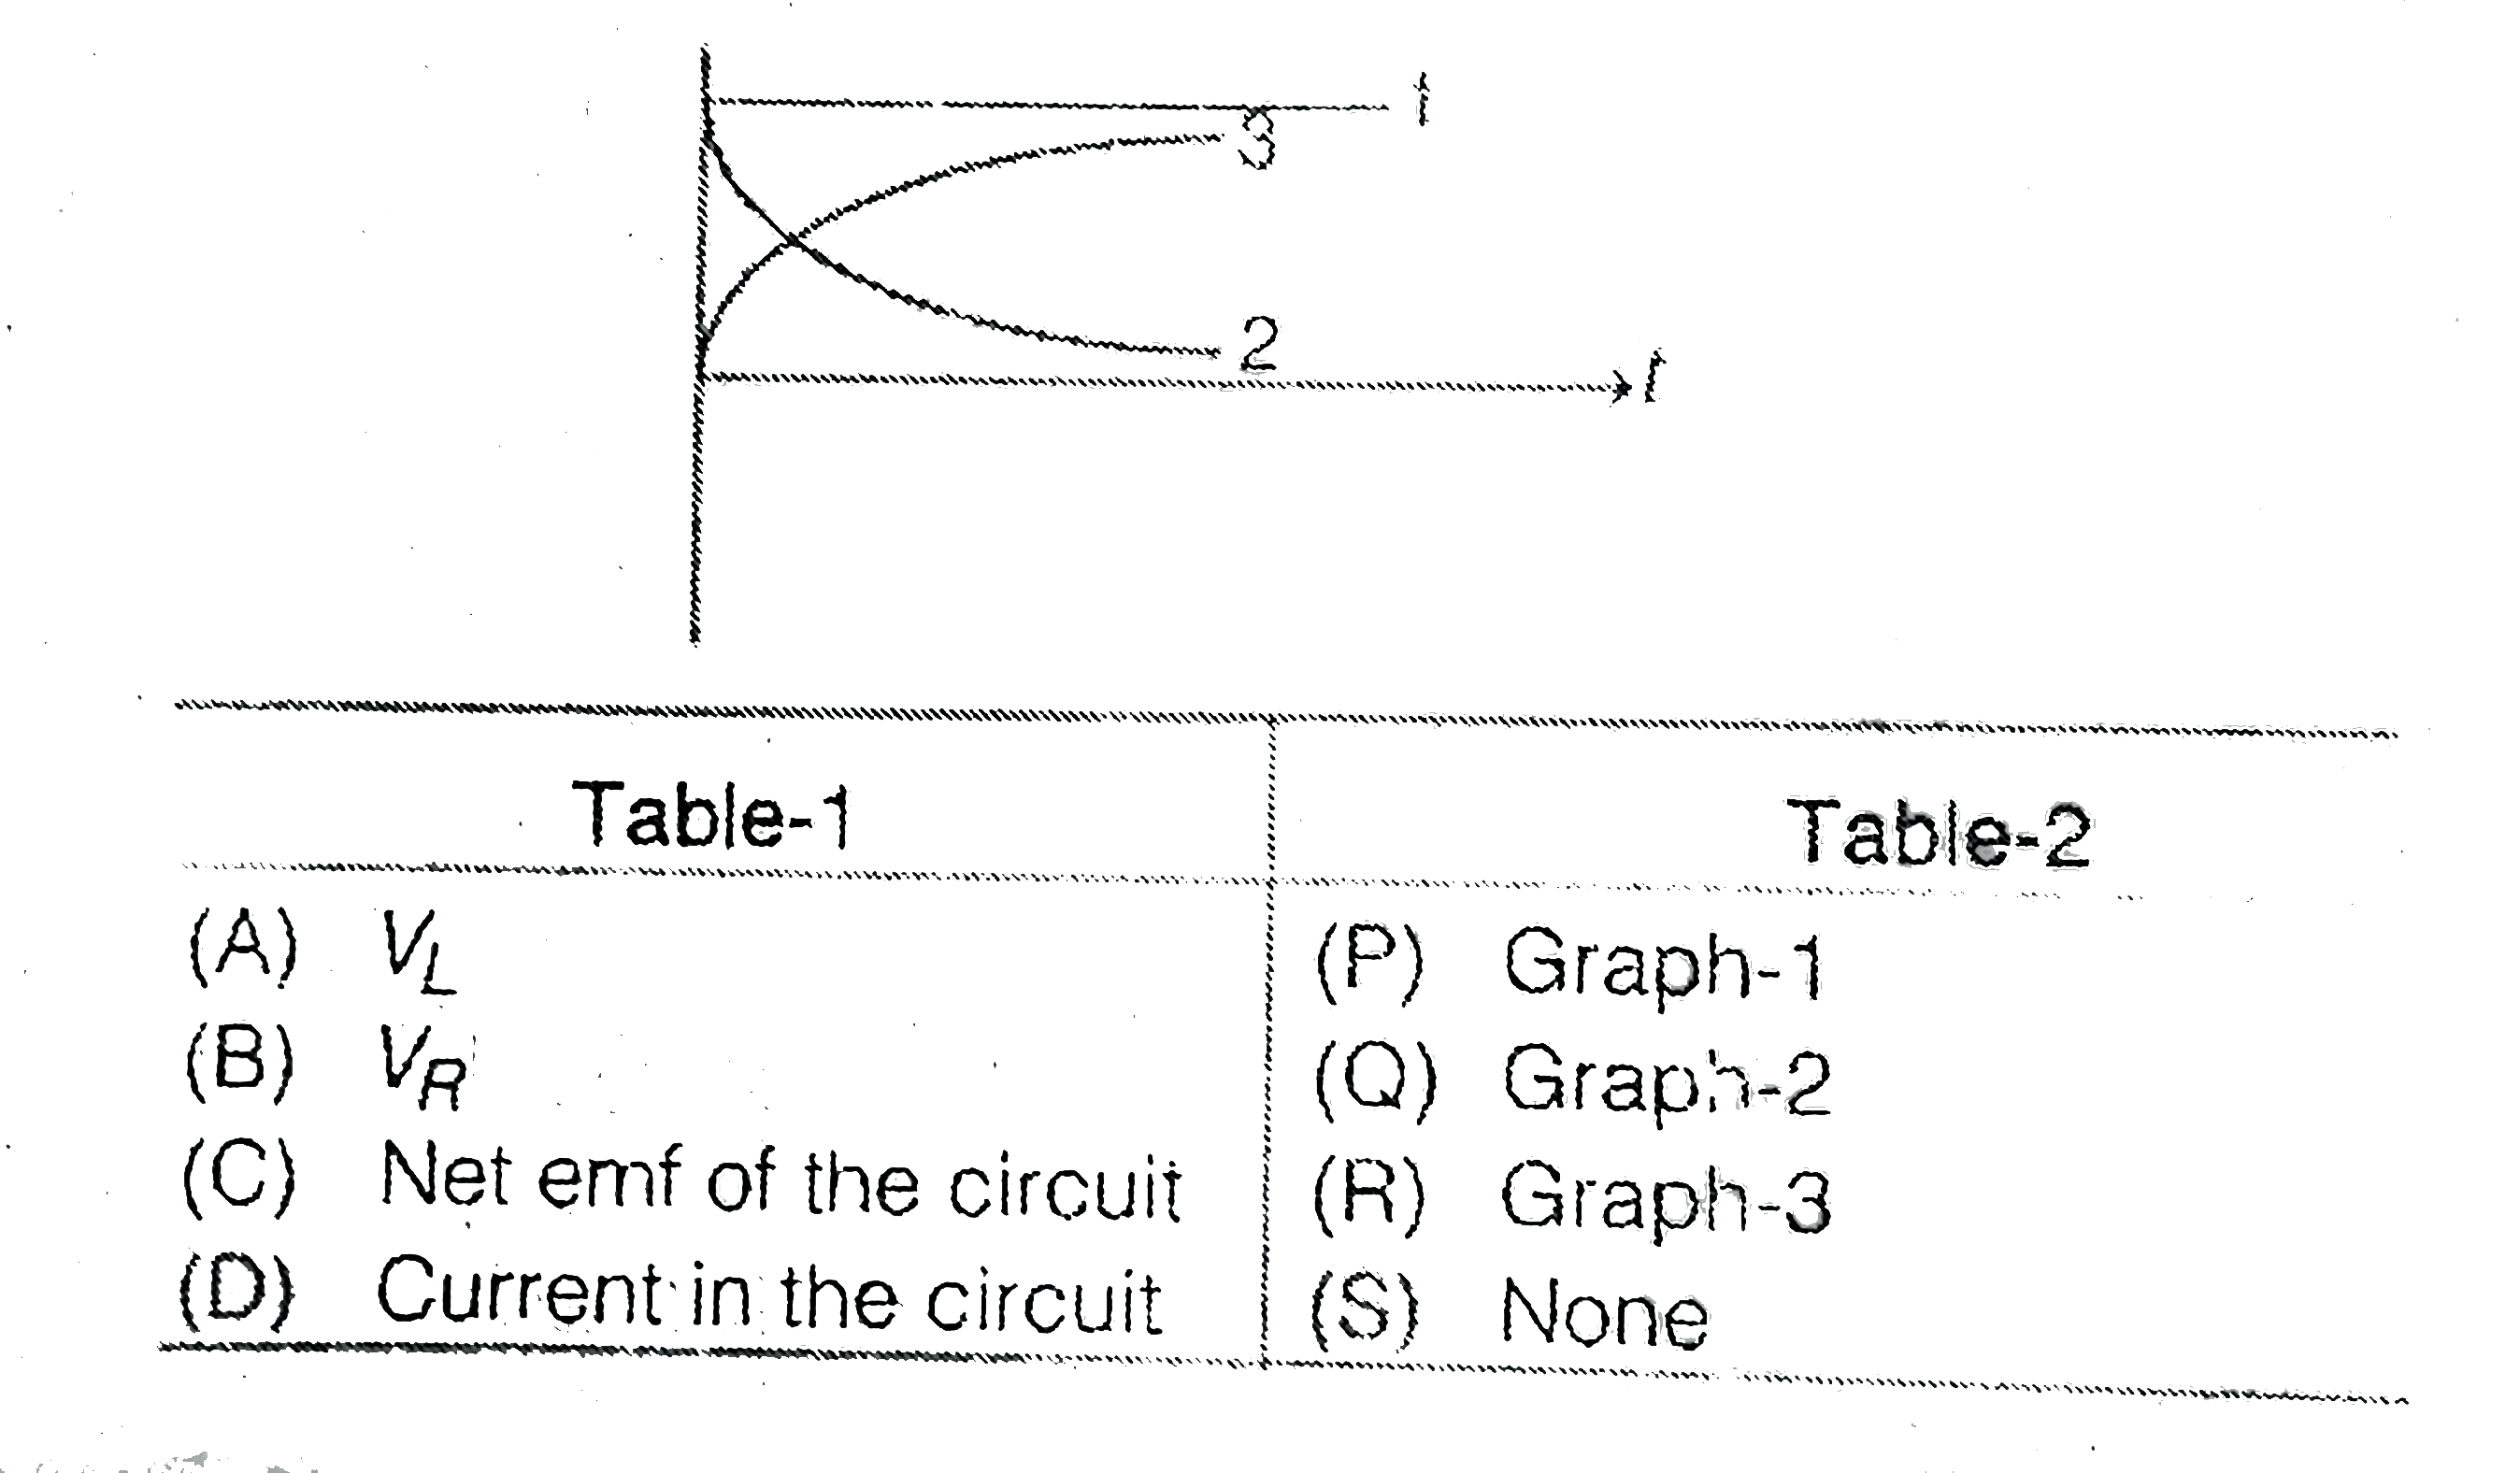
In an circuit connected to a battery, the rate at which energy is stored in the inductor is plotted against time during the growth of current in the circuit. Which of the following best represents the resulting curve?
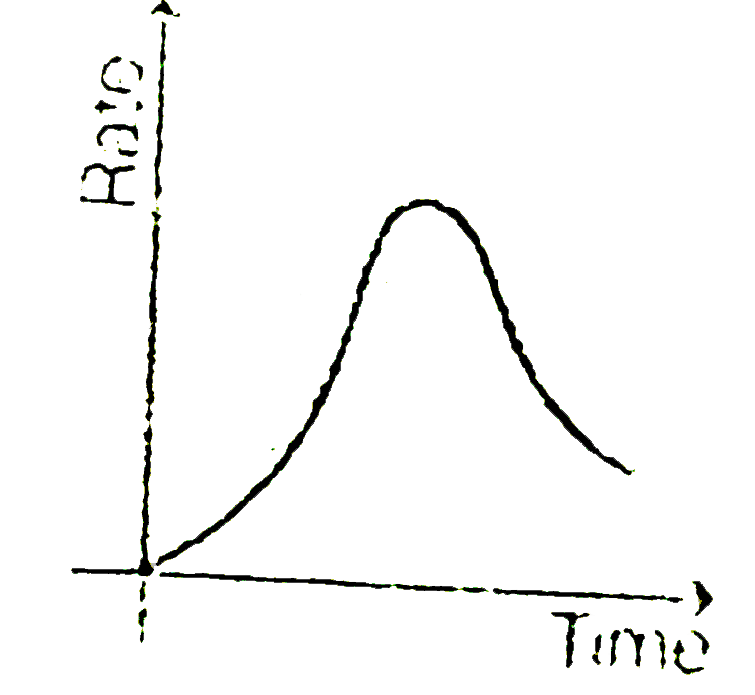
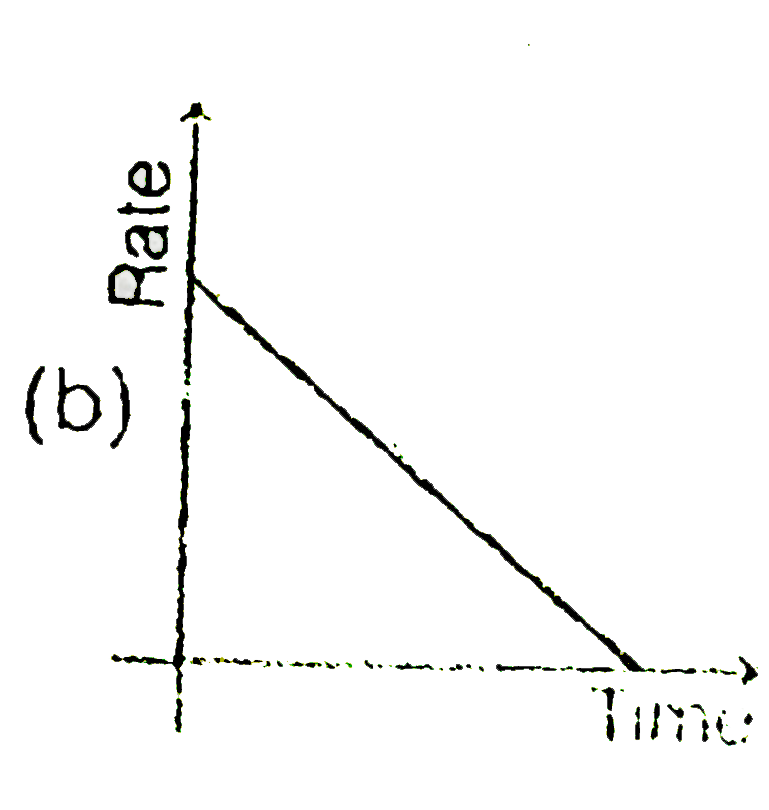
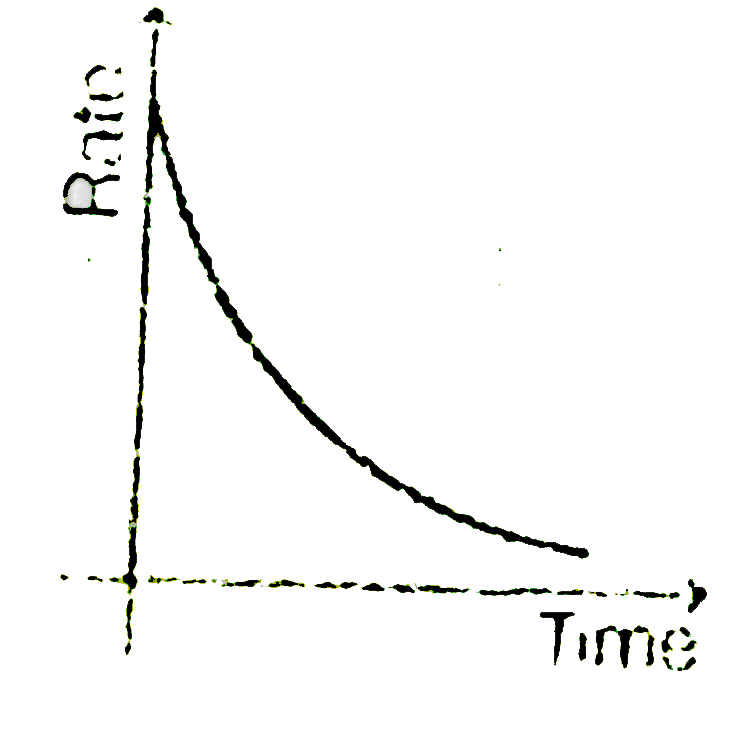
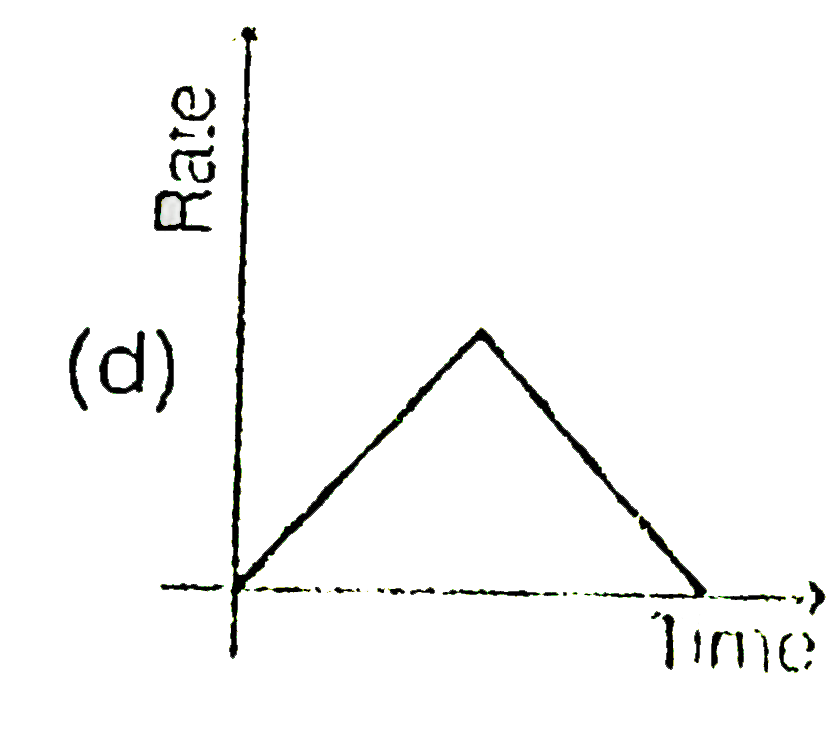
The correct Answer is:A
Step by step video, text & image solution for In an LR circuit connected to a battery, the rate at which energy is stored in the inductor is plotted against time during the growth of current in the circuit. Which of the following best represents the resulting curve? by Physics experts to help you in doubts & scoring excellent marks in Class 12 exams.
Updated on:21/07/2023Similar Questions
Knowledge Check
In an LR circuit connected to a battery, the rate at which energy is stored in the inductor is plotted against time during the growth of current in the circuit. Which of the following best represents the resulation curve?
A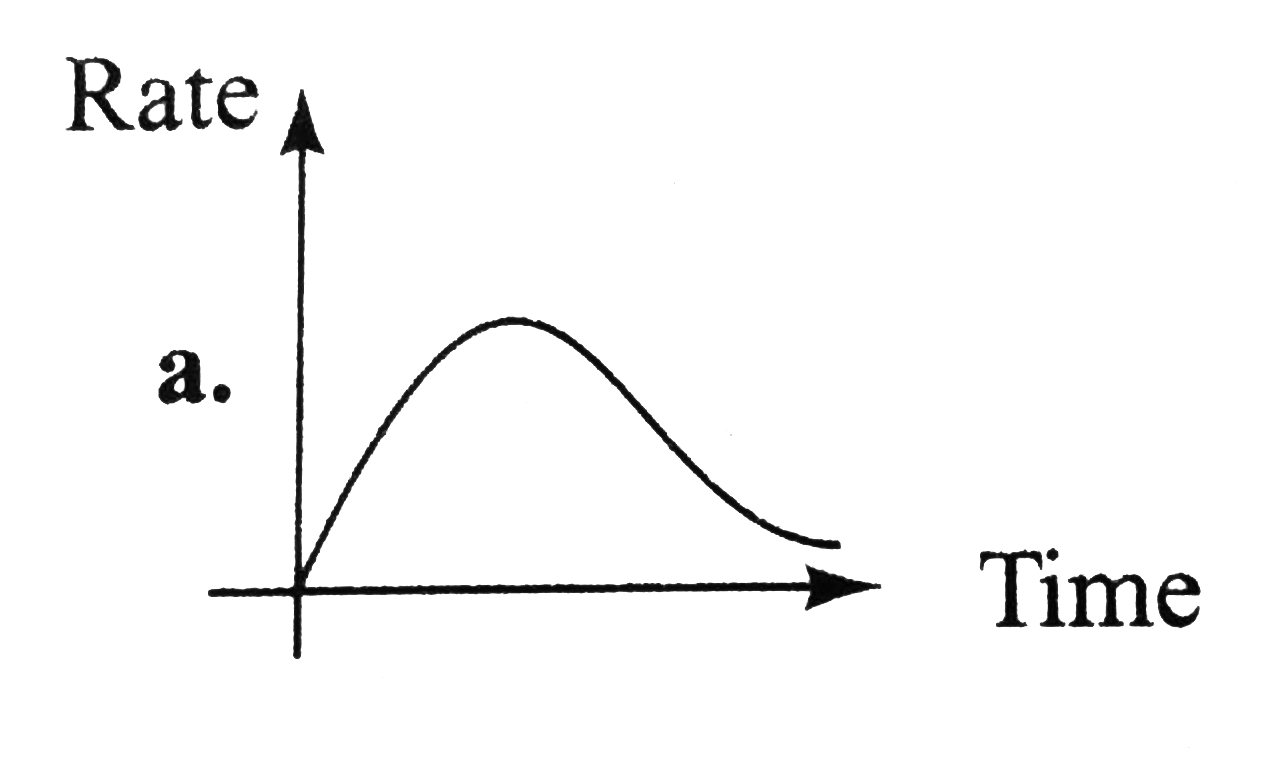 B
B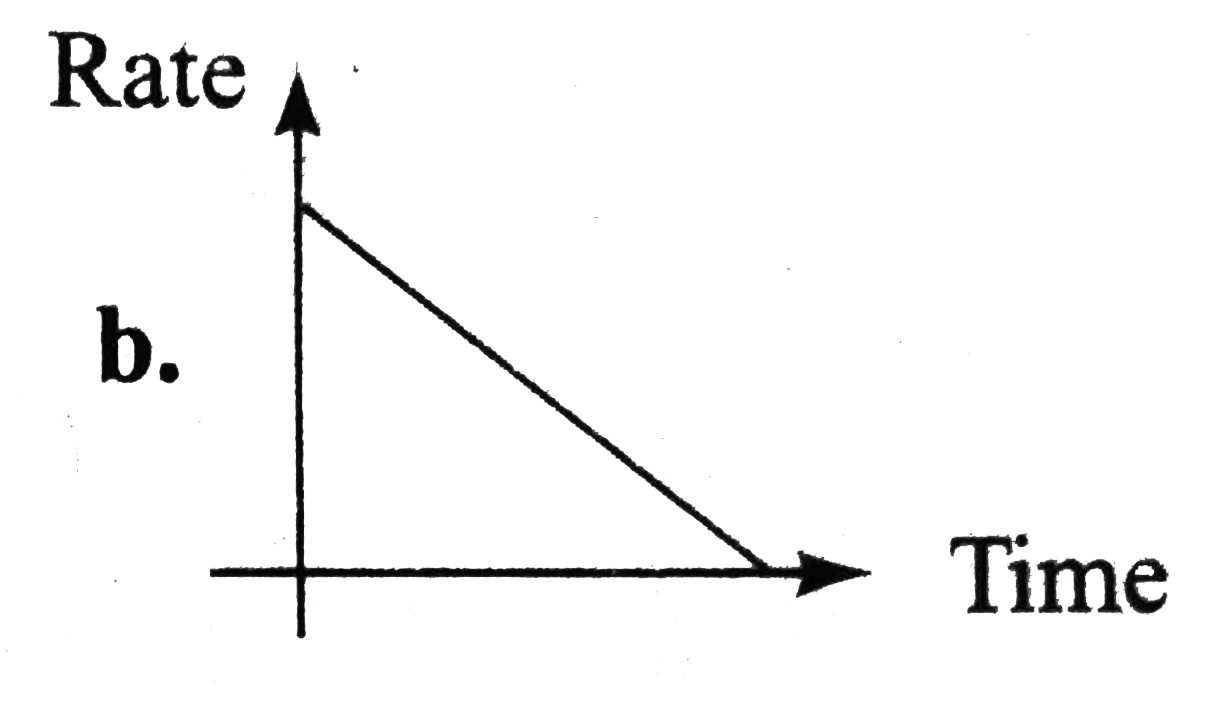 C
C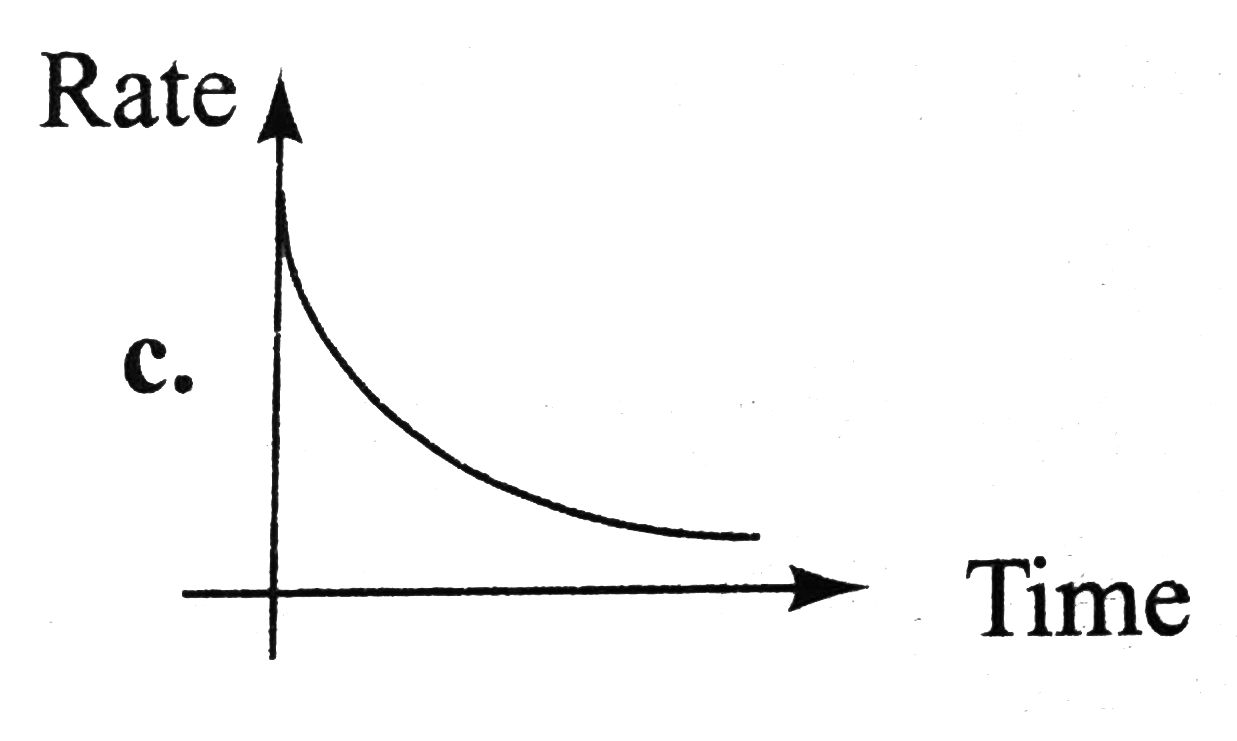 D
D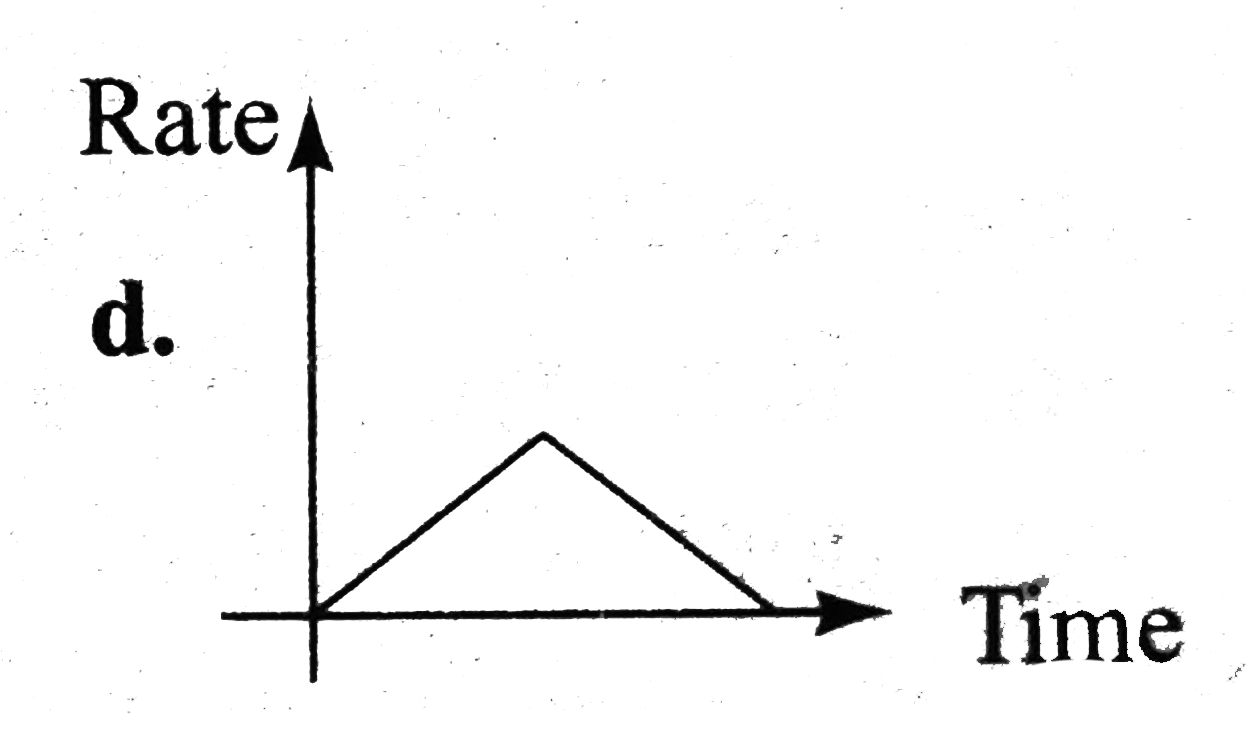
A simple LR circuit is connected to a battery at time t=0. The energy stored in the inductor reaches half its maximum value at time
ARL In [√2√2−1]BLR In [√2−1√2]CLR In [√2√2−1]DRL In [√2−1√2]The rate of decay (R) of nuclei in a radioactive sample is plotted against time (t). Which of the following best represents the resulting curve ?
A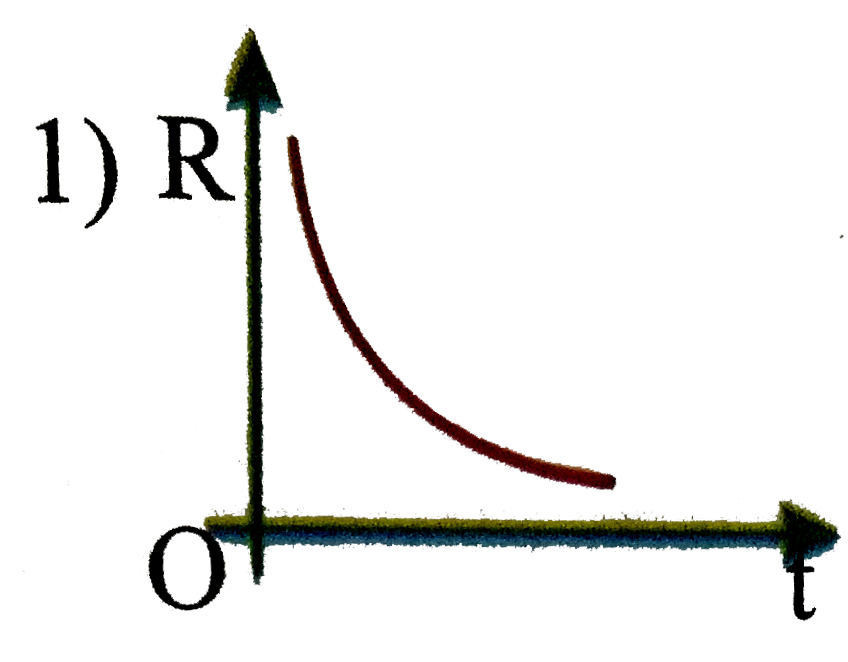 B
B C
C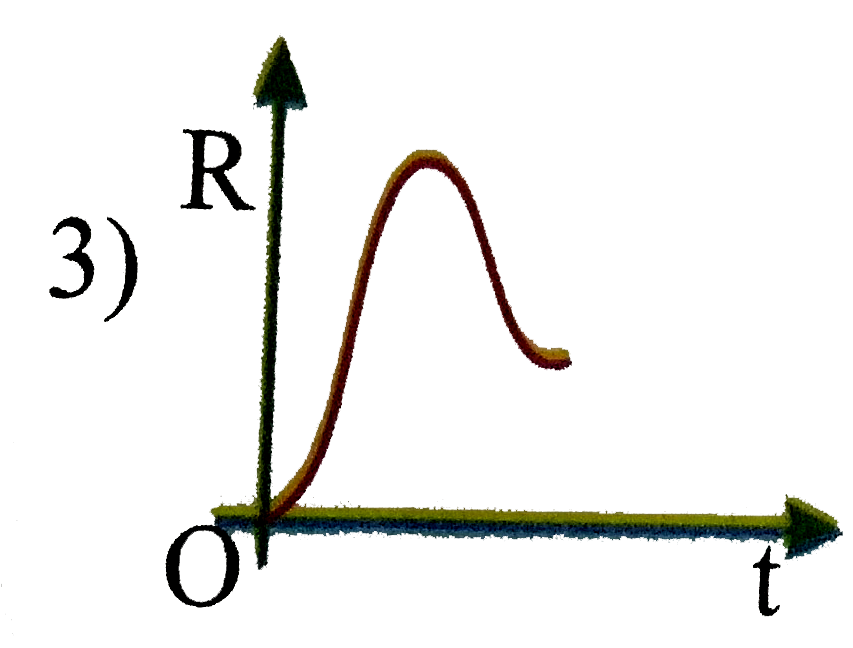 D
D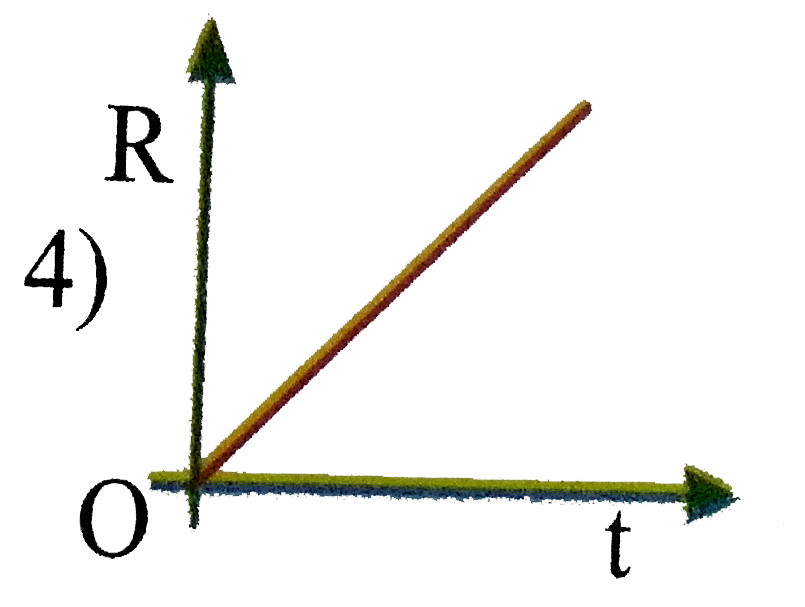
The rate of decay (R) of nuclei in a radioactive sample is plotted against time (t). Which of the following best represents the resulting curve ?
View SolutionAn ideal cell is connected to a capacitor through a voltmeter. The reading V of the voltmeter is plotted agains time. Which of the following best represents the resulting curve?
View SolutionWhen an electric heater is switched on, the current flowing through it ( i ) is plotted against time ( t ). Taking into account the variation of resistance with temperature, which of the following best represents the resulting curve
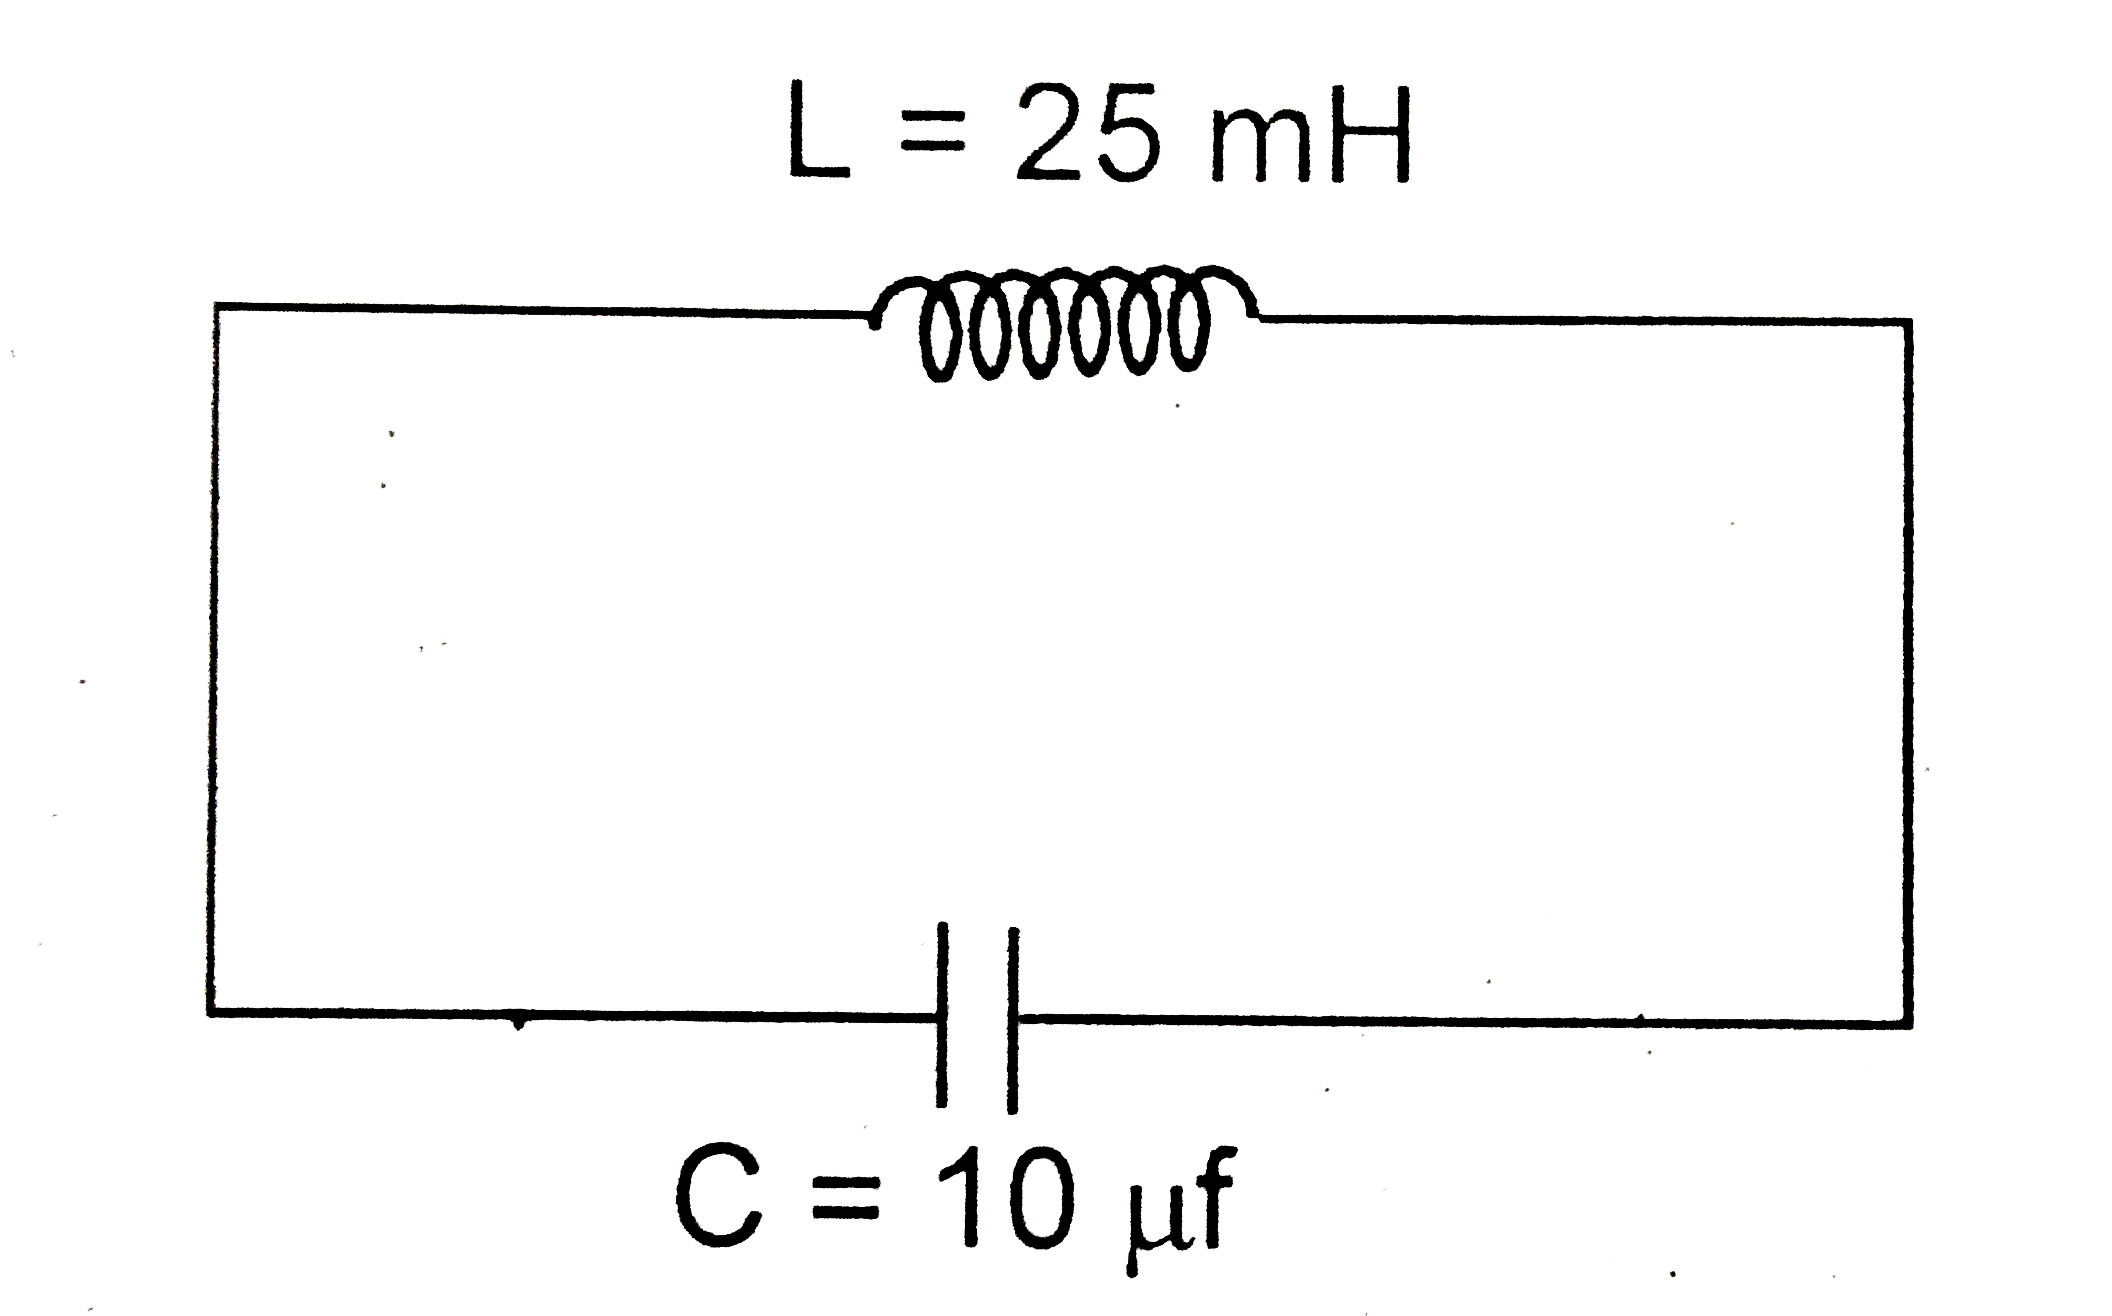
View SolutionIf maximum energy is stored in capacitor at t = 0 then find the time after which current in the circuit will be maximum.
View SolutionIn an L-R circuit connected to a battery of constant emf E, switched is closed at time t=0. If denotes the induced emf across inductor and I the current in the circuit at any time t. Then which of the following graphs shown the variation of e with i?
View Solution

_S01_061_Q01.png)