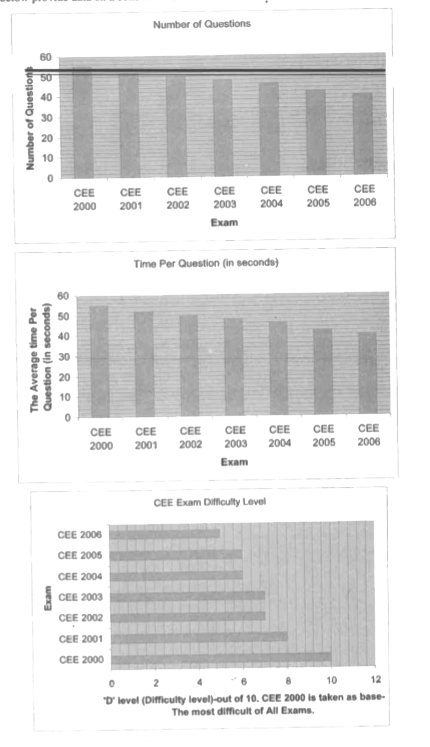
By approximately what percent did the number of questions decrease from CEE 2000 to CEE 2006?
11
22
27
33
The correct Answer is:C
Step by step video, text & image solution for By approximately what percent did the number of questions decrease from CEE 2000 to CEE 2006? by Maths experts to help you in doubts & scoring excellent marks in Class 12 exams.
Updated on:21/07/2023Similar Questions
The following table gives the number of households in USA during 2000-2014.
The following charts give the distribution of households based on the numbers of children for the years 2000 and 2014.

The following charts give the distribution based on the number of childre for the year 2000 and 2014.
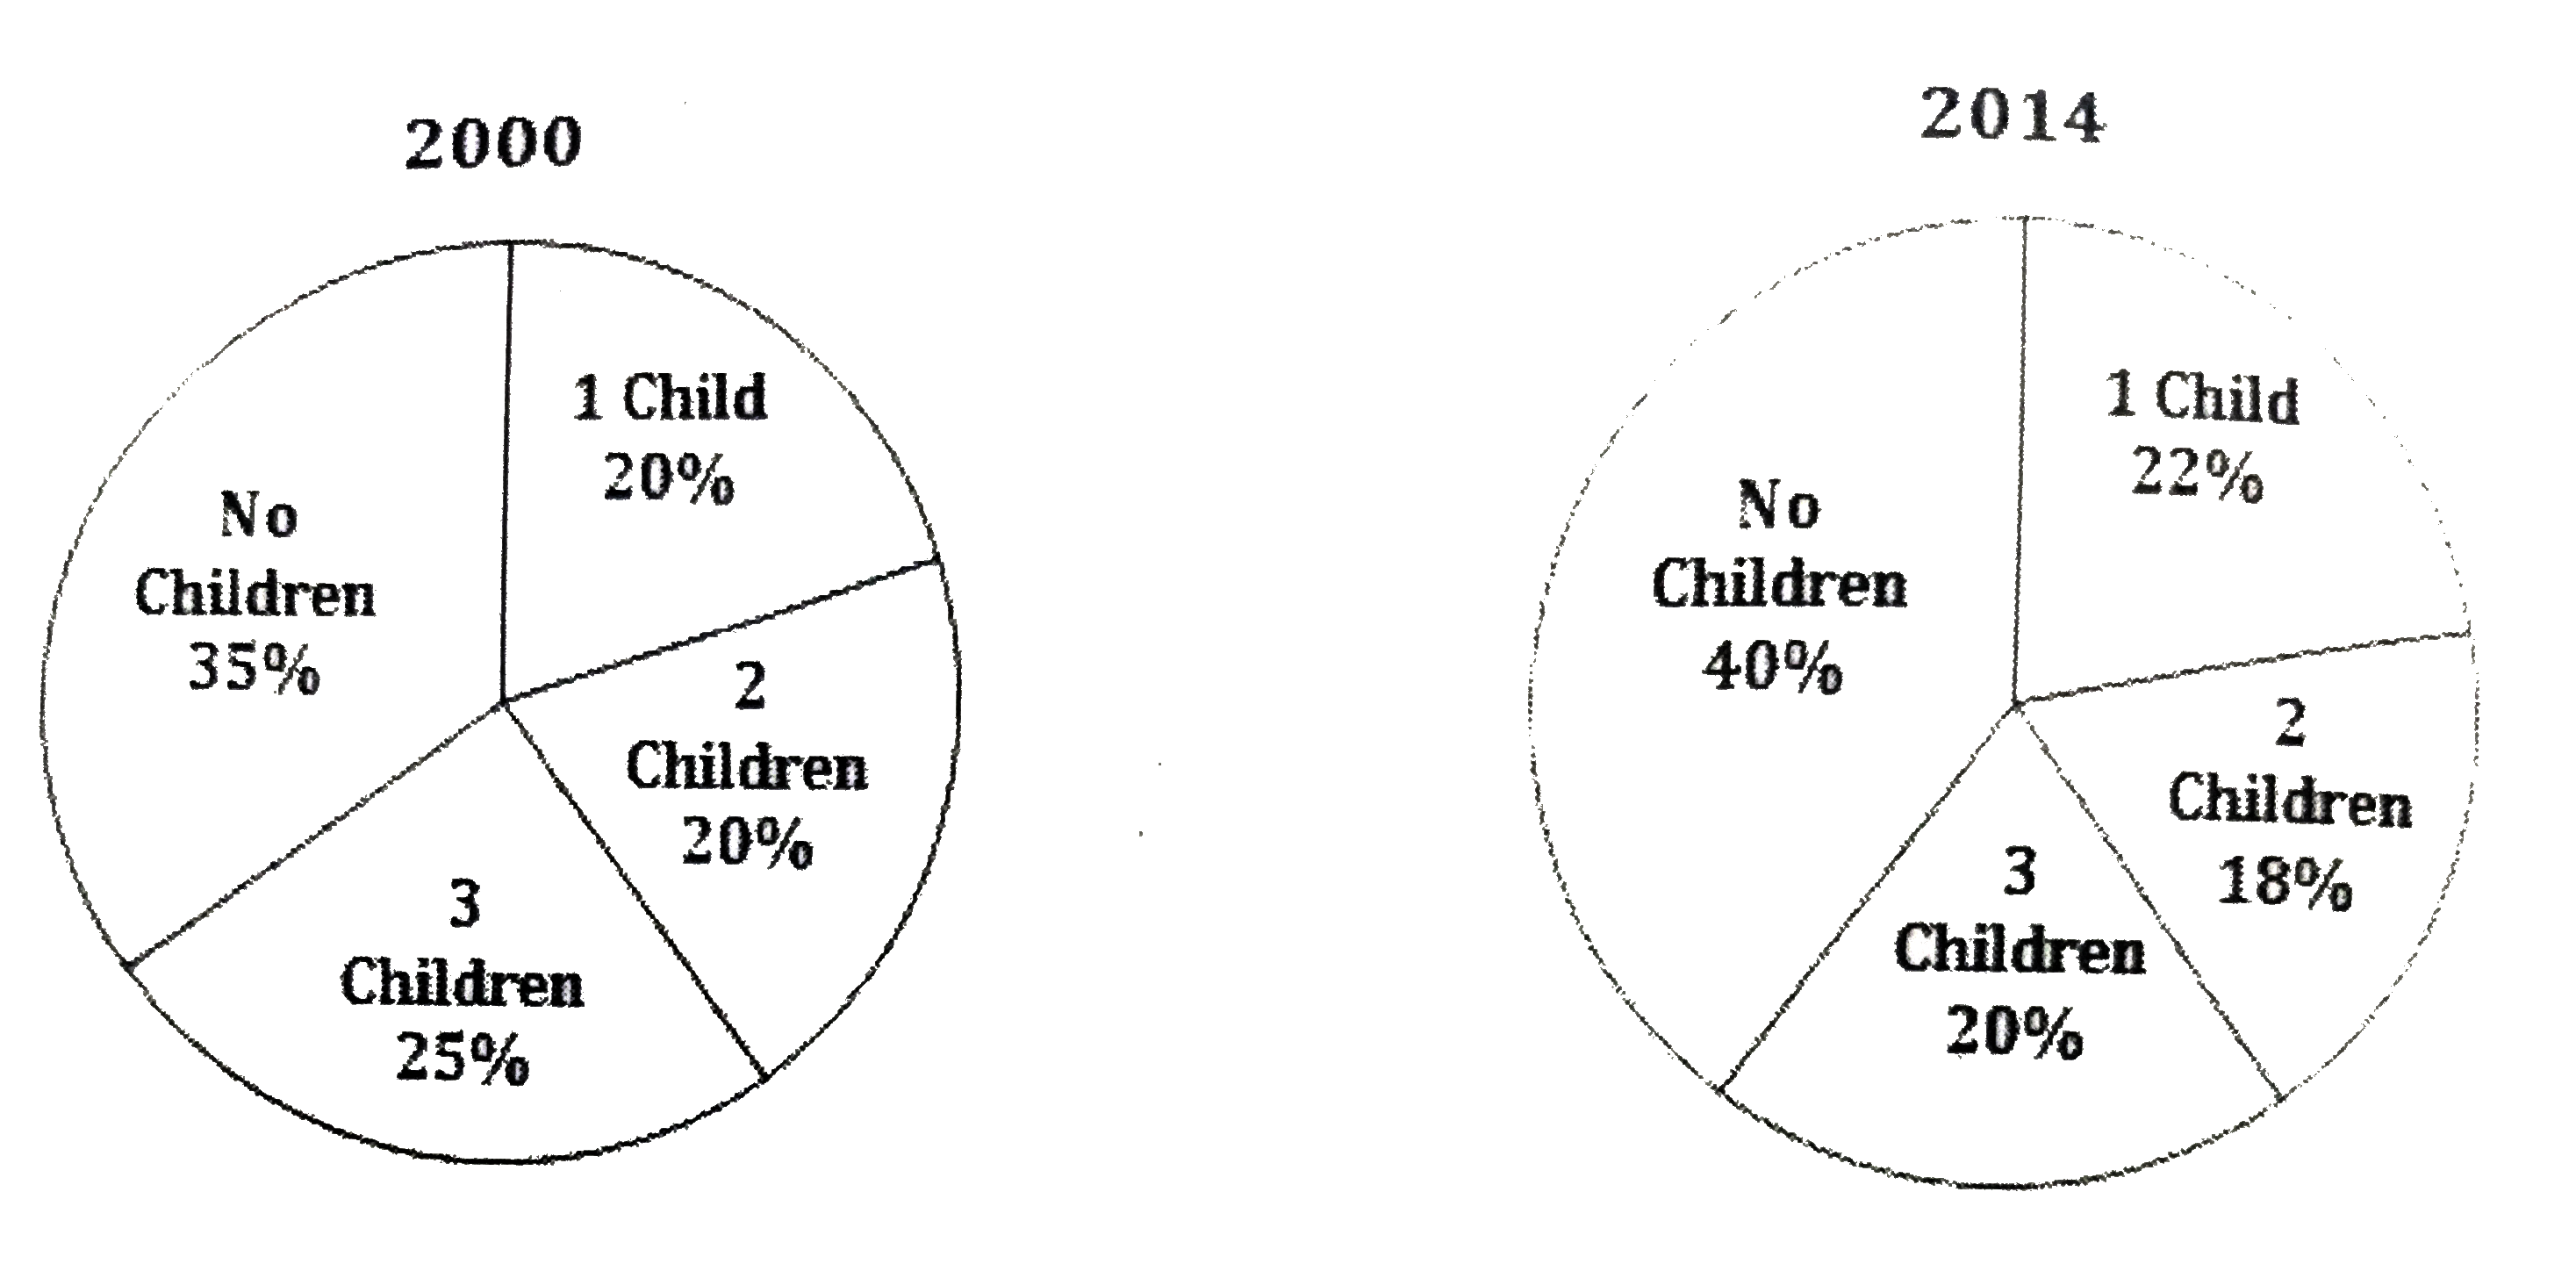
What was the approximate average annual percent increase in the number of households form 2000 to 2014 ?
View Solution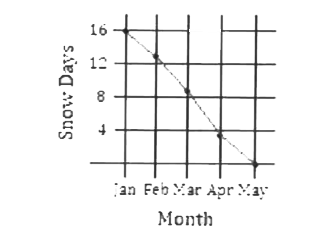
The line graph abvoe shows the average number of days that it snows at least 0.1 inch in Buffalo, NY from January to May. According to the graph, approximately what was the greatest decrease in the number of snow days from one month to the next month?
View Solution
Knowledge Check
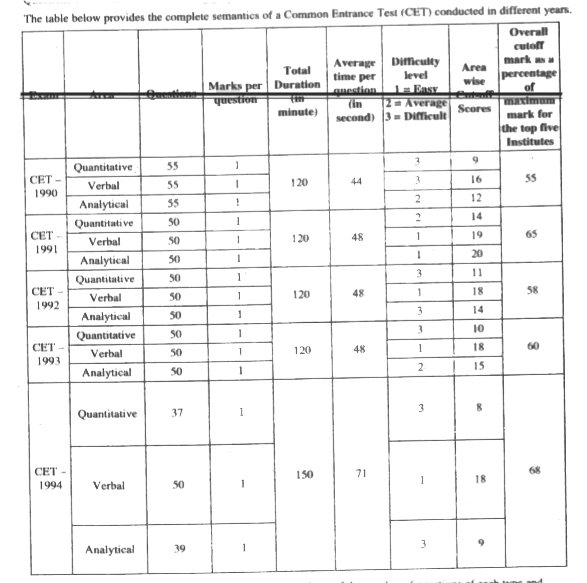
By approximatly what percent did the number of questions decrease in CET 1994 over the previous year?A0.16B0.19C0.35D0.4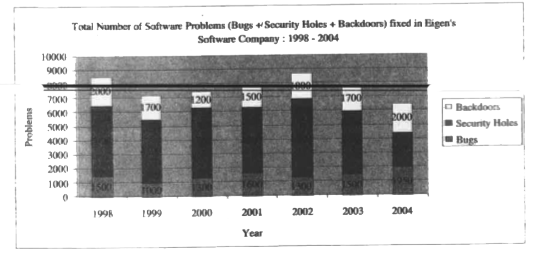
If the total number of software problems solved is a direct measure of the company's capability, then by approximately what percent did capability increase from 1999 to 2000 ?A10%B20%C30%D40%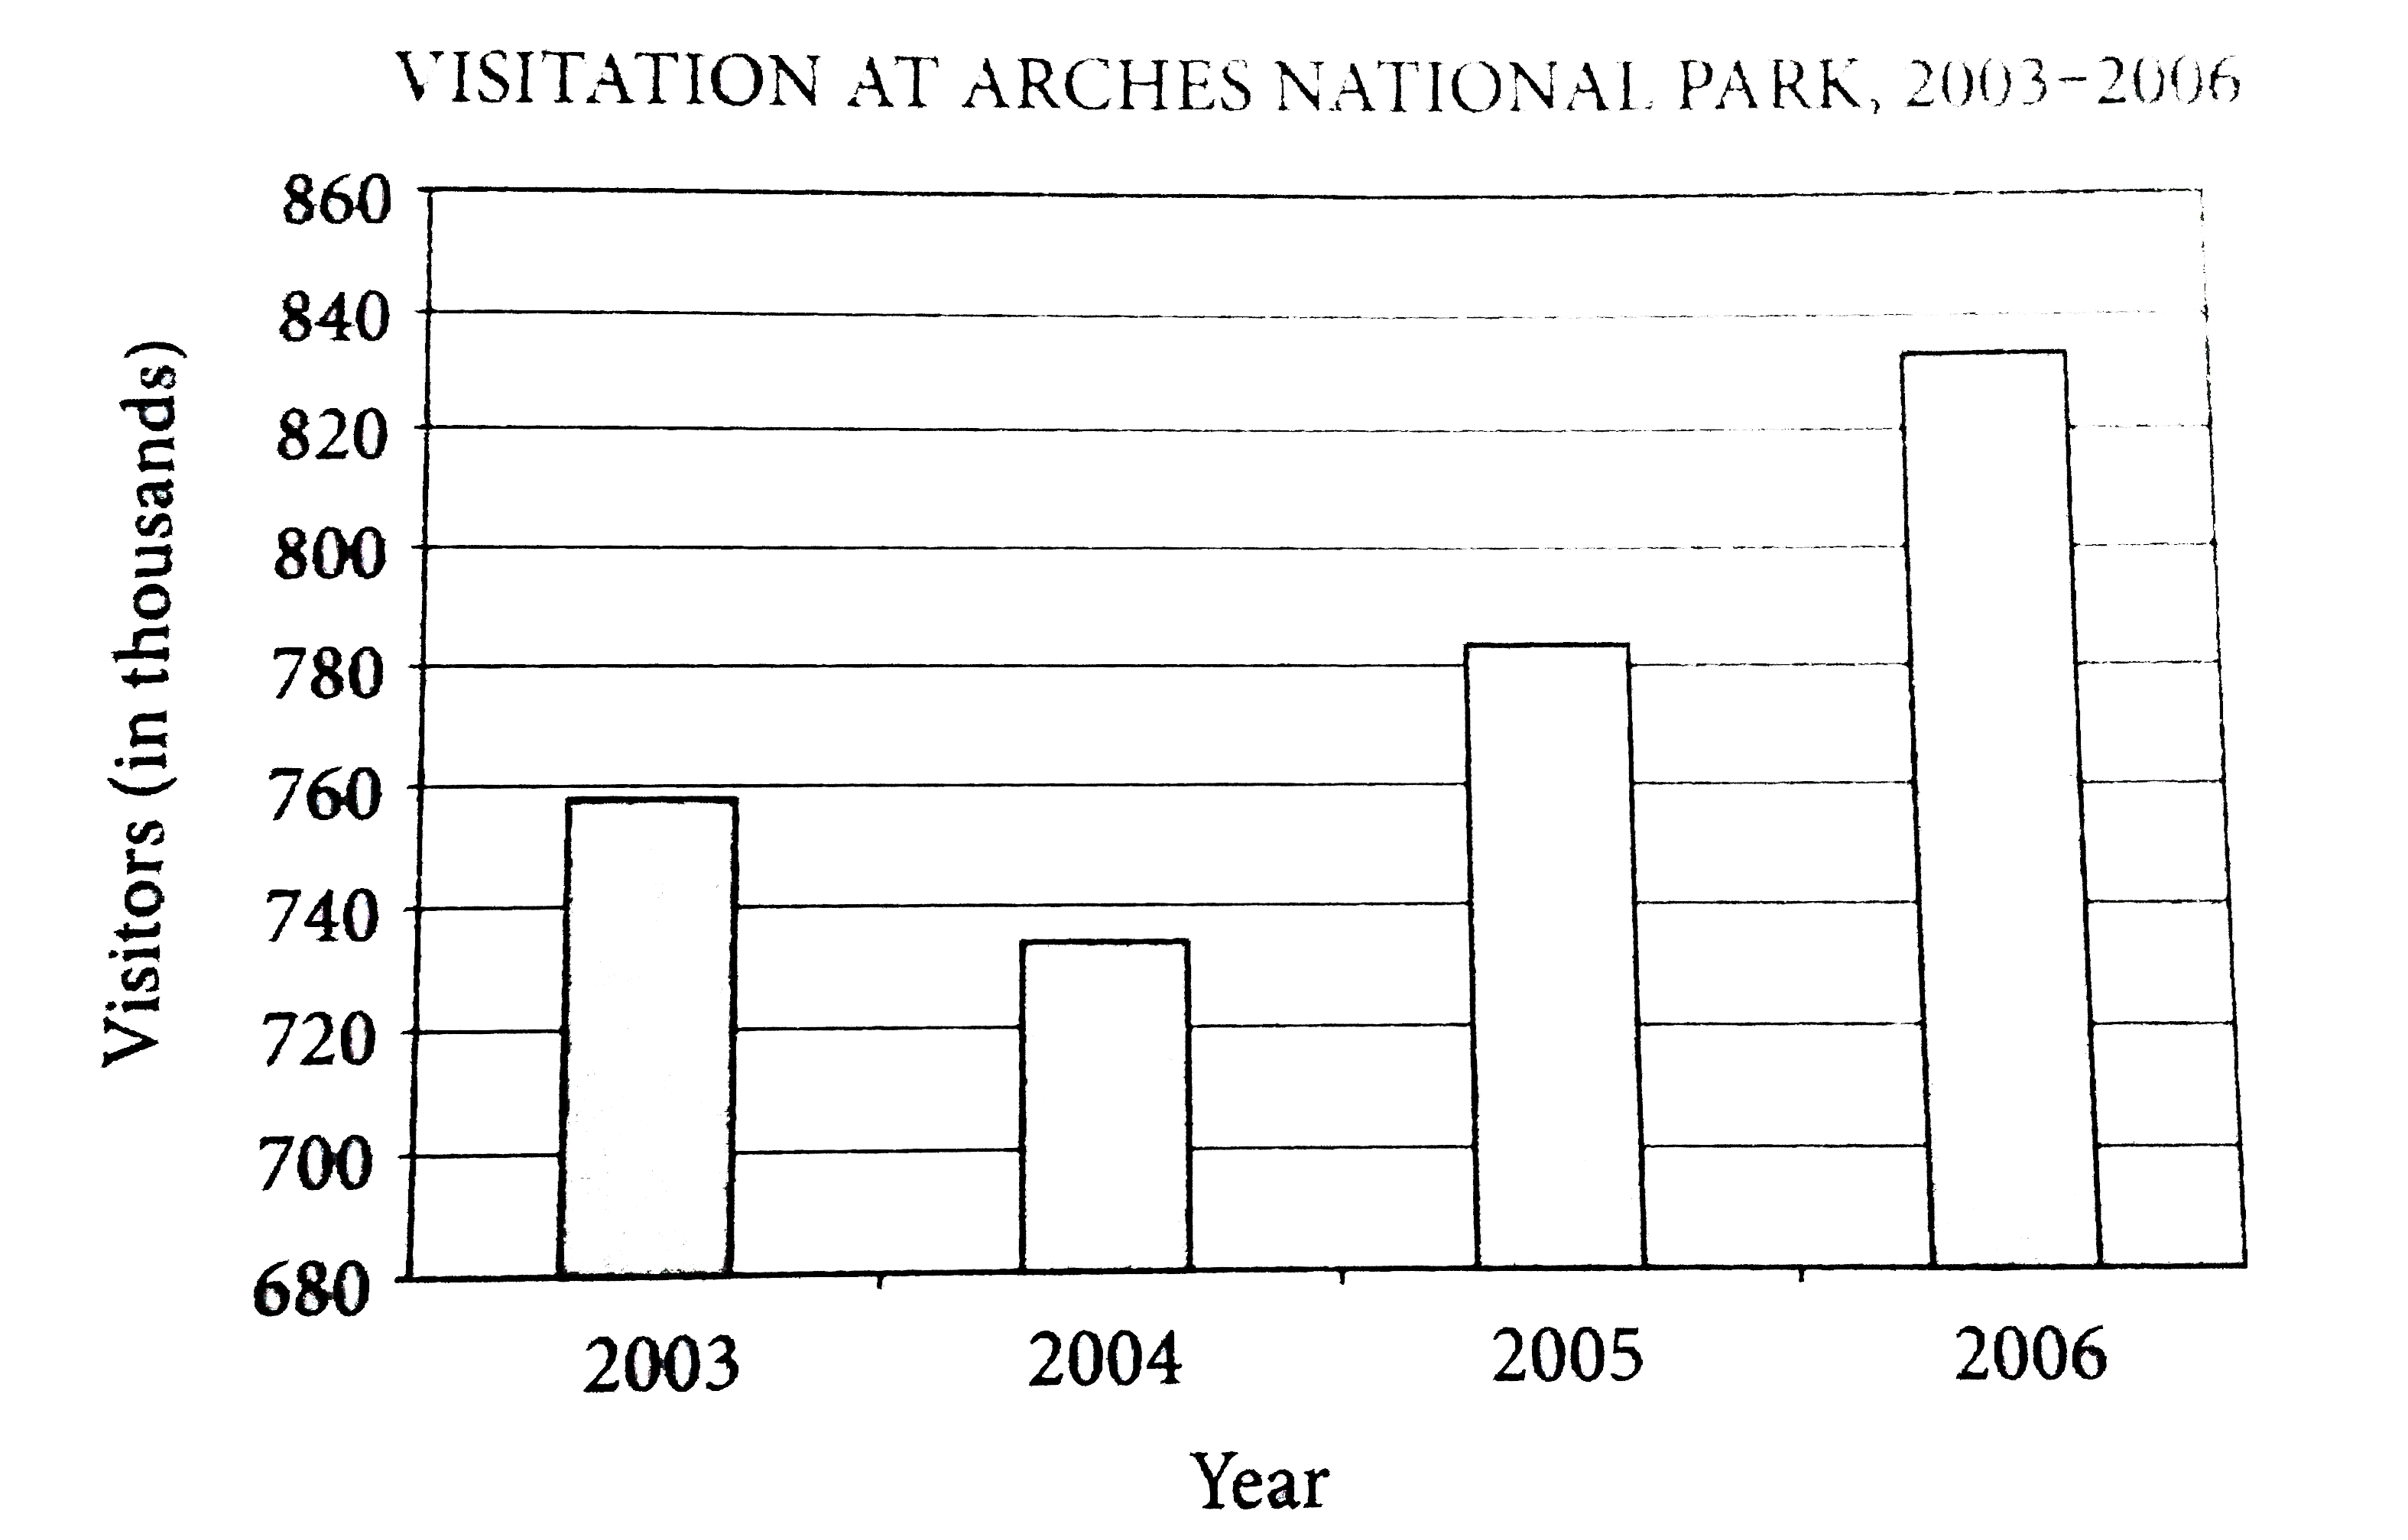
The chart above shows the number of visits, in thousands, at Arches National park for the years 2003 to 2006. Which of the following is the closest approximation of the percent increase in the number of visits from 2004 to 2006?A0.05B0.15C0.2D1.15
Jennifer's best long jump distance increased by 10% from 1990 to 1991 and by 20% from 1991 to 1992. By what percent did her best long jumb distance increase from 1990 to 1992?
View Solution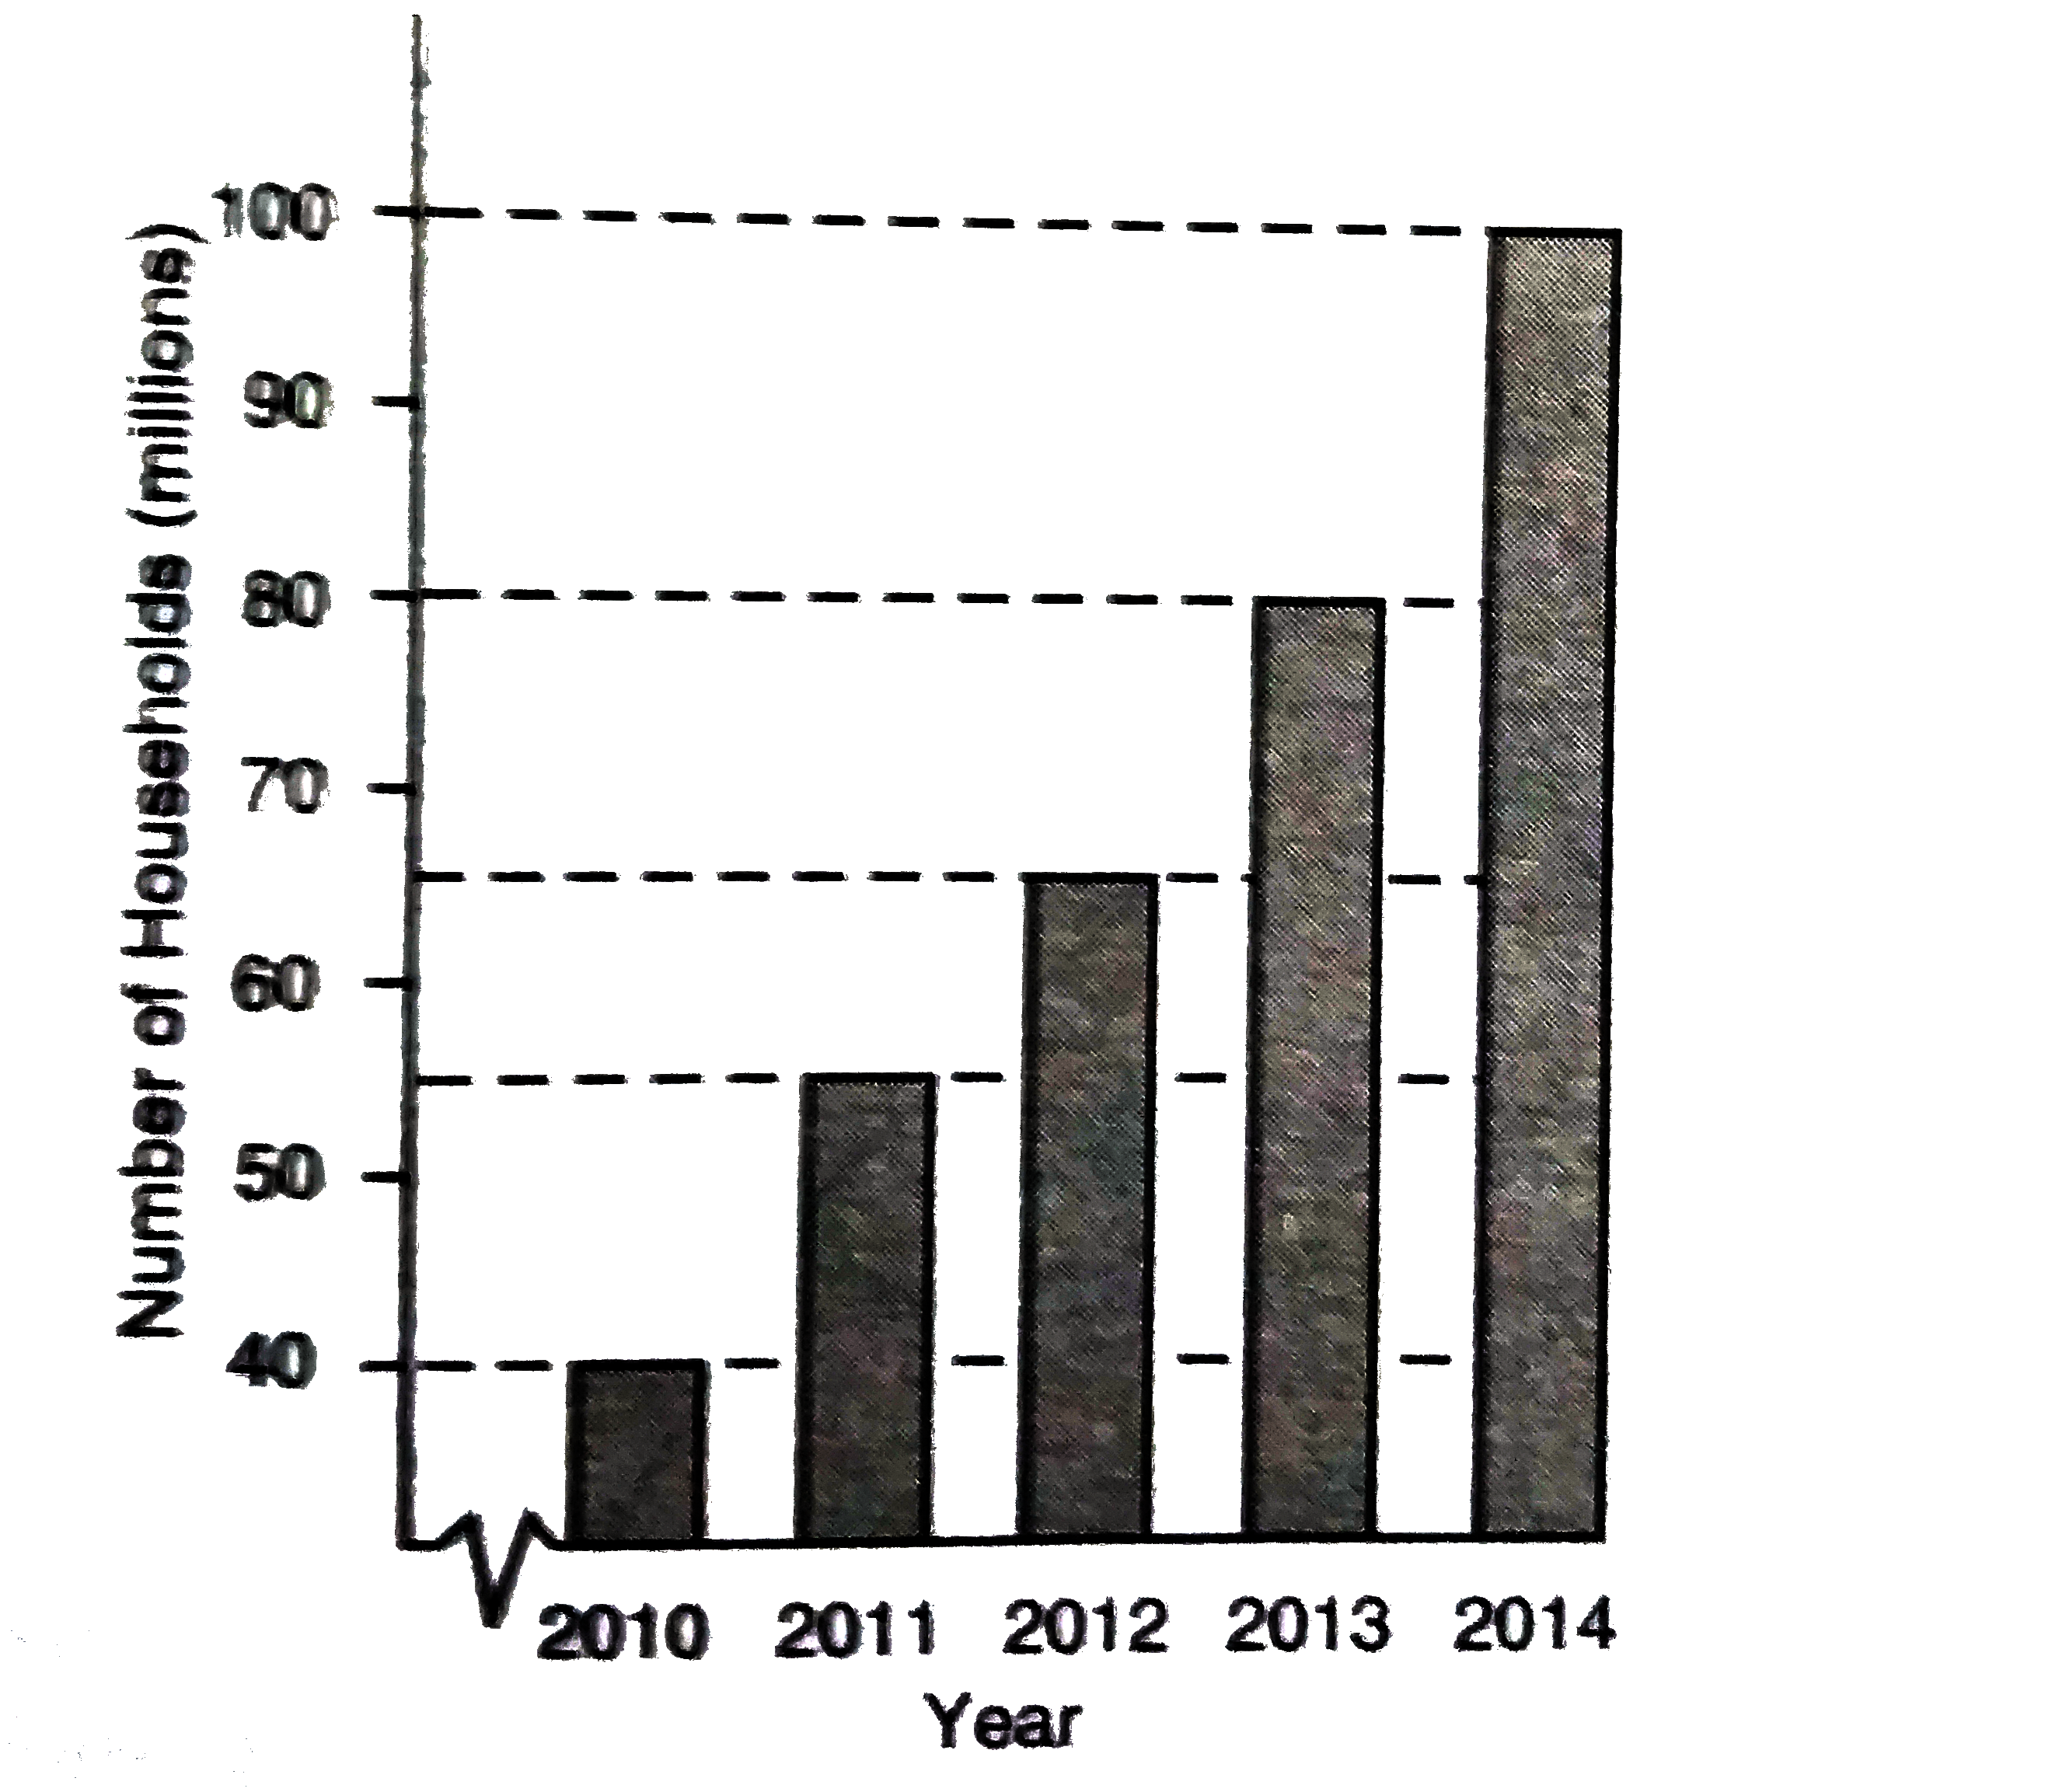
The graph above shows the number of U.S. households with laptop computers for the years 2010 to 2014.
Q. What was the percent of increase in the number of households with laptops from 2010 to 2014?
View Solution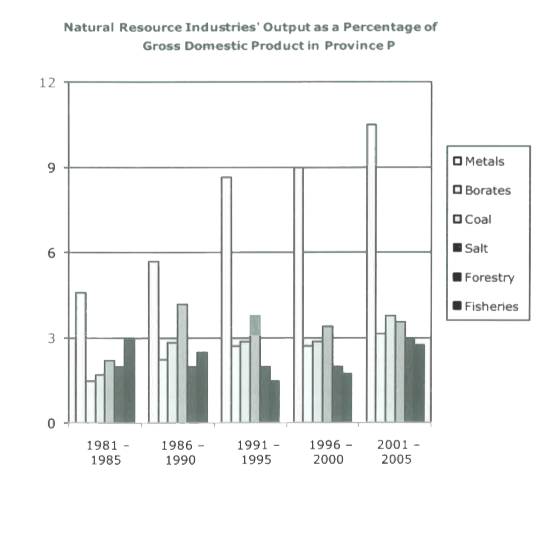
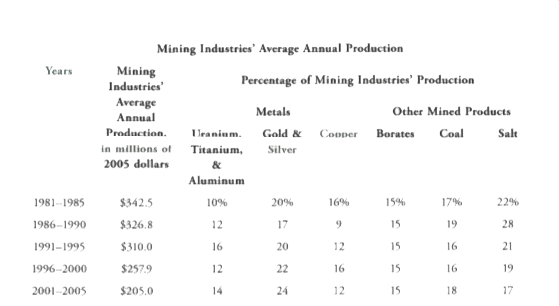
Approximately what percent of average annualGDP of Province P from 1996 - 2000 came from copper production?
View Solution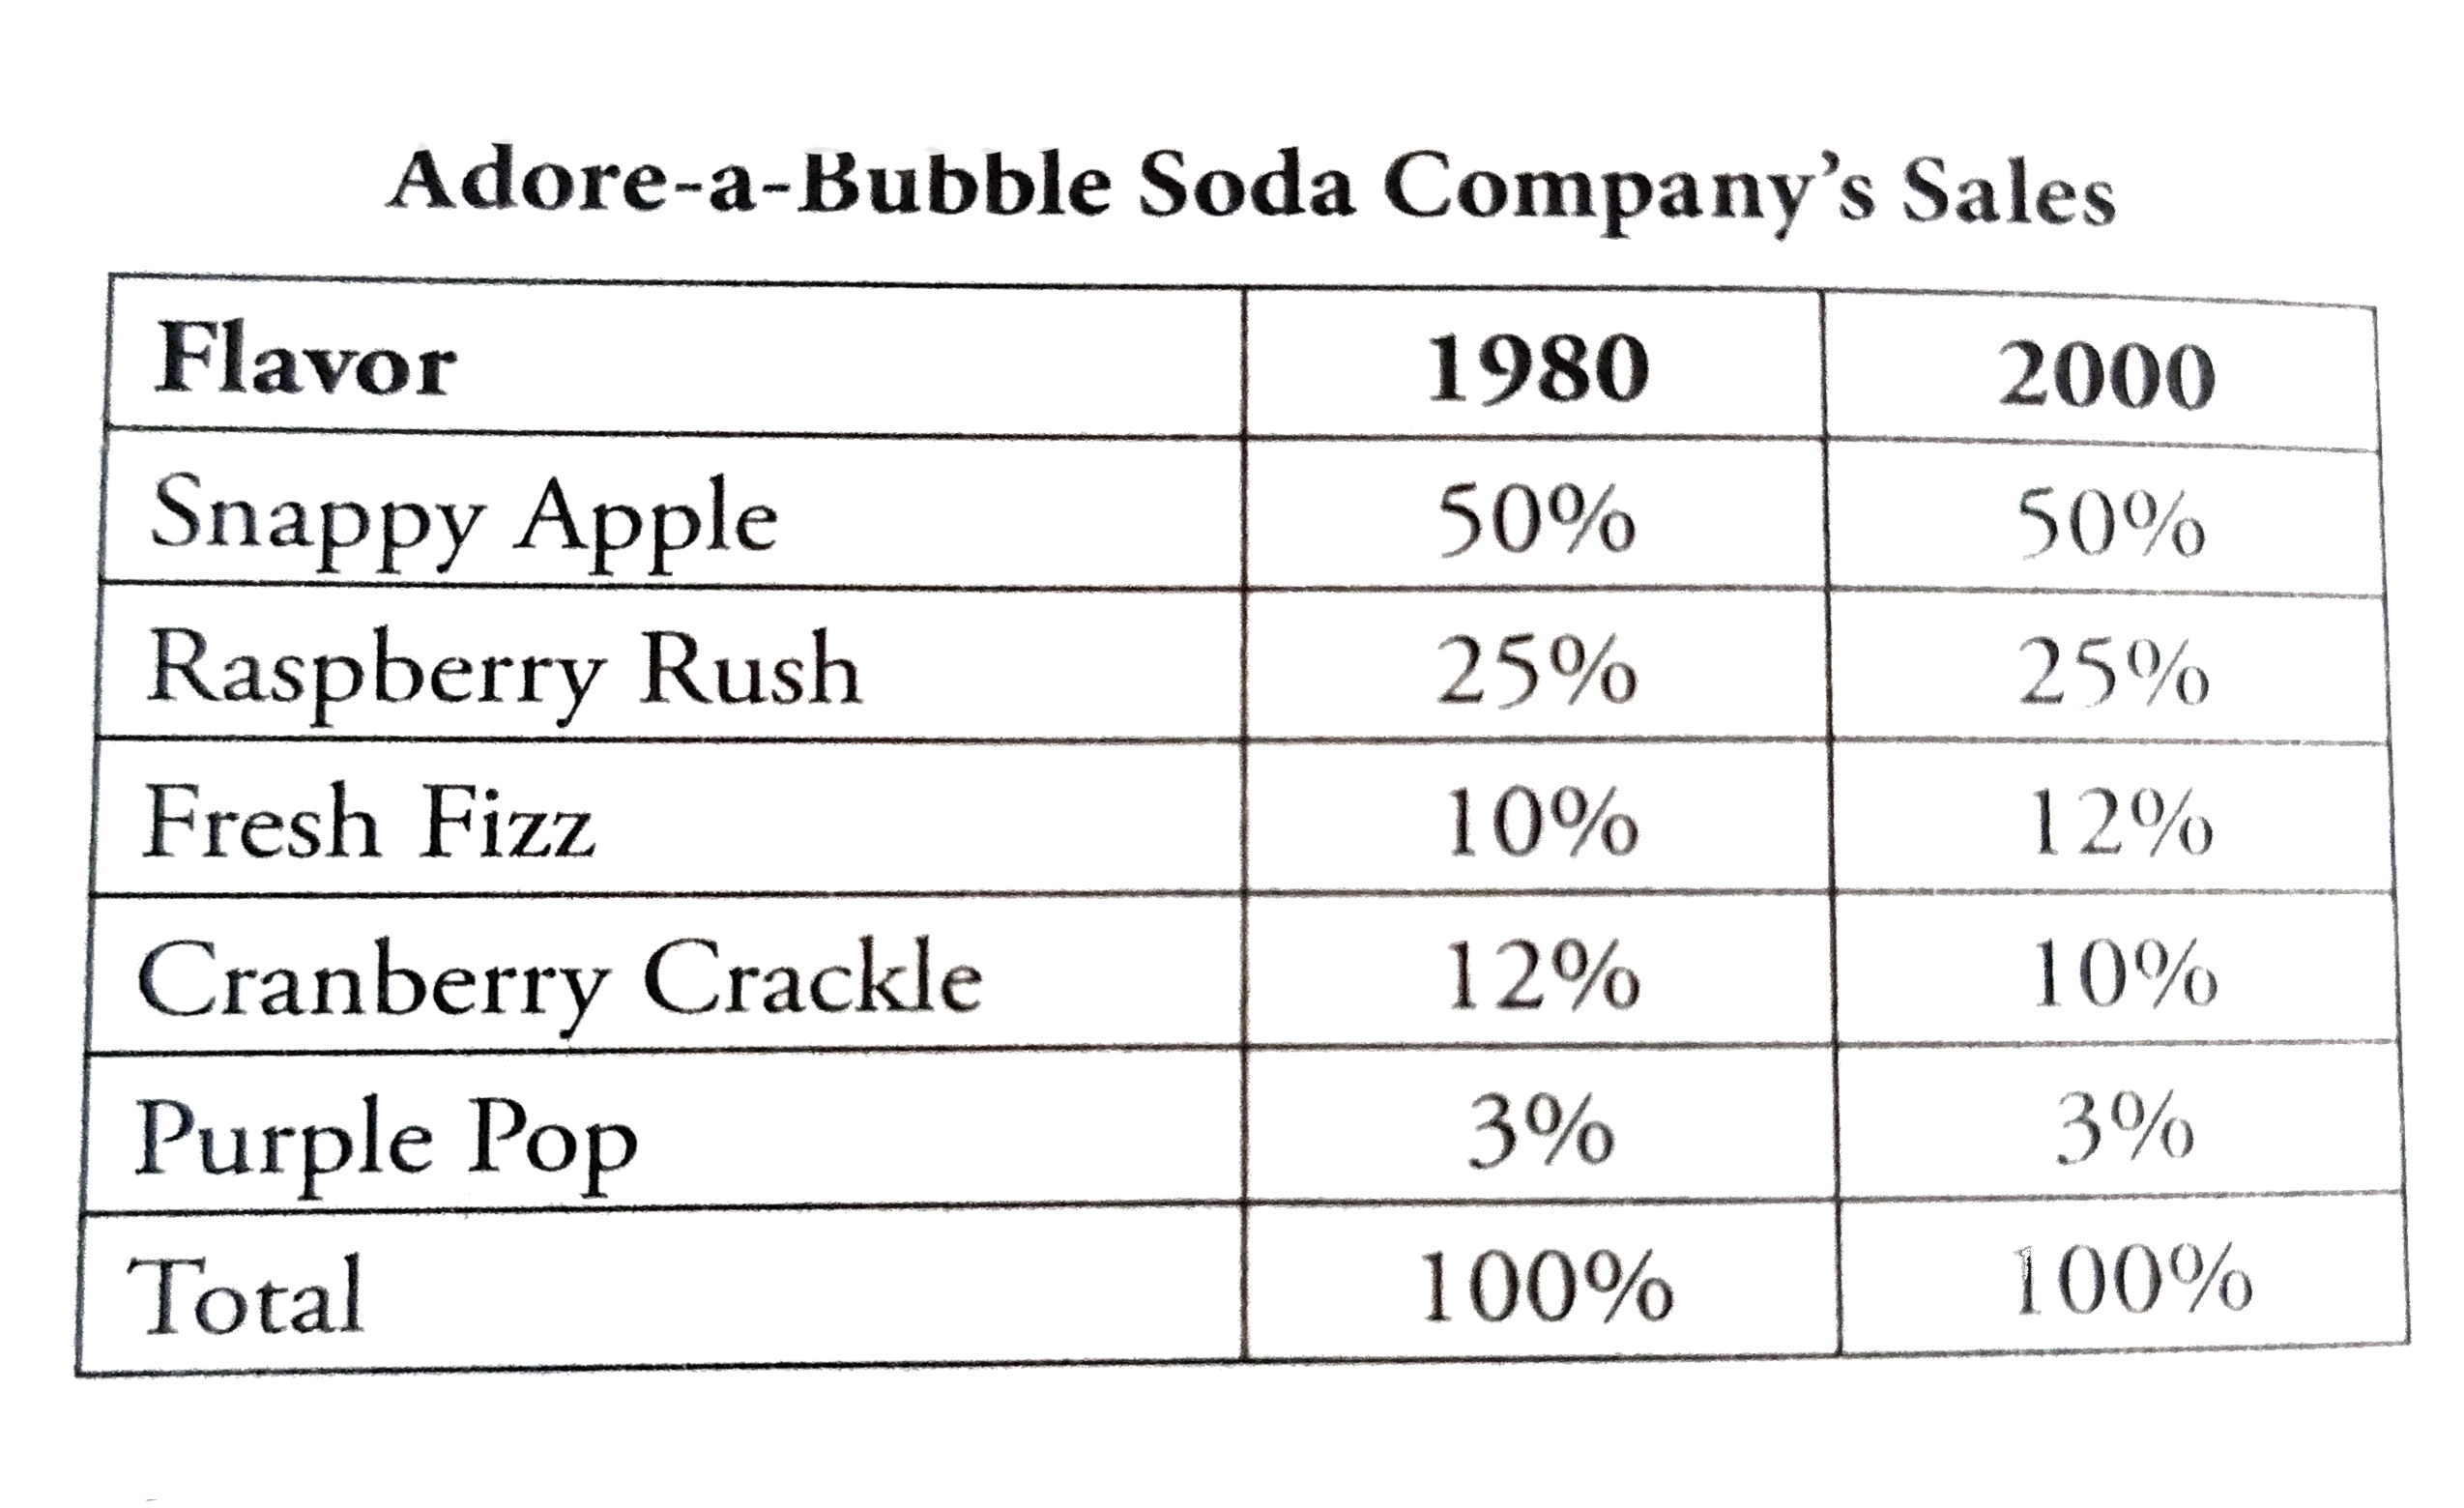
The table above shows the Adore-a-Bubble Soda Company's sales for 1980 and 2000. The company sold 200 trillion cans of soda in 1980. If the company sold 40 trillion more cans of soda in 2000 than it did in 1980, then for which flavor did the number of cans of soda increase by 20% from 1980 to 2000?
View Solution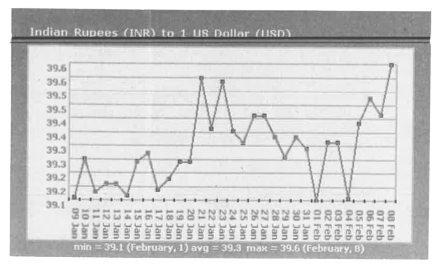
On February 8, the dollar value was approximately what percent of the dollar value on January 9?
View Solution
