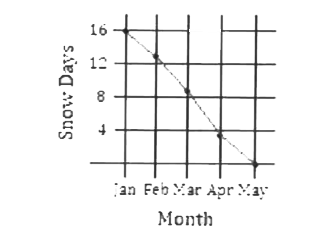
The line graph abvoe shows the average number of days that it snows at least 0.1 inch in Buffalo, NY from January to May. According to the graph, approximately what was the greatest decrease in the number of snow days from one month to the next month?
2
3
4
6
The correct Answer is:D
Step by step video, text & image solution for The line graph abvoe shows the average number of days that it snows at least 0.1 inch in Buffalo, NY from January to May. According to the graph, approximately what was the greatest decrease in the number of snow days from one month to the next month? by Maths experts to help you in doubts & scoring excellent marks in Class 12 exams.
Updated on:21/07/2023Similar Questions
A botanist is cultivating a rare species of plant in a controlled environment and currently has 3000 of these plants. The population of this species that the botanist expects to grow next year, Nnext year, can be estimated from the number of plants this year, Nthis year, by the equation below.
Nnext year=Nthis year+0.2(Nthis year)(1−Nthis yearK)
The constant K in this formula is the number of plants the environment is able to support.
According to the formula, what will be the number of plants two years from now if K = 4000 ? (Round your answer to the nearest whole number.)
View SolutionNumber of Portable Media Players Sold Worldwide Each Year from 2006 to 2011

According to the line graph above, the number of portable media players sold in 2008 is what fraction of the number sold in 2011 ?
View Solution
Knowledge Check
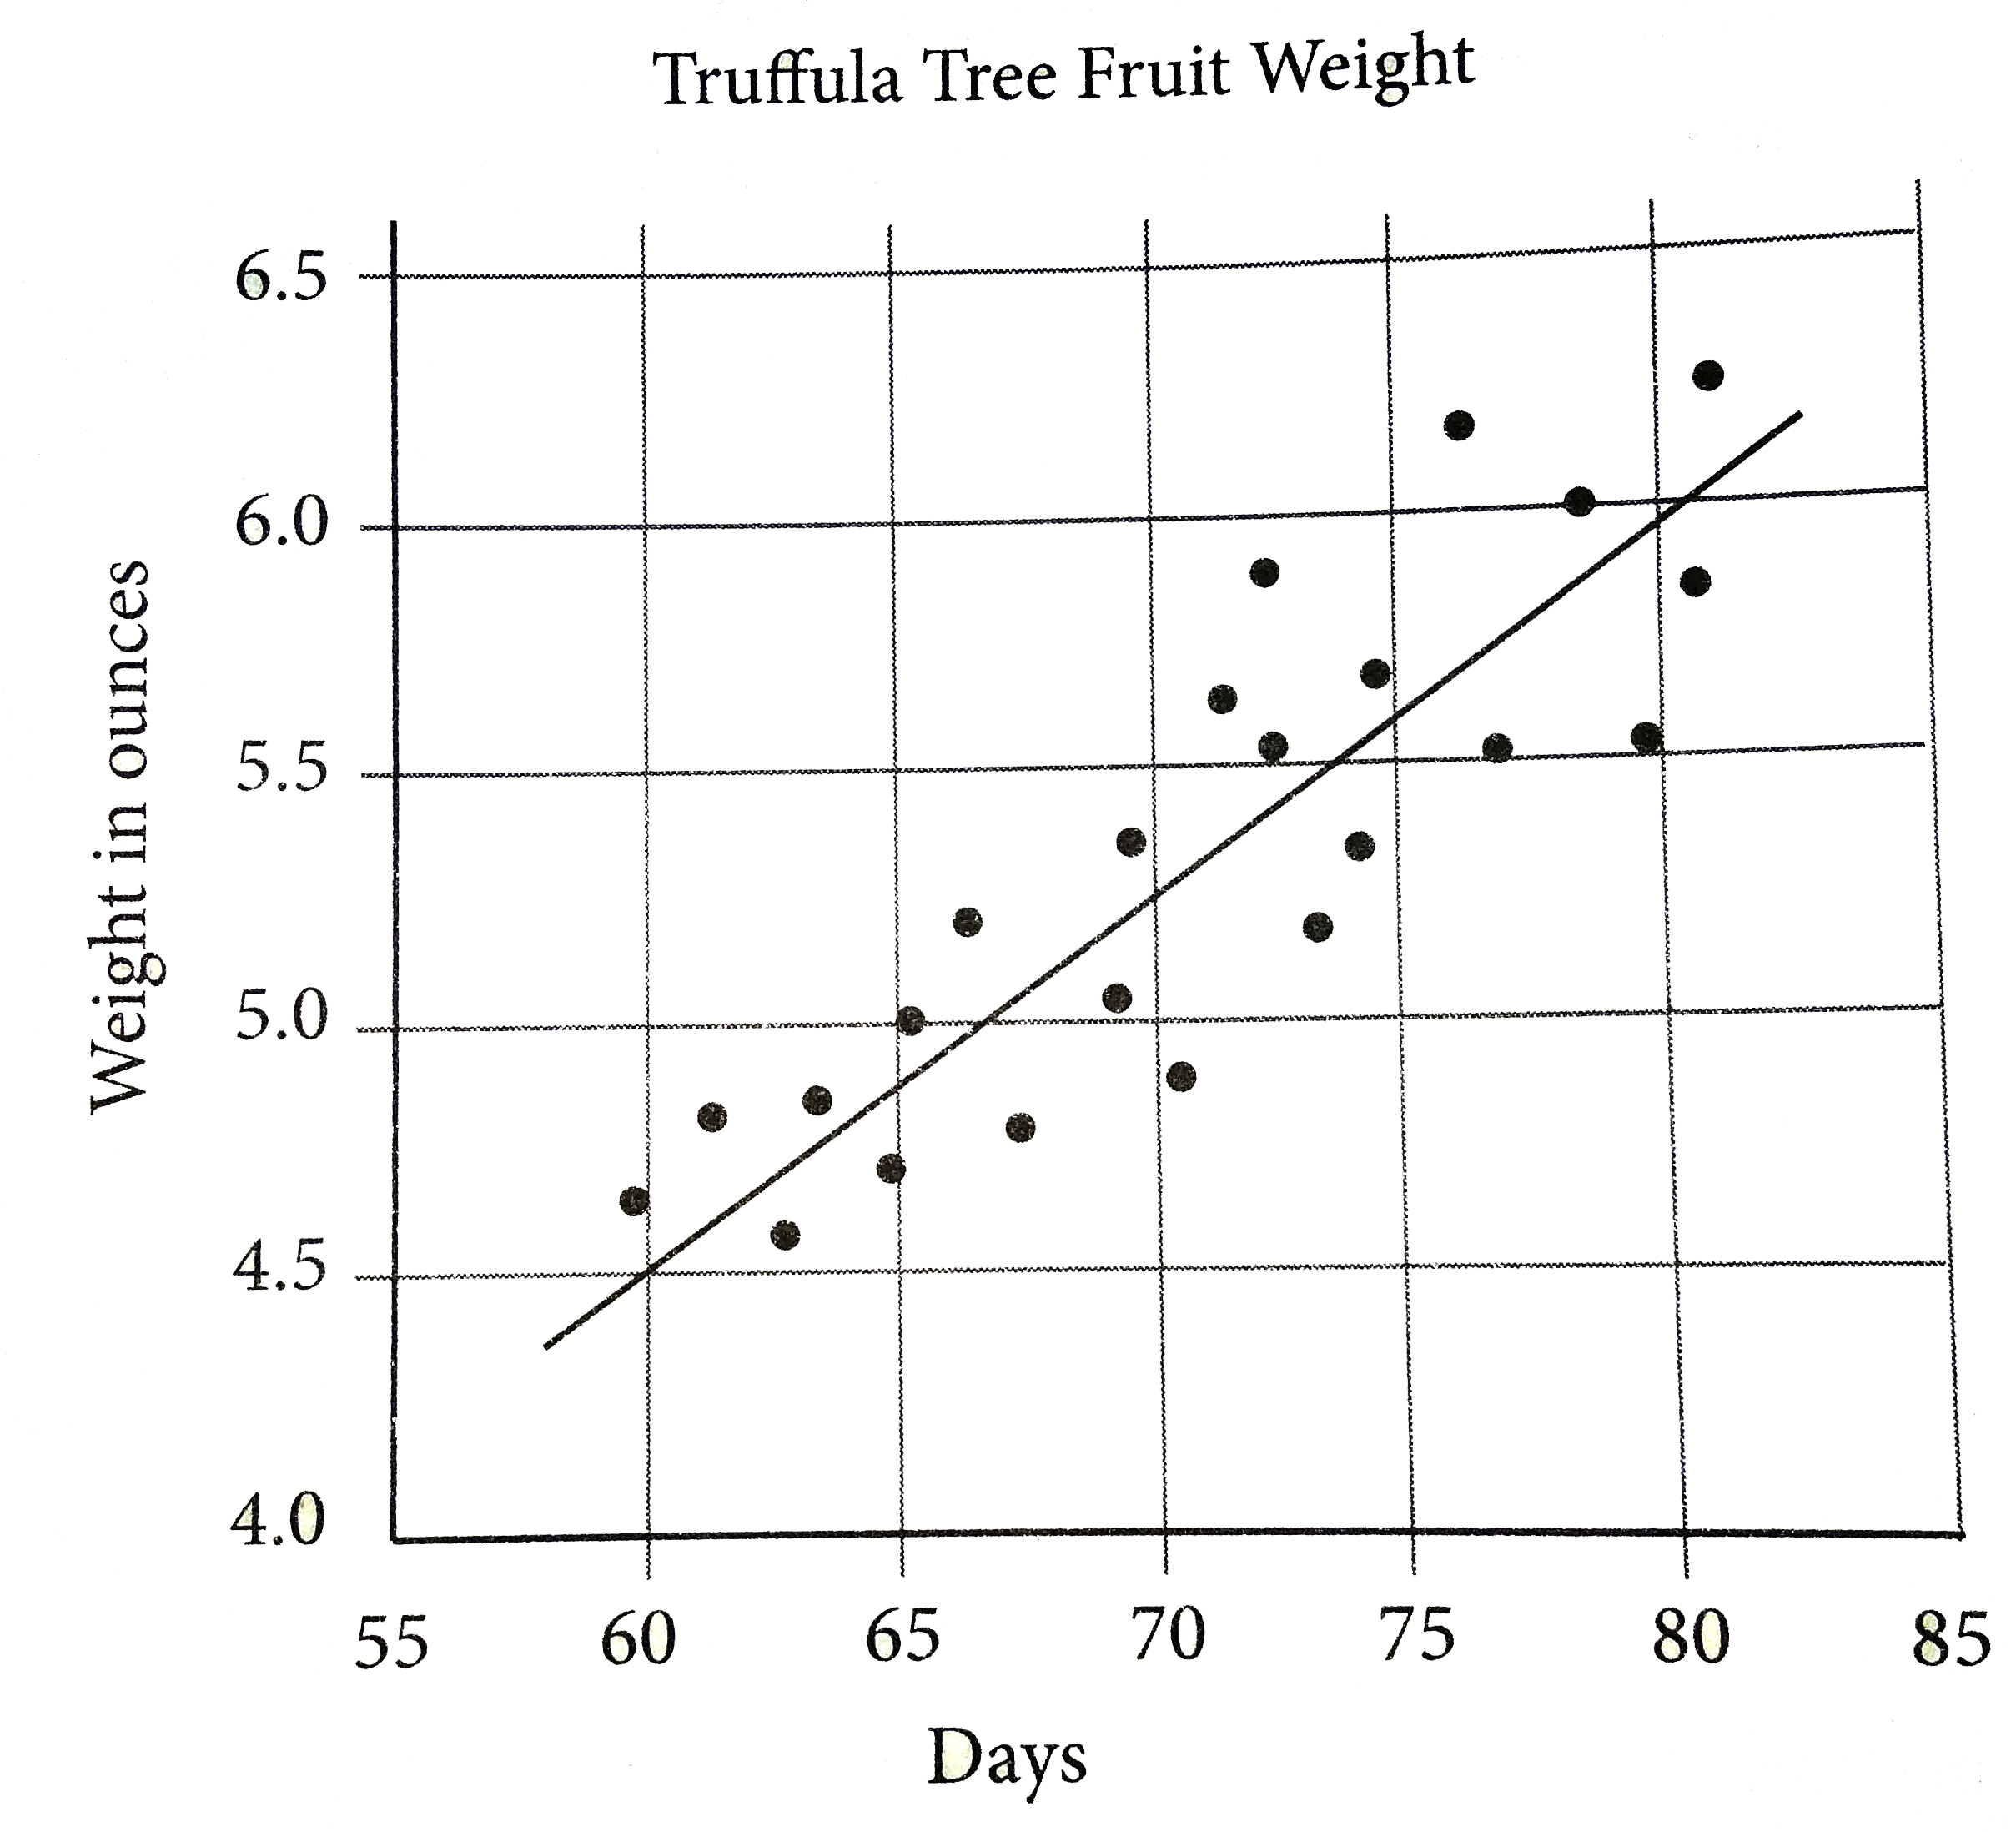
The scatterplot above shows the weight, in ounces,of the fruits on a certain truffula tree from days 55 to 85 after flowering. According to the line of best fit in the scatterplot above, which of the following is the closest approximation of the number of days after flowering of a truffula fruit that weighs 5.75 ounces?A63B65C77D81A certain store sells televisions ranging in price for $500 to $5,000 in increment of $500. The graph above shows the total number of television sold at each price durind the last 12 months. Approximately how much more revenue did the store collect from the television it sold price at $3,500 then it did from the television it sold price at $1,000?
A$175lt000B250000C275000D350000A coffee distributes randomly polled 200 employees from each of two companies and asked each employee how many cups of coffee he or she drinks per day. The data is shown in the table below.
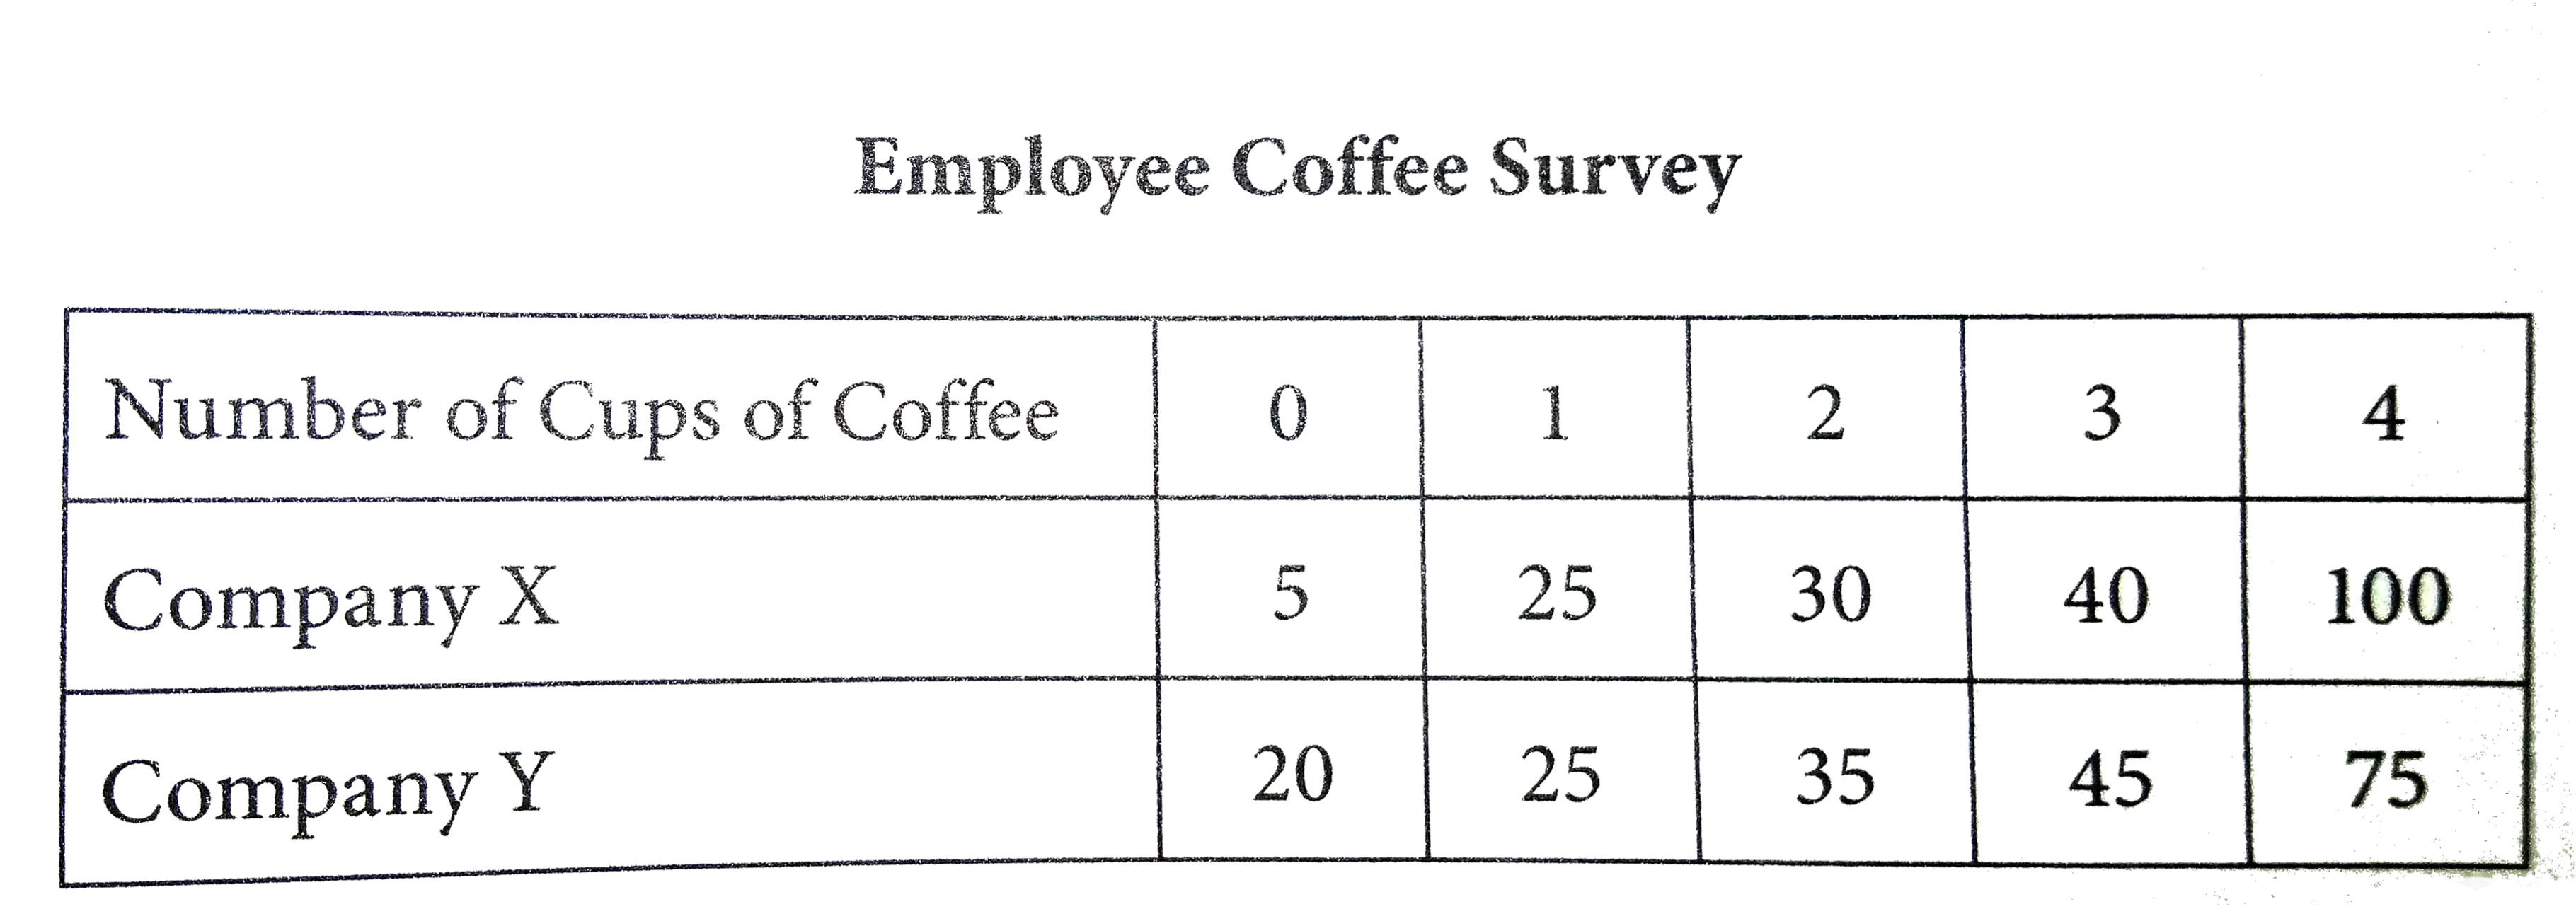
The are 4,000 employees at Company X and 3,000 employee at Company Y.
Q. Of the employees polled at Company X, approximately what is the average number of cups of coffee consumed per employee on a given day?A1B2C3D4
Mr. Martinson is building a concrete patio in his backyard and deciding where to buy the materials and rent the tools needed for the project. The table below shows the materials’ cost and daily rental costs for three different stores.
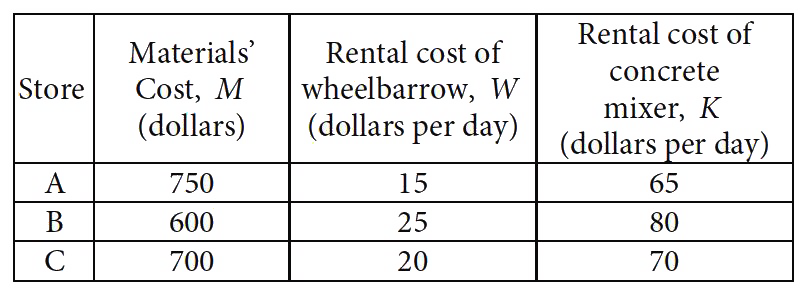
The total cost, y, for buying the materials and renting the tools in terms of the number of days, x, is given by y=M+(W+K)x .
If the relationship between the total cost, y, of buying the materials and renting the tools at Store C and the number of days, x, for which the tools are rented is graphed in the xy-plane, what does the slope of the line represent?
View Solution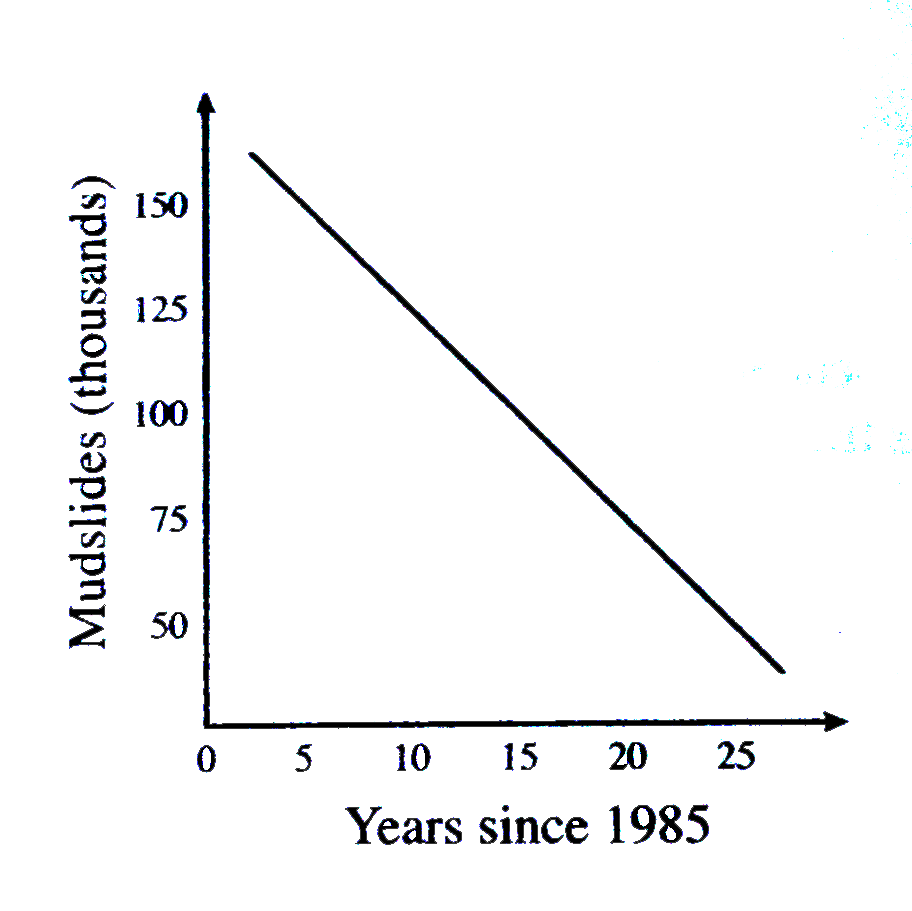
The number of mudslides in a certain country for the past 25 years is approximated by the graph shown above . The graph displays the number of mudslides (in thousands) from 1985 to 2010. Based on the graph , which of the following is closest to the average yearly decrease in the number of mudslides ?
View SolutionThis passage is adapted from a 2018 article summarizing two different proposals for solving problems with maintaining New York City's mass transit system.
The history of the New York City subsaw system, quickly told: the first stations opened in 1904, and over the next century, it expended to 472 stations, more than any other subway system in the world, with 850 miles of track. Operating 24 hours a day seven days a week, with an average weekday ridership of approximately 5.7 million, it is the plant's 7th-busiest rapid transit system. While the system is, on many levels, an amazing chievement, it is also beset by a problem that harms both quality of life and economic activity. Such a large system must inevitably suffer from service interruptions and delays, normal wear and tear combined with the sheer age of the system necessitates regular maintanance. However, there is no consensus as to the best way to accomplish the required repairs. The current maintanance scheme is designed to minimize service interruptions. A subway line in need of repair will be taken out of sevice during a comaratively less busy time, such as nights or weekends, while another line is re-routed to cover as many as possible of the missing line's stops. The main advantage to this approach is that trains are not taken out of service during rush hour, when most subway trips occur, subway service generally remains predictable and commuters are, for the most part, able to use the system to get to their desinations on time.
But critics are quick to point out the disadvantages to this approach. Perhaps most obvious is the confusion caused by trains swithing lines. The labyrinthine system is hard enough to navigate at the best of times. especially for tourists A subway rider on the A terain naturally expects the train to make stops on teh A line. If instead, it is diverted temporatily to the F line, the rader may find herself miles from her intended destination.
While annoying, the confusion arising from route switching is hardly the most serious problem with the current approach to repairs. Because the system runs 24 hours a day, routine maintenance can generally be done only during the temporary closures on nights and weekends. This means that more serious repair and crucial preventative maintenance is often neglected. Problems that could have been fixed or prevented reasonably expeditiously given a slightly longer closure wind up leading to major breakdowns and service interruptions later on.
On rare occasions, such breakdowns have resulted in entire subway lines being shut down for months or even a year. Beginning in 2019, for example the I. Train connecting lower Manhattan to parts of Brooklyn was scheduled to close for as much as 15 months for long overdue service and upgrades. In a city fewar than half of whose households own a car, this can have serious economic impacts Residents of the affected area may face a much longer commute via an alternate subway line if one is available, or, if there is no alternate subway service, they may need to take other, potentially more exppensive, modes of transportation, such as taxis or ferries. Morover, studies indicate that increased stress from the commute to work can lead to lower productivity, and that businesses near the impacted lines may see decreased revenue as potential customers have a harder time getting to them.
One controversial proposal for reducing breakdowns and the resulting transit interruptions is to end the subway's 24-hour service and to shut down for several hours each night. Proponents of this plan argue that this would allow time, on a regular rather than sporadic basis, for more preventative maintanacnce. This, they claim, would ultimately lead to more consistent service, rrather than shutting down entire lines for long periods of a time, there would merely be shorter service outages overnight, when fewer people use the subway system. While this may seem a preferable outcome to the economic consequence of a total shutdown resulting from a breakdown, it has its liabilities as well. While most subway trips may occur during rush hour, not everyone works during the daytime. New yourk is famously known as the "the city that never sleeps." Doctors, nurses, bartenders, police officers, and firefighters are just a few examples of occupations whose workers need transportion at all hours of the day and night. Rather than be subjected to a relatively short period of inconvenience, these workers would find their commutes irrevocably altered. One thing, at least, is clear the city must carefully condider many economic and social factors in designing a subway maintenance plan.
According to the passage, which of the following is true of the New York City subway system ?
View SolutionThis passage is adapted from a 2018 article summarizing two different proposals for solving problems with maintaining New York City's mass transit system.
The history of the New York City subsaw system, quickly told: the first stations opened in 1904, and over the next century, it expended to 472 stations, more than any other subway system in the world, with 850 miles of track. Operating 24 hours a day seven days a week, with an average weekday ridership of approximately 5.7 million, it is the plant's 7th-busiest rapid transit system. While the system is, on many levels, an amazing chievement, it is also beset by a problem that harms both quality of life and economic activity. Such a large system must inevitably suffer from service interruptions and delays, normal wear and tear combined with the sheer age of the system necessitates regular maintanance. However, there is no consensus as to the best way to accomplish the required repairs. The current maintanance scheme is designed to minimize service interruptions. A subway line in need of repair will be taken out of sevice during a comaratively less busy time, such as nights or weekends, while another line is re-routed to cover as many as possible of the missing line's stops. The main advantage to this approach is that trains are not taken out of service during rush hour, when most subway trips occur, subway service generally remains predictable and commuters are, for the most part, able to use the system to get to their desinations on time.
But critics are quick to point out the disadvantages to this approach. Perhaps most obvious is the confusion caused by trains swithing lines. The labyrinthine system is hard enough to navigate at the best of times. especially for tourists A subway rider on the A terain naturally expects the train to make stops on teh A line. If instead, it is diverted temporatily to the F line, the rader may find herself miles from her intended destination.
While annoying, the confusion arising from route switching is hardly the most serious problem with the current approach to repairs. Because the system runs 24 hours a day, routine maintenance can generally be done only during the temporary closures on nights and weekends. This means that more serious repair and crucial preventative maintenance is often neglected. Problems that could have been fixed or prevented reasonably expeditiously given a slightly longer closure wind up leading to major breakdowns and service interruptions later on.
On rare occasions, such breakdowns have resulted in entire subway lines being shut down for months or even a year. Beginning in 2019, for example the I. Train connecting lower Manhattan to parts of Brooklyn was scheduled to close for as much as 15 months for long overdue service and upgrades. In a city fewar than half of whose households own a car, this can have serious economic impacts Residents of the affected area may face a much longer commute via an alternate subway line if one is available, or, if there is no alternate subway service, they may need to take other, potentially more exppensive, modes of transportation, such as taxis or ferries. Morover, studies indicate that increased stress from the commute to work can lead to lower productivity, and that businesses near the impacted lines may see decreased revenue as potential customers have a harder time getting to them.
One controversial proposal for reducing breakdowns and the resulting transit interruptions is to end the subway's 24-hour service and to shut down for several hours each night. Proponents of this plan argue that this would allow time, on a regular rather than sporadic basis, for more preventative maintanacnce. This, they claim, would ultimately lead to more consistent service, rrather than shutting down entire lines for long periods of a time, there would merely be shorter service outages overnight, when fewer people use the subway system. While this may seem a preferable outcome to the economic consequence of a total shutdown resulting from a breakdown, it has its liabilities as well. While most subway trips may occur during rush hour, not everyone works during the daytime. New yourk is famously known as the "the city that never sleeps." Doctors, nurses, bartenders, police officers, and firefighters are just a few examples of occupations whose workers need transportion at all hours of the day and night. Rather than be subjected to a relatively short period of inconvenience, these workers would find their commutes irrevocably altered. One thing, at least, is clear the city must carefully condider many economic and social factors in designing a subway maintenance plan.
Which choice provides the best evidence for the answer to the previous queston ?
View SolutionThis passage is adapted from a 2018 article summarizing two different proposals for solving problems with maintaining New York City's mass transit system.
The history of the New York City subsaw system, quickly told: the first stations opened in 1904, and over the next century, it expended to 472 stations, more than any other subway system in the world, with 850 miles of track. Operating 24 hours a day seven days a week, with an average weekday ridership of approximately 5.7 million, it is the plant's 7th-busiest rapid transit system. While the system is, on many levels, an amazing chievement, it is also beset by a problem that harms both quality of life and economic activity. Such a large system must inevitably suffer from service interruptions and delays, normal wear and tear combined with the sheer age of the system necessitates regular maintanance. However, there is no consensus as to the best way to accomplish the required repairs. The current maintanance scheme is designed to minimize service interruptions. A subway line in need of repair will be taken out of sevice during a comaratively less busy time, such as nights or weekends, while another line is re-routed to cover as many as possible of the missing line's stops. The main advantage to this approach is that trains are not taken out of service during rush hour, when most subway trips occur, subway service generally remains predictable and commuters are, for the most part, able to use the system to get to their desinations on time.
But critics are quick to point out the disadvantages to this approach. Perhaps most obvious is the confusion caused by trains swithing lines. The labyrinthine system is hard enough to navigate at the best of times. especially for tourists A subway rider on the A terain naturally expects the train to make stops on teh A line. If instead, it is diverted temporatily to the F line, the rader may find herself miles from her intended destination.
While annoying, the confusion arising from route switching is hardly the most serious problem with the current approach to repairs. Because the system runs 24 hours a day, routine maintenance can generally be done only during the temporary closures on nights and weekends. This means that more serious repair and crucial preventative maintenance is often neglected. Problems that could have been fixed or prevented reasonably expeditiously given a slightly longer closure wind up leading to major breakdowns and service interruptions later on.
On rare occasions, such breakdowns have resulted in entire subway lines being shut down for months or even a year. Beginning in 2019, for example the I. Train connecting lower Manhattan to parts of Brooklyn was scheduled to close for as much as 15 months for long overdue service and upgrades. In a city fewar than half of whose households own a car, this can have serious economic impacts Residents of the affected area may face a much longer commute via an alternate subway line if one is available, or, if there is no alternate subway service, they may need to take other, potentially more exppensive, modes of transportation, such as taxis or ferries. Morover, studies indicate that increased stress from the commute to work can lead to lower productivity, and that businesses near the impacted lines may see decreased revenue as potential customers have a harder time getting to them.
One controversial proposal for reducing breakdowns and the resulting transit interruptions is to end the subway's 24-hour service and to shut down for several hours each night. Proponents of this plan argue that this would allow time, on a regular rather than sporadic basis, for more preventative maintanacnce. This, they claim, would ultimately lead to more consistent service, rrather than shutting down entire lines for long periods of a time, there would merely be shorter service outages overnight, when fewer people use the subway system. While this may seem a preferable outcome to the economic consequence of a total shutdown resulting from a breakdown, it has its liabilities as well. While most subway trips may occur during rush hour, not everyone works during the daytime. New yourk is famously known as the "the city that never sleeps." Doctors, nurses, bartenders, police officers, and firefighters are just a few examples of occupations whose workers need transportion at all hours of the day and night. Rather than be subjected to a relatively short period of inconvenience, these workers would find their commutes irrevocably altered. One thing, at least, is clear the city must carefully condider many economic and social factors in designing a subway maintenance plan.
Which of the following best expresses the primary purpose of the passage ?
View Solution
