The following table gives the number of households in USA during 2000-2014.
The following charts give the distribution of households based on the numbers of children for the years 2000 and 2014.

The following charts give the distribution based on the number of childre for the year 2000 and 2014.
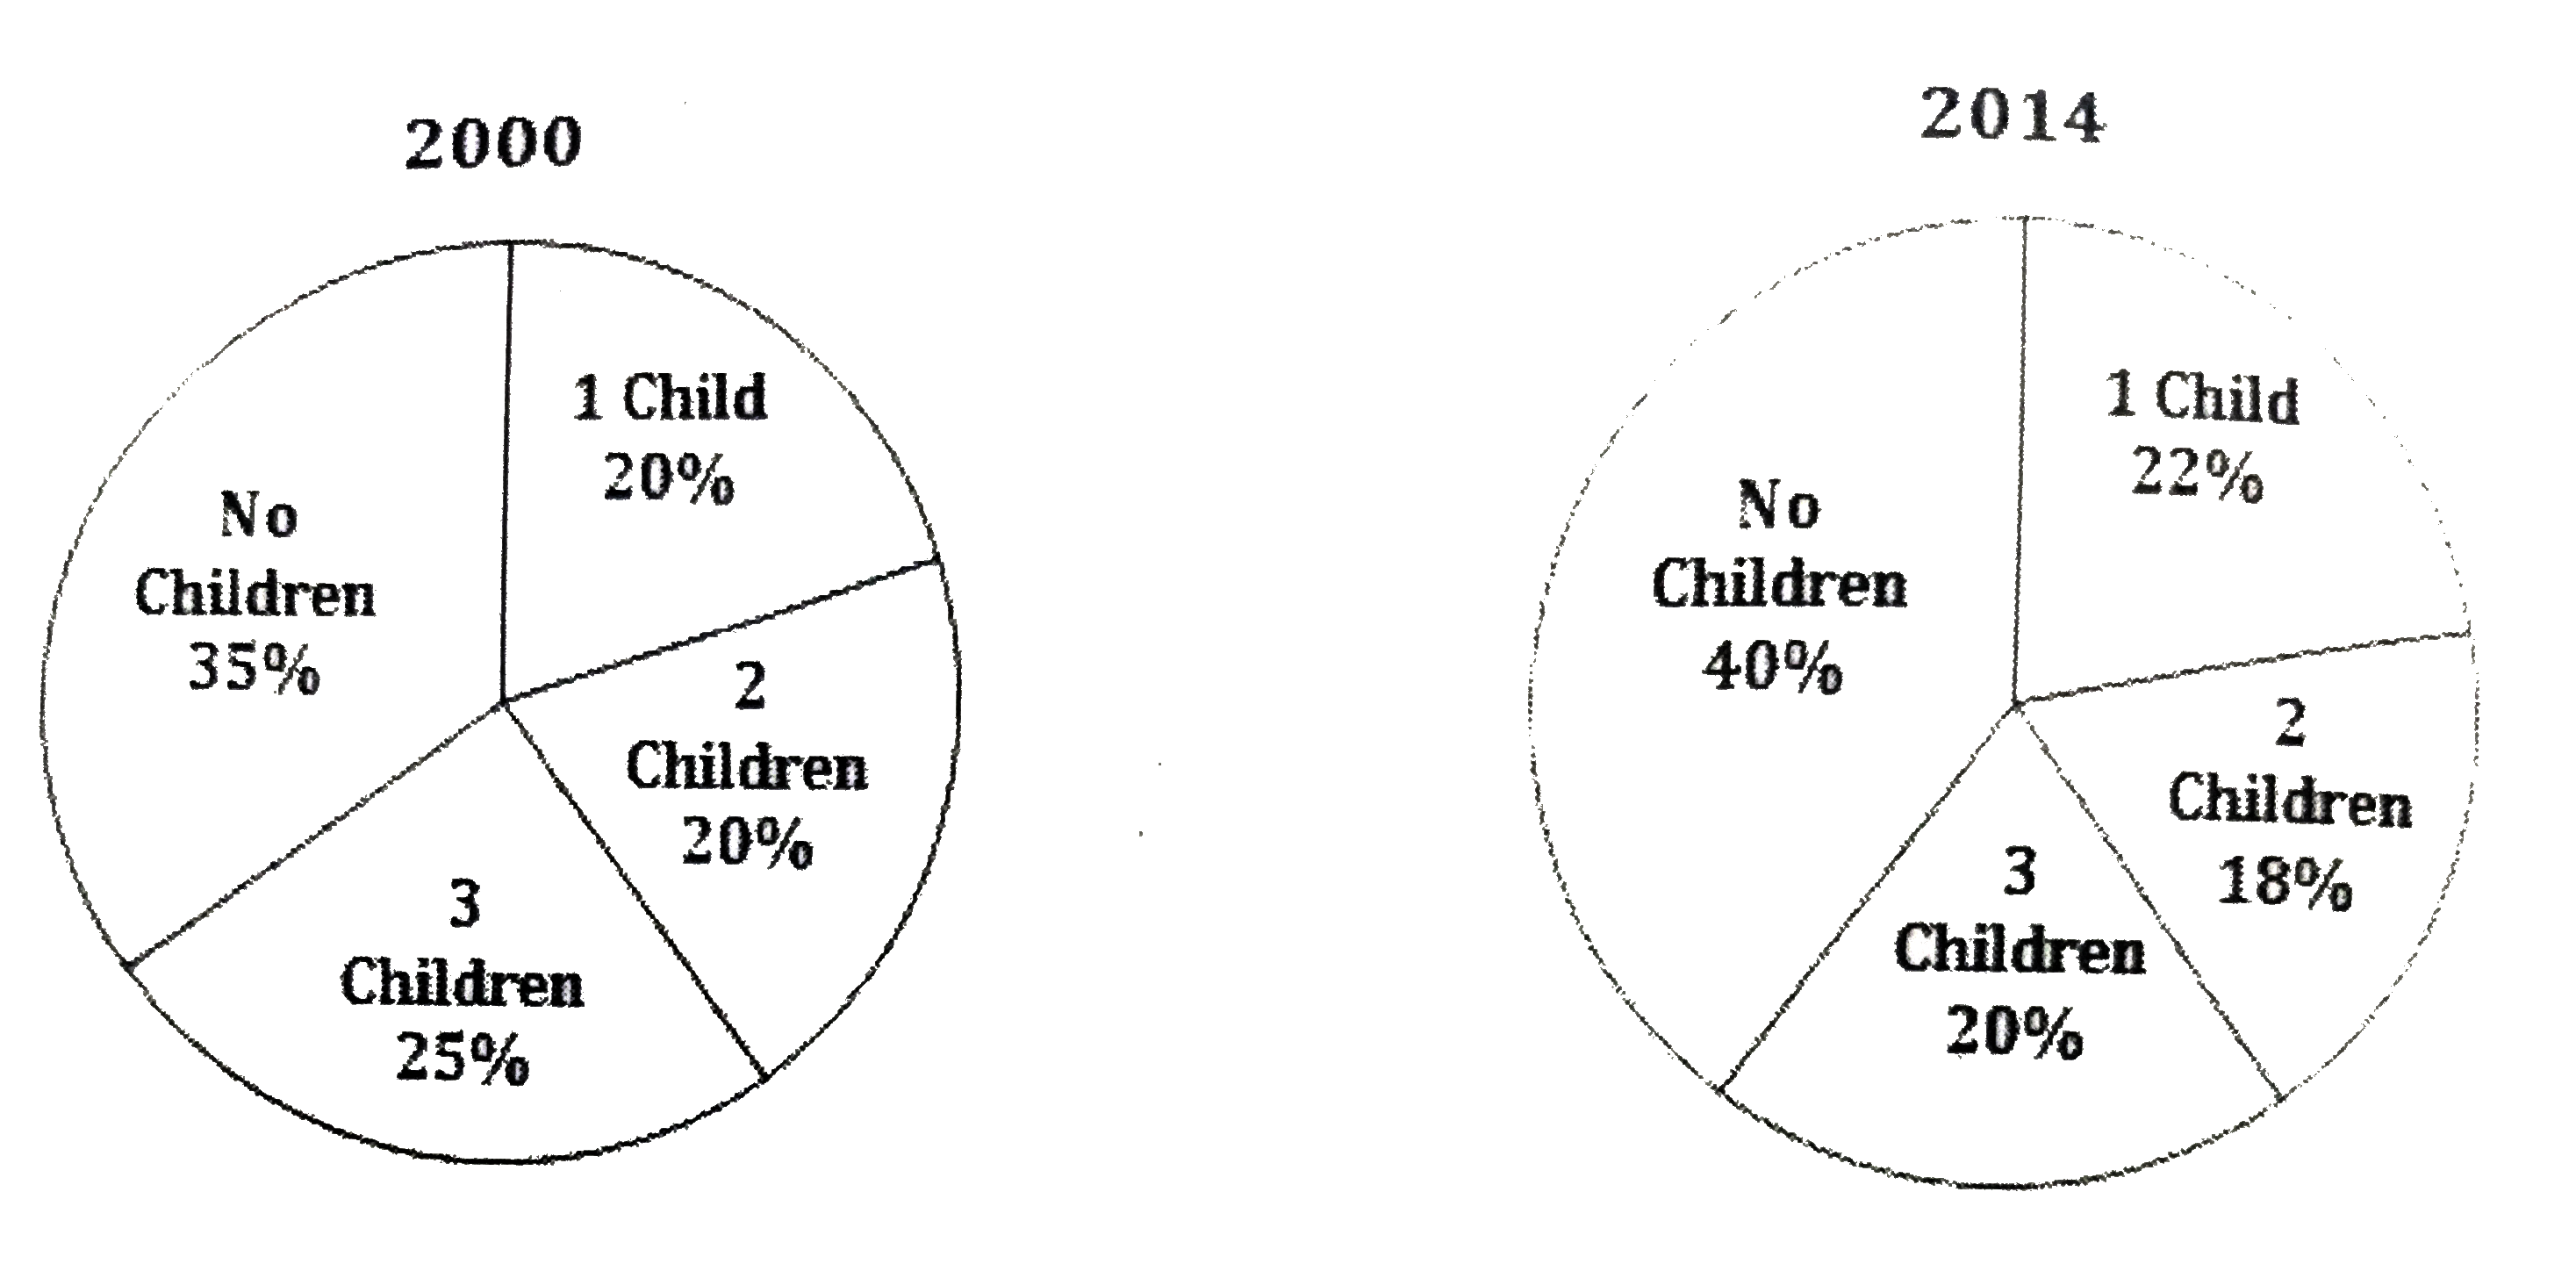
What was the approximate average annual percent increase in the number of households form 2000 to 2014 ?
1.5%
1.4%
1.2%
1.1%
The correct Answer is:A
Step by step video, text & image solution for The following table gives the number of households in USA during 2000-2014. The following charts give the distribution of households based on the numbers of children for the years 2000 and 2014. The following charts give the distribution based on the number of childre for the year 2000 and 2014. What was the approximate average annual percent increase in the number of households form 2000 to 2014 ? by Maths experts to help you in doubts & scoring excellent marks in Class 12 exams.
Updated on:21/07/2023Topper's Solved these Questions
Similar Questions
Knowledge Check
The following table gives the number of households in USA during 2000-2014.
The following charts give the distribution of households based on the numbers of children for the years 2000 and 2014.

The following charts give the distribution based on the number of childre for the year 2000 and 2014.
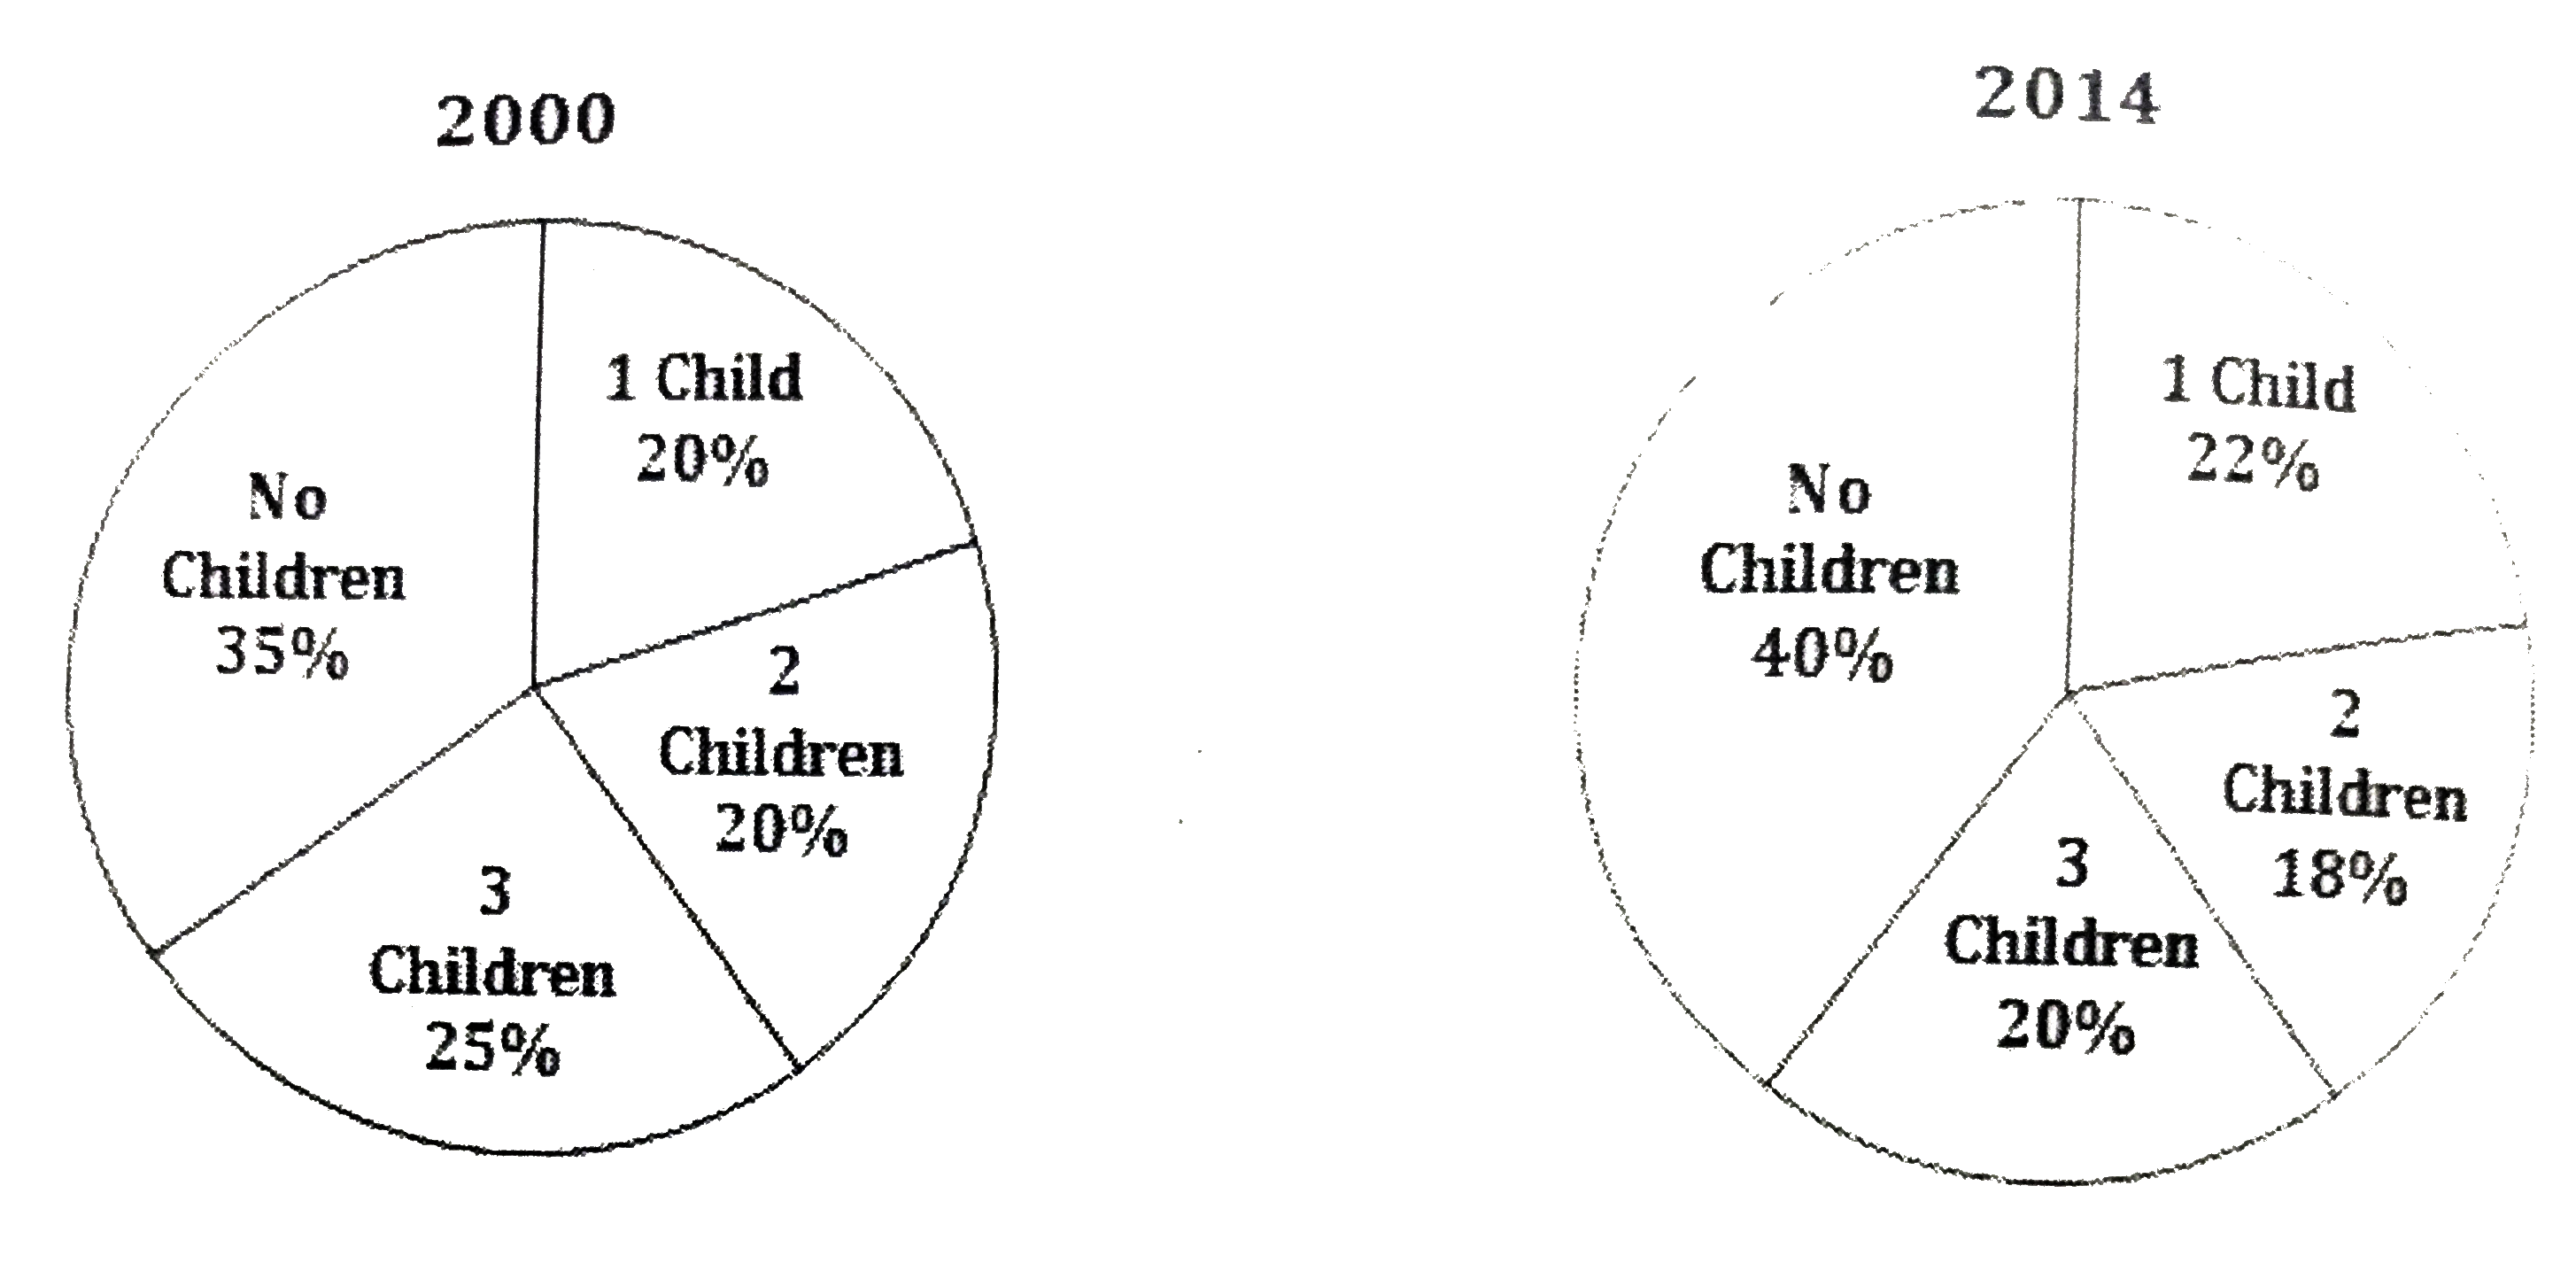
What is the total number of children in 2014?A57.0 millionB129.5 millionC171.1 millionD201.4 millionThe following table gives the number of households in USA during 2000-2014.
The following charts give the distribution of households based on the numbers of children for the years 2000 and 2014.

The following charts give the distribution based on the number of childre for the year 2000 and 2014.
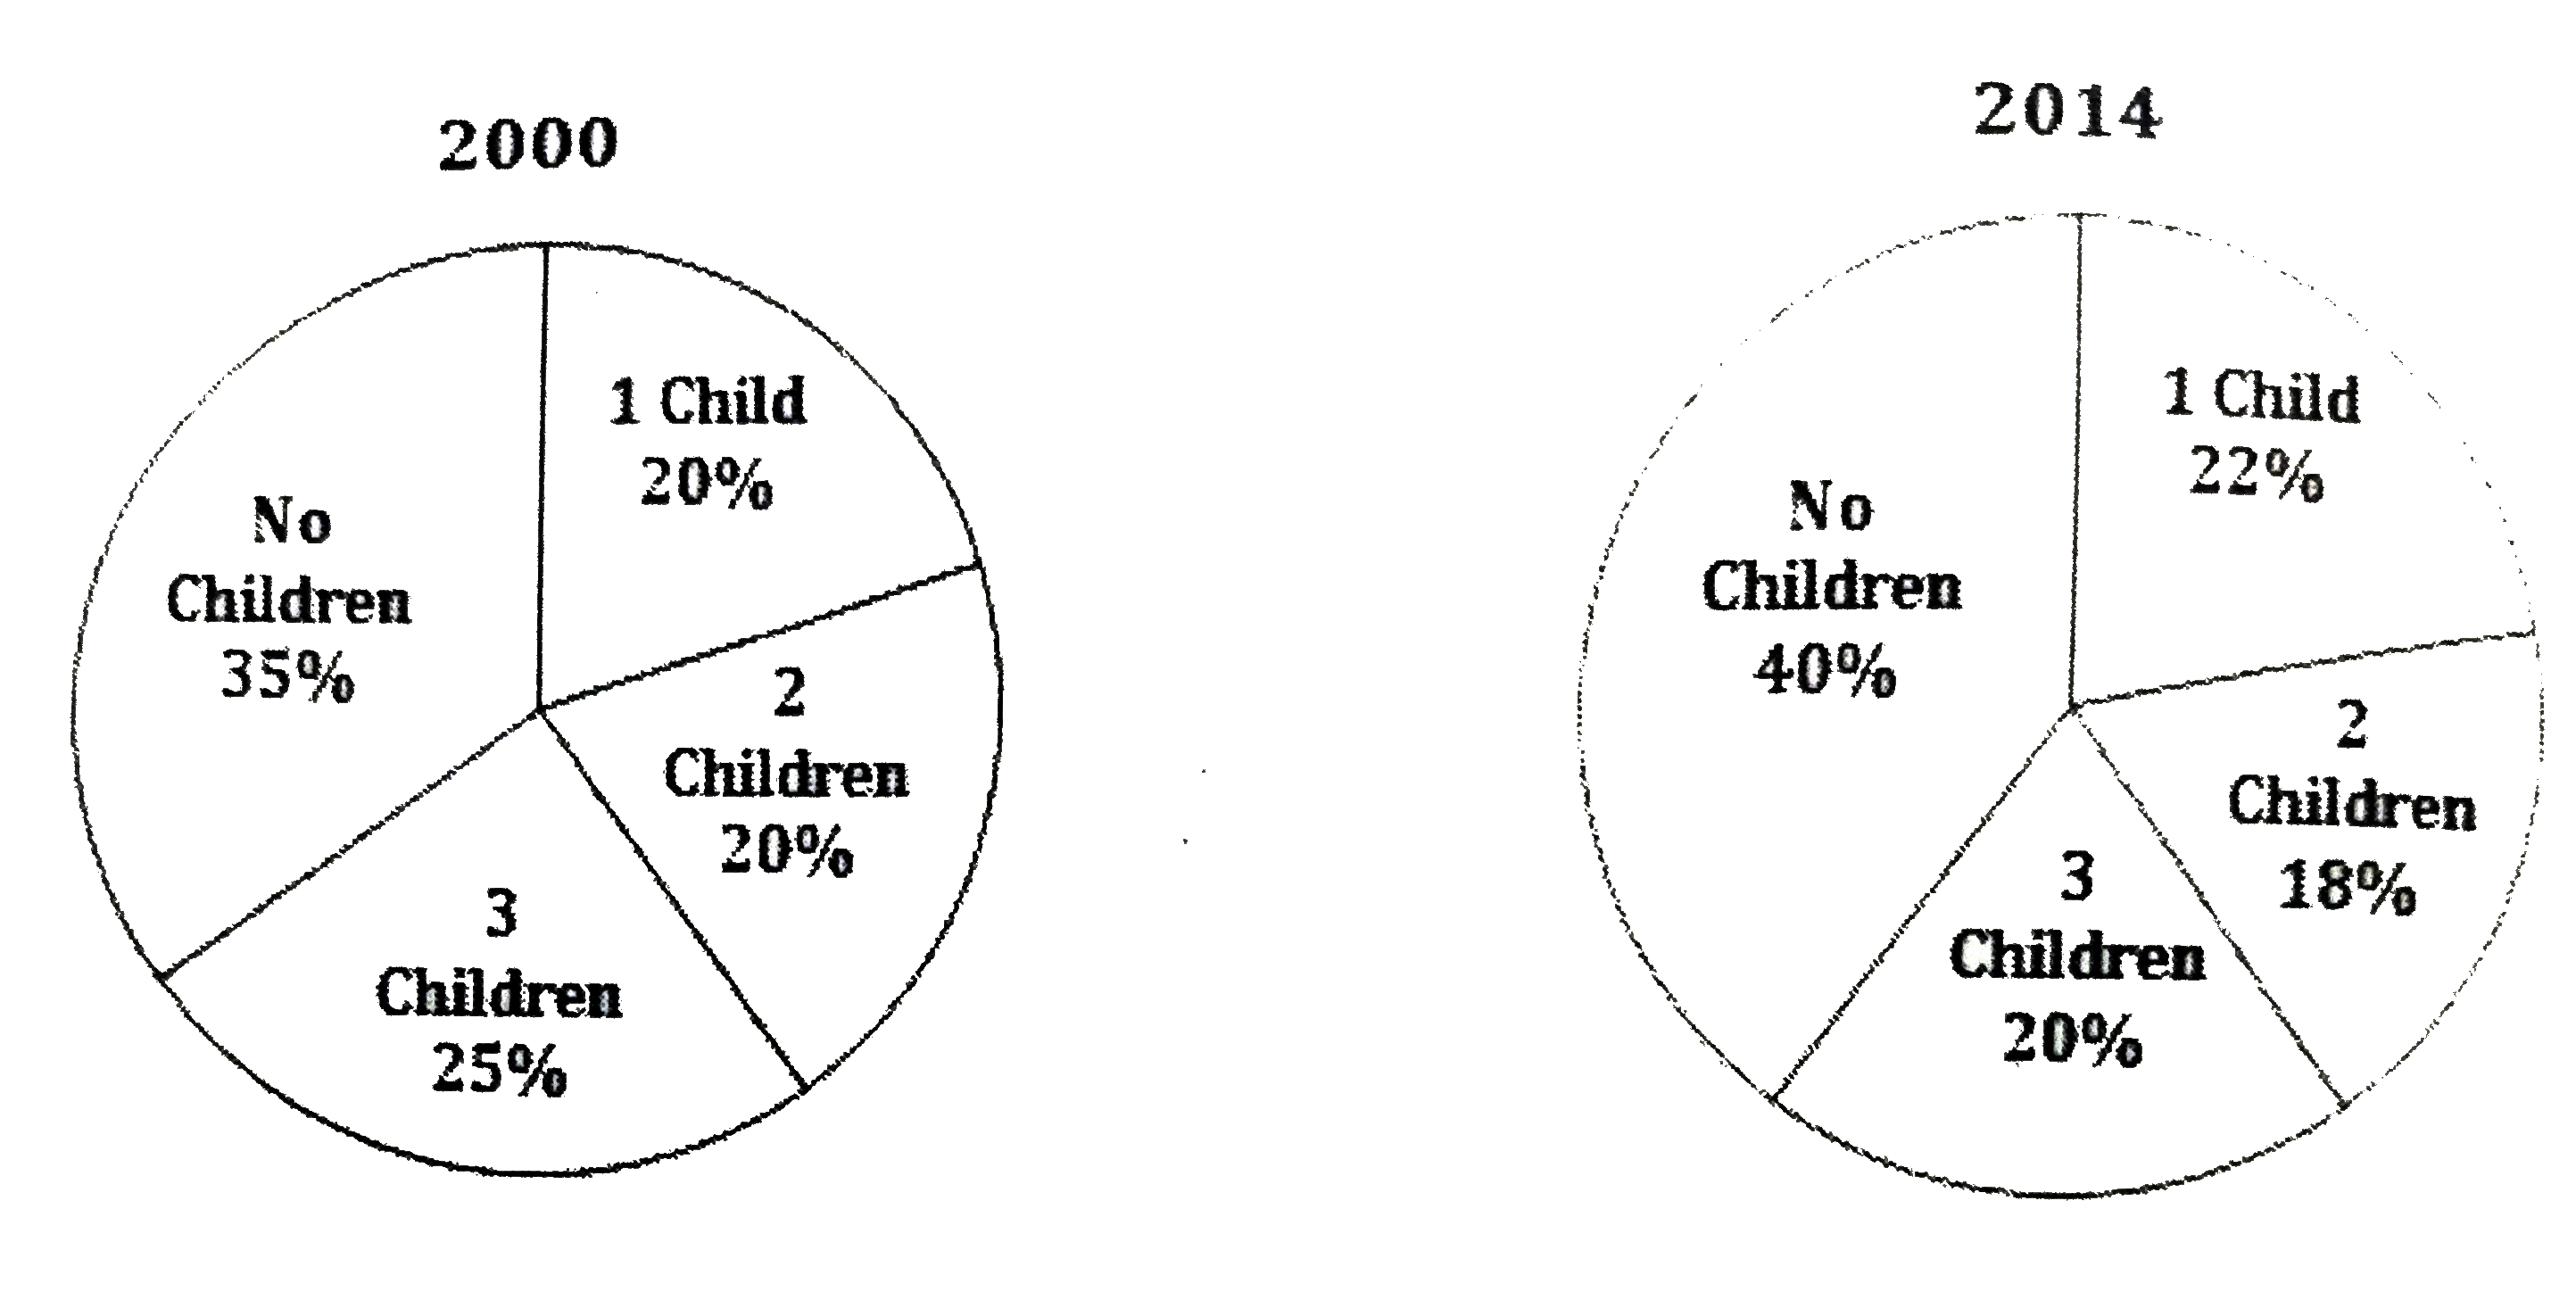
In the above problem, how many additional children were born in that year ?A8.4 millionB13.2 millionC15.0 millionD17.6 millionThe following table gives the number of households in USA during 2000-2014.
The following charts give the distribution of households based on the numbers of children for the years 2000 and 2014.

The following charts give the distribution based on the number of childre for the year 2000 and 2014.
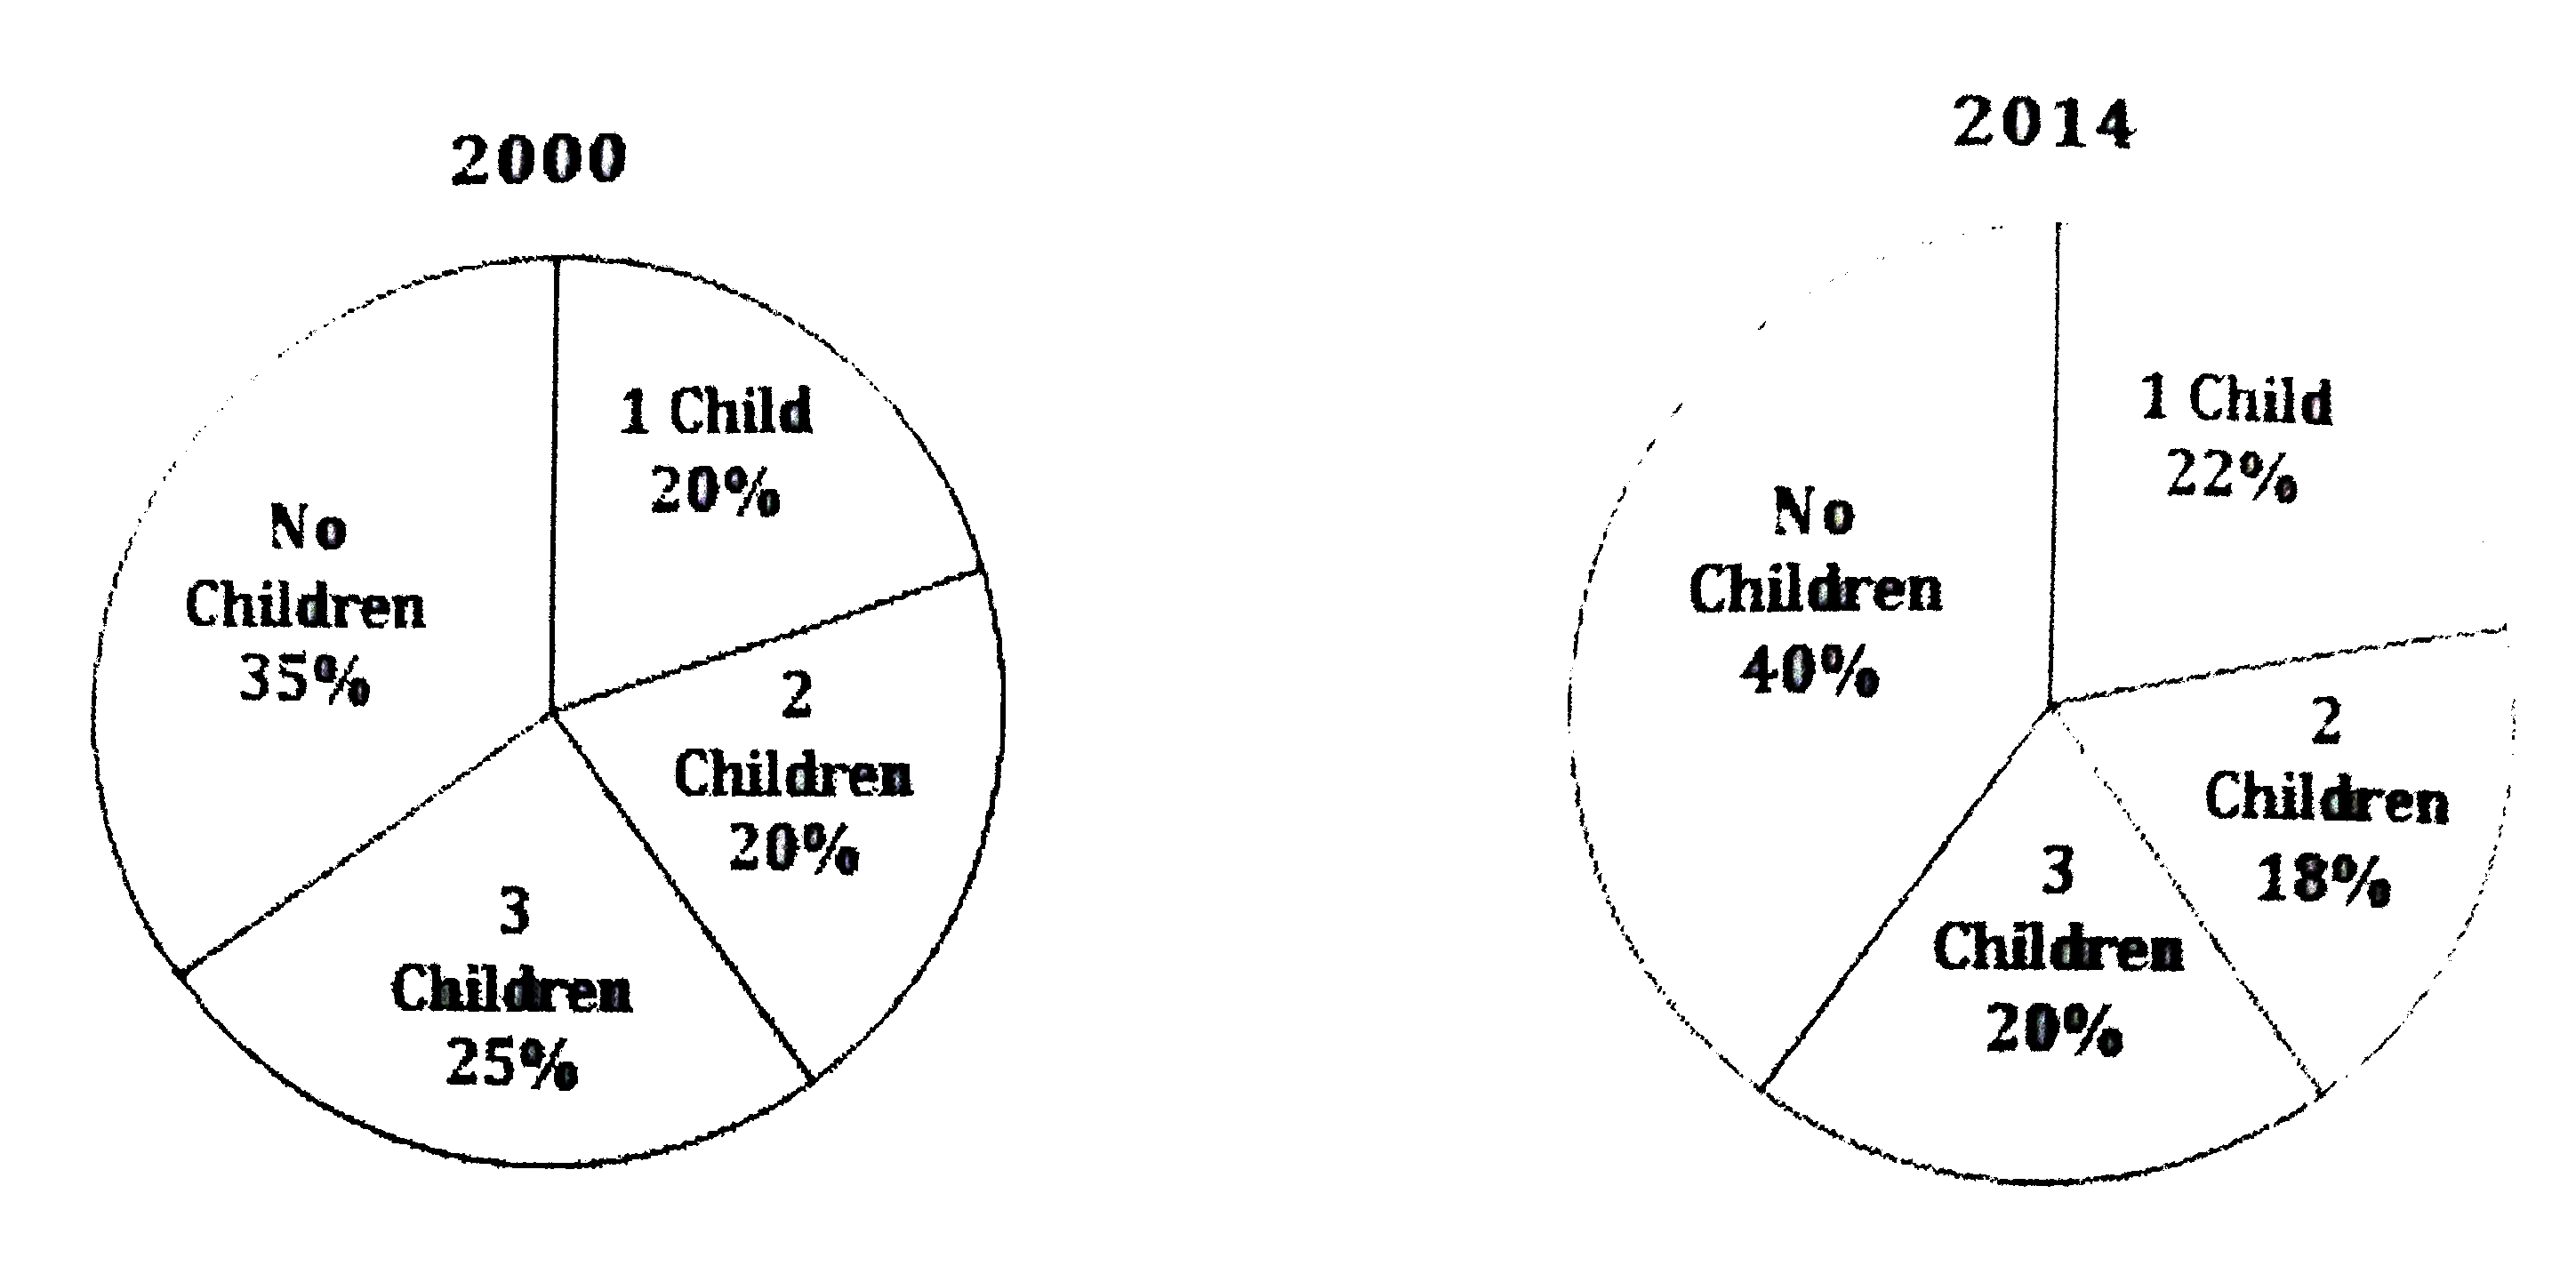
In 2000, 20 % of the household beloing to the category " no children " decided to have children . If those households had 1,2 and 3 children in the ratio of 4:2:1, respectively , what would be the share of households having 2 children ?A21.0%B22.0%C24.0%D26.4%
The following data gives the distribution of total household expendilture ( in Rs.) of workers is a city :

Find the average expenditure which is being done by maximum number of manual workers.
View Solution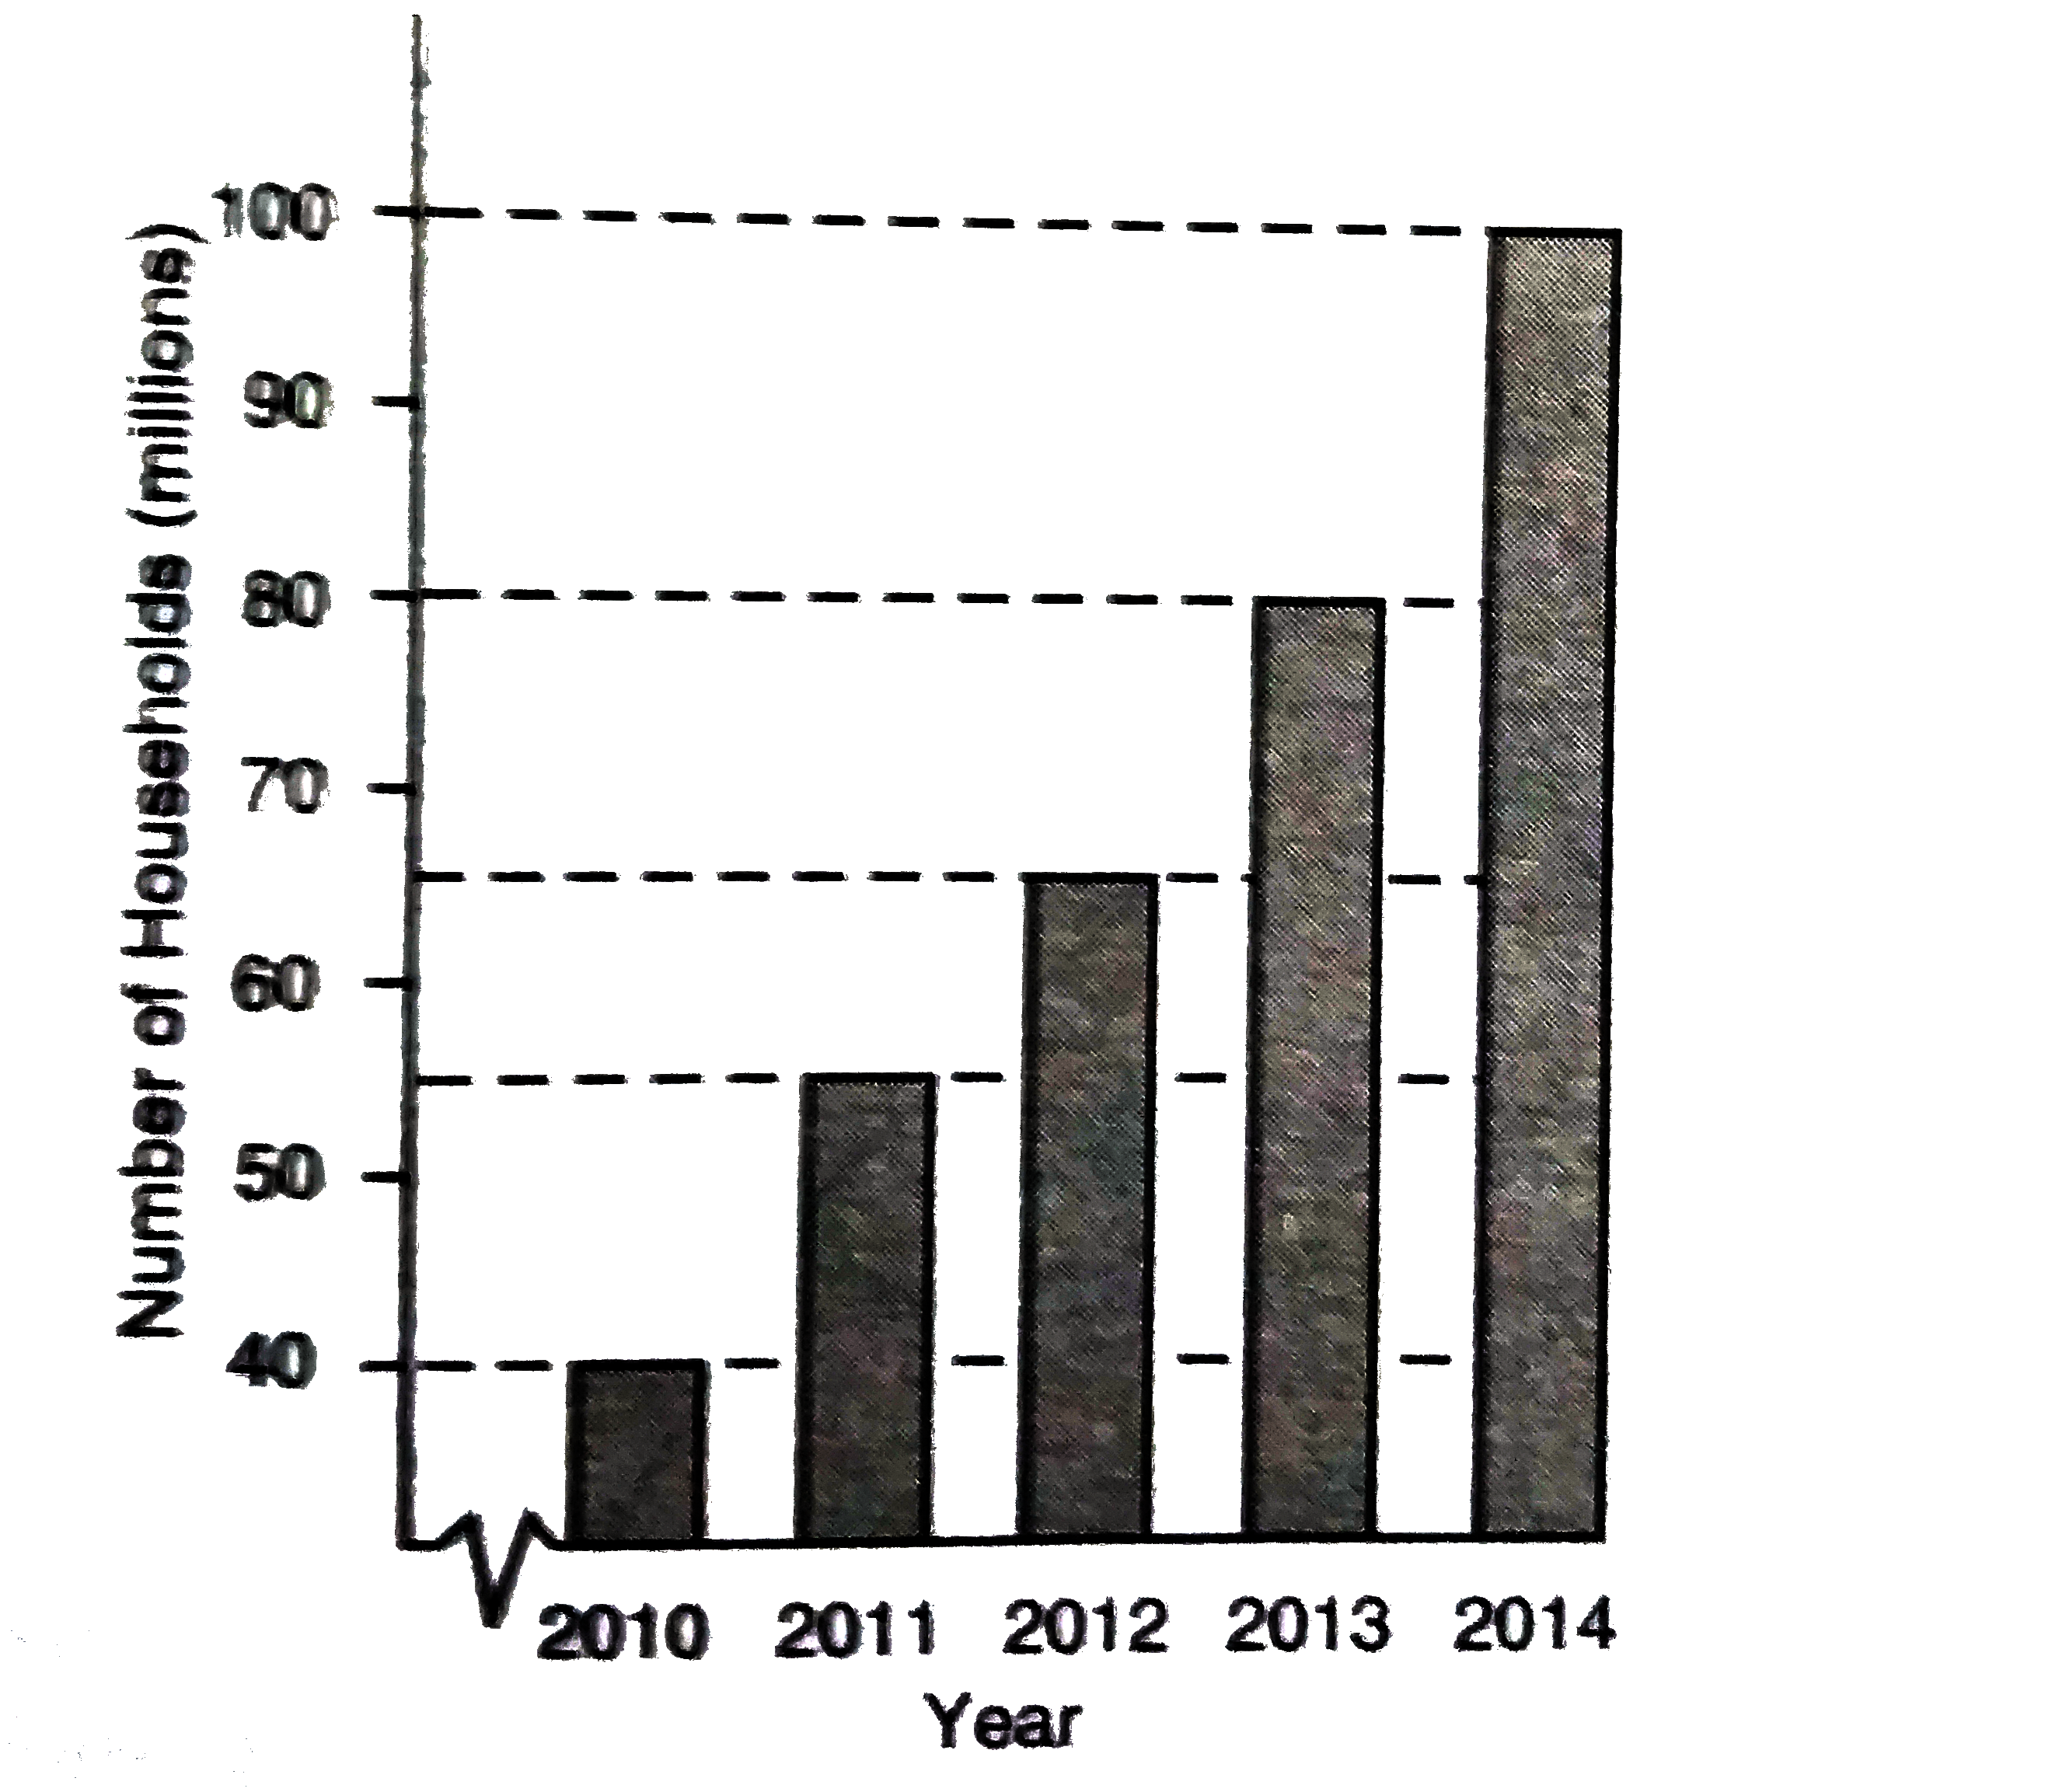
The graph above shows the number of U.S. households with laptop computers for the years 2010 to 2014.
Q. What was the percent of increase in the number of households with laptops from 2010 to 2014?
View SolutionWhich of the following gives the maxium number of isomers?
View Solution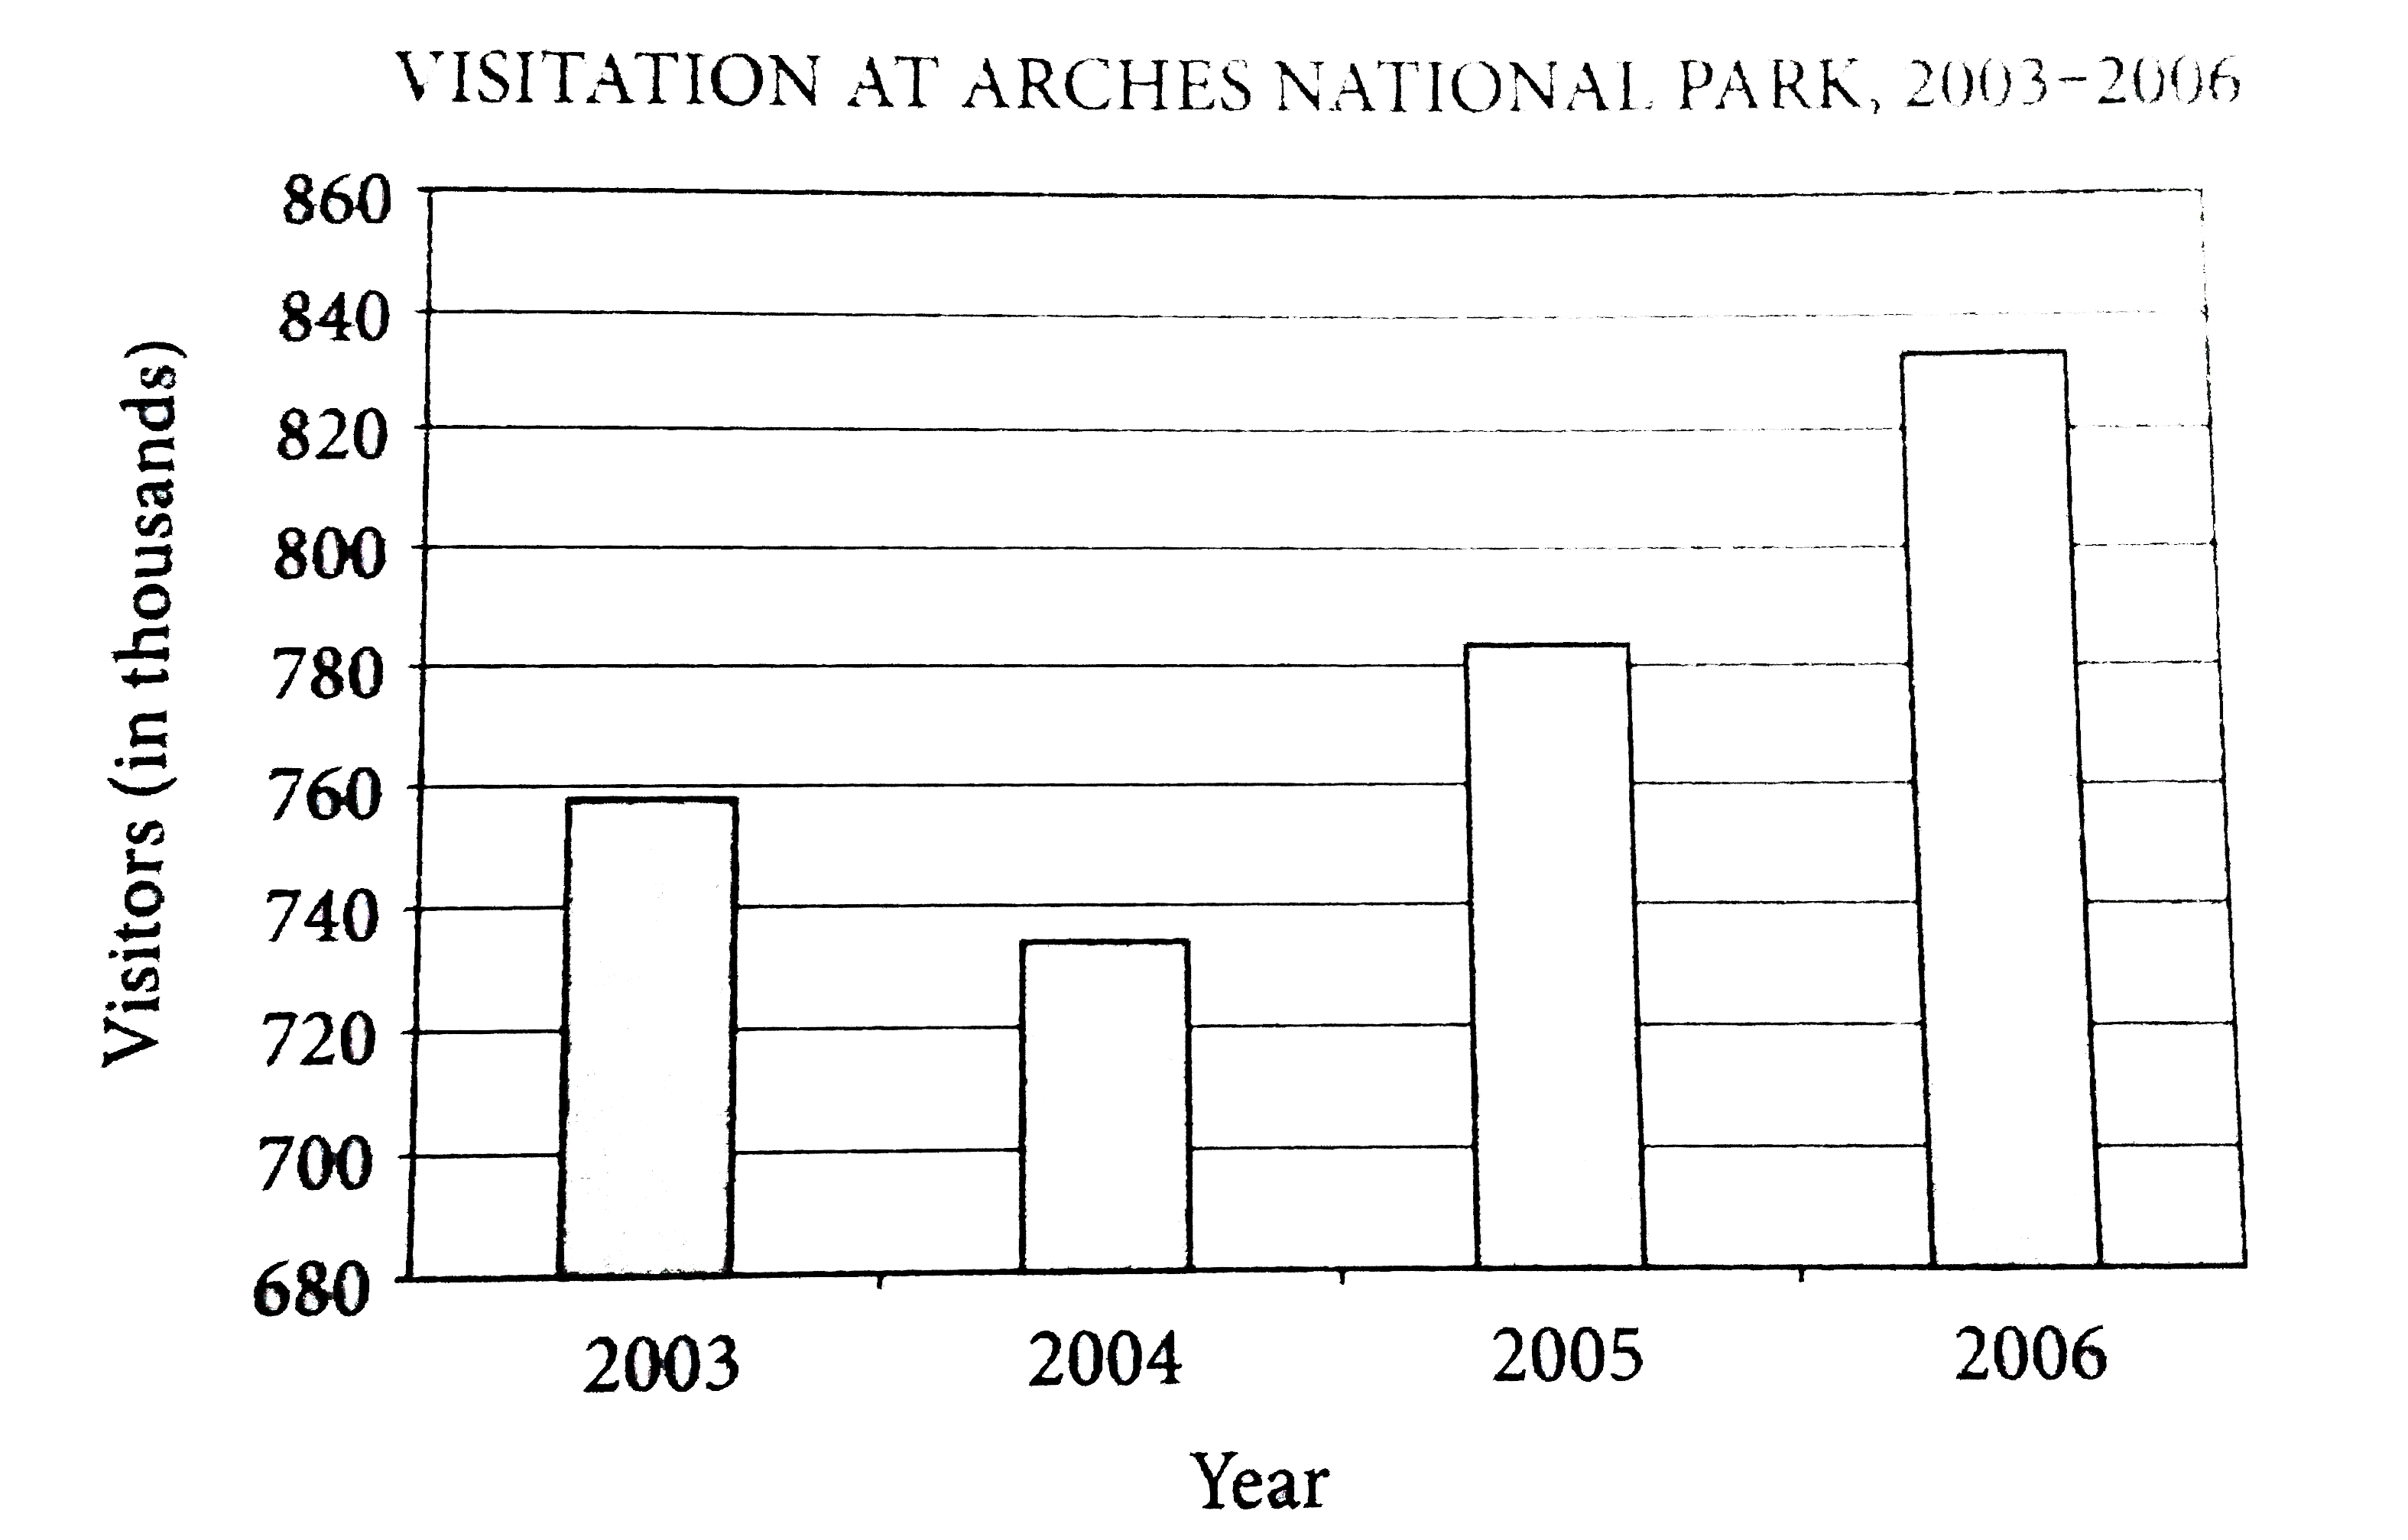
The chart above shows the number of visits, in thousands, at Arches National park for the years 2003 to 2006. Which of the following is the closest approximation of the percent increase in the number of visits from 2004 to 2006?
View Solution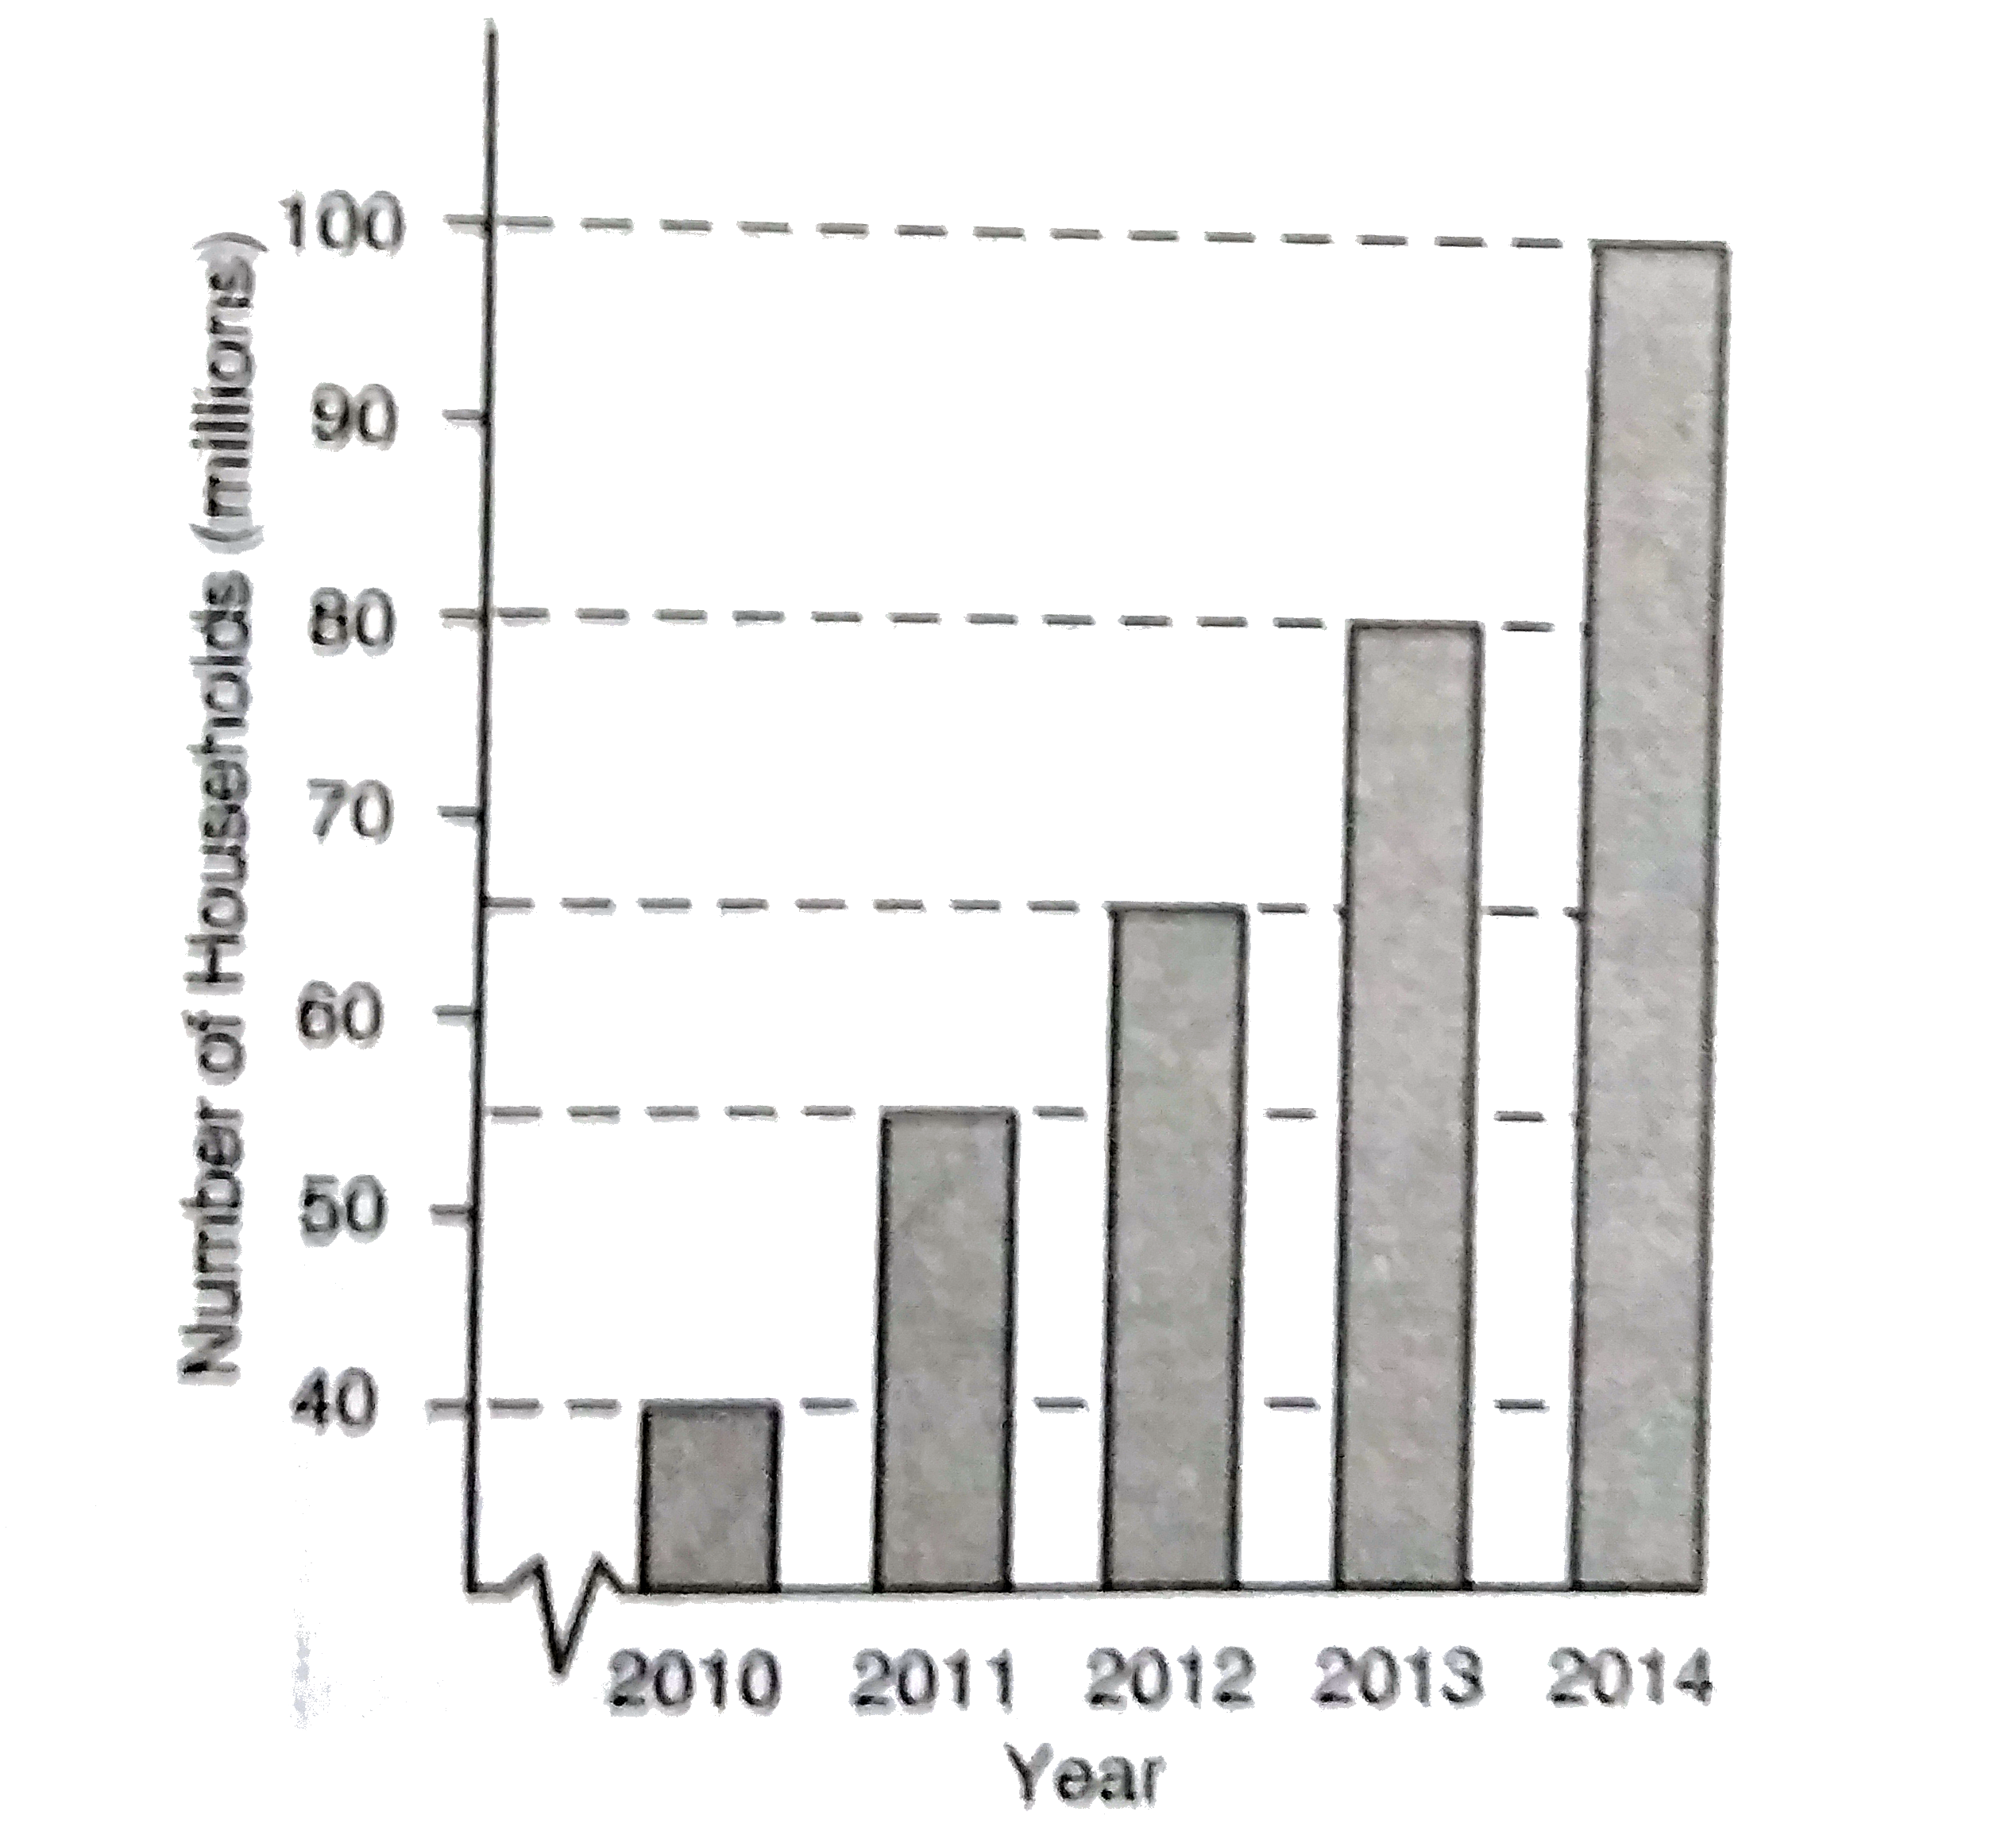
The graph above shows the number of U.S. households with laptop computers for the years 2010 to 2014.
Q. The greatest percent of increase in the number of households with laptops occurred in which two consecutive years?
View Solution


