Which of the following graphs represents the graphical relation between momentum (p) and kinetic energy (K) for a body in motion?
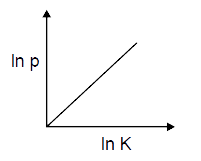
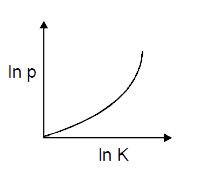
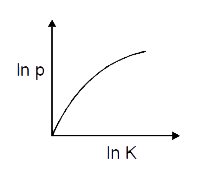
None
The correct Answer is:D
Step by step video, text & image solution for Which of the following graphs represents the graphical relation between momentum (p) and kinetic energy (K) for a body in motion? by Physics experts to help you in doubts & scoring excellent marks in Class 12 exams.
Updated on:21/07/2023Topper's Solved these Questions
- CENTRE OF MASSBook:MOTIONChapter:CENTRE OF MASSExercise:Exercise - 2 (Level-I)
Explore 40 Videos
- CENTRE OF MASSBook:MOTIONChapter:CENTRE OF MASSExercise:Exercise - 2 (Level-II)
Explore 28 Videos
- CENTRE OF MASSBook:MOTIONChapter:CENTRE OF MASSExercise:Exercise - 4 Level-II
Explore 20 Videos
- Capacitance Book:MOTIONChapter:Capacitance Exercise:EXERCISE -4 LEVEL II
Explore 19 Videos
- CIRCULAR MOTIONBook:MOTIONChapter:CIRCULAR MOTIONExercise:EXERCISE - 4
Explore 16 Videos
Similar Questions
Knowledge Check
Which one of the following graphs represents motion?
A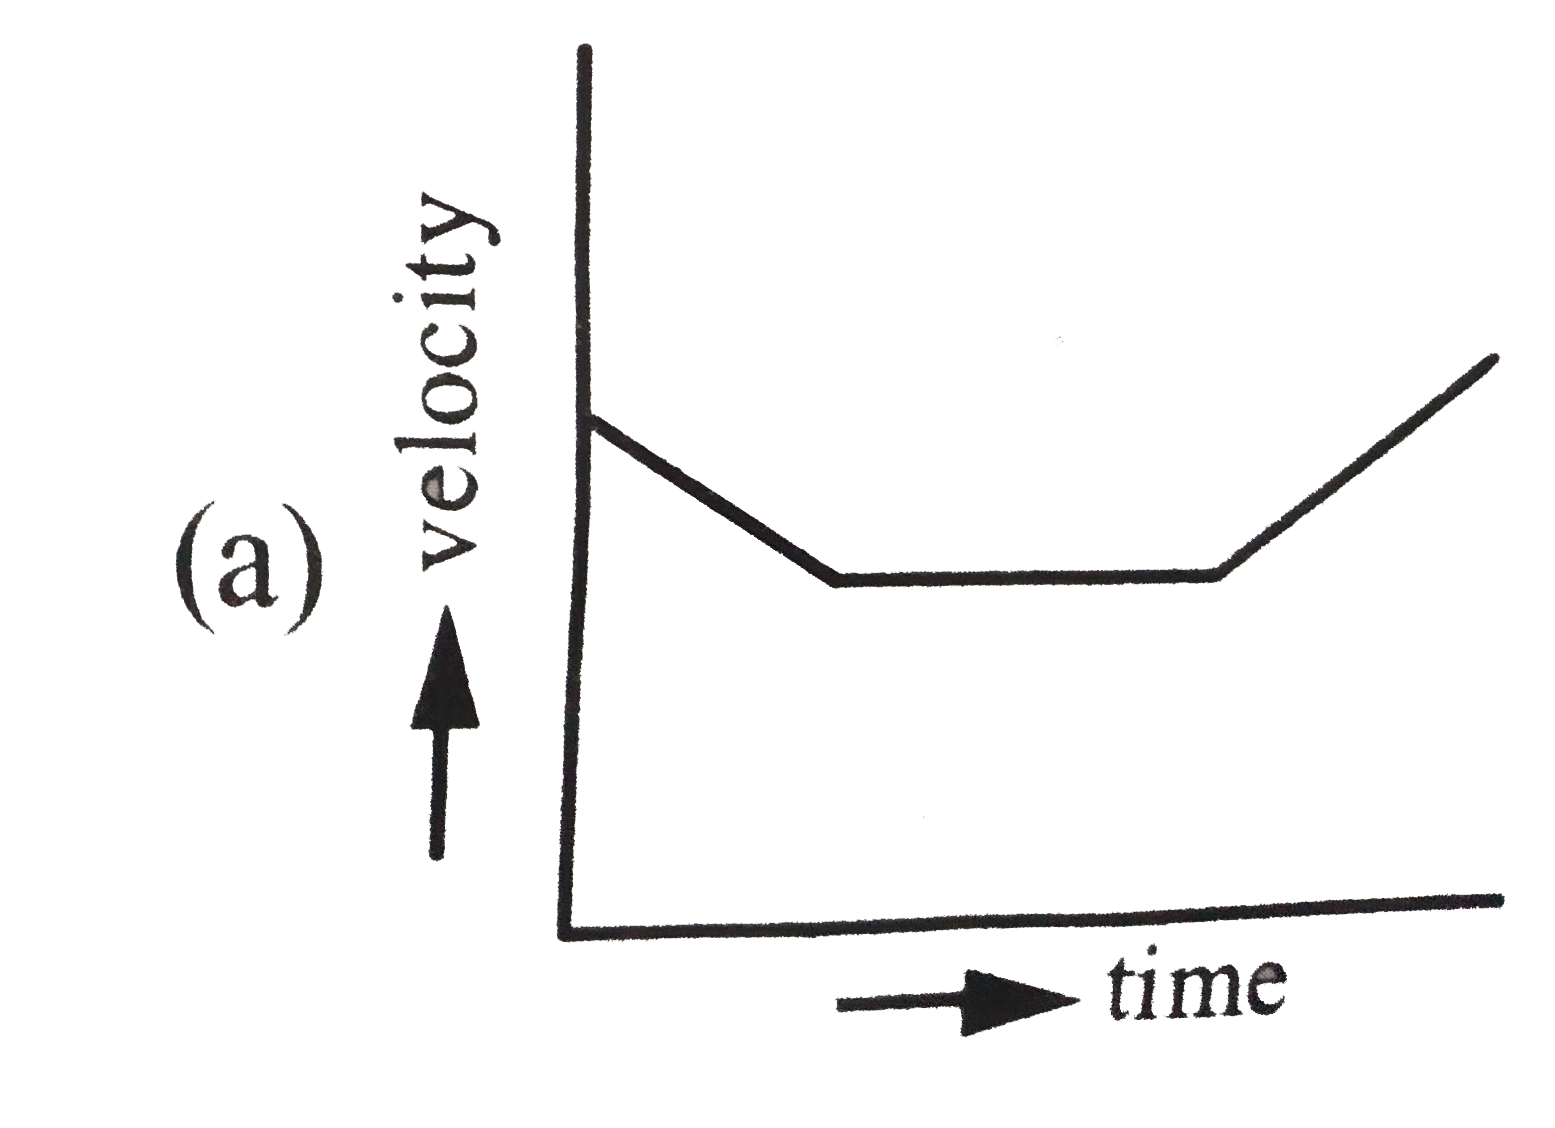 B
B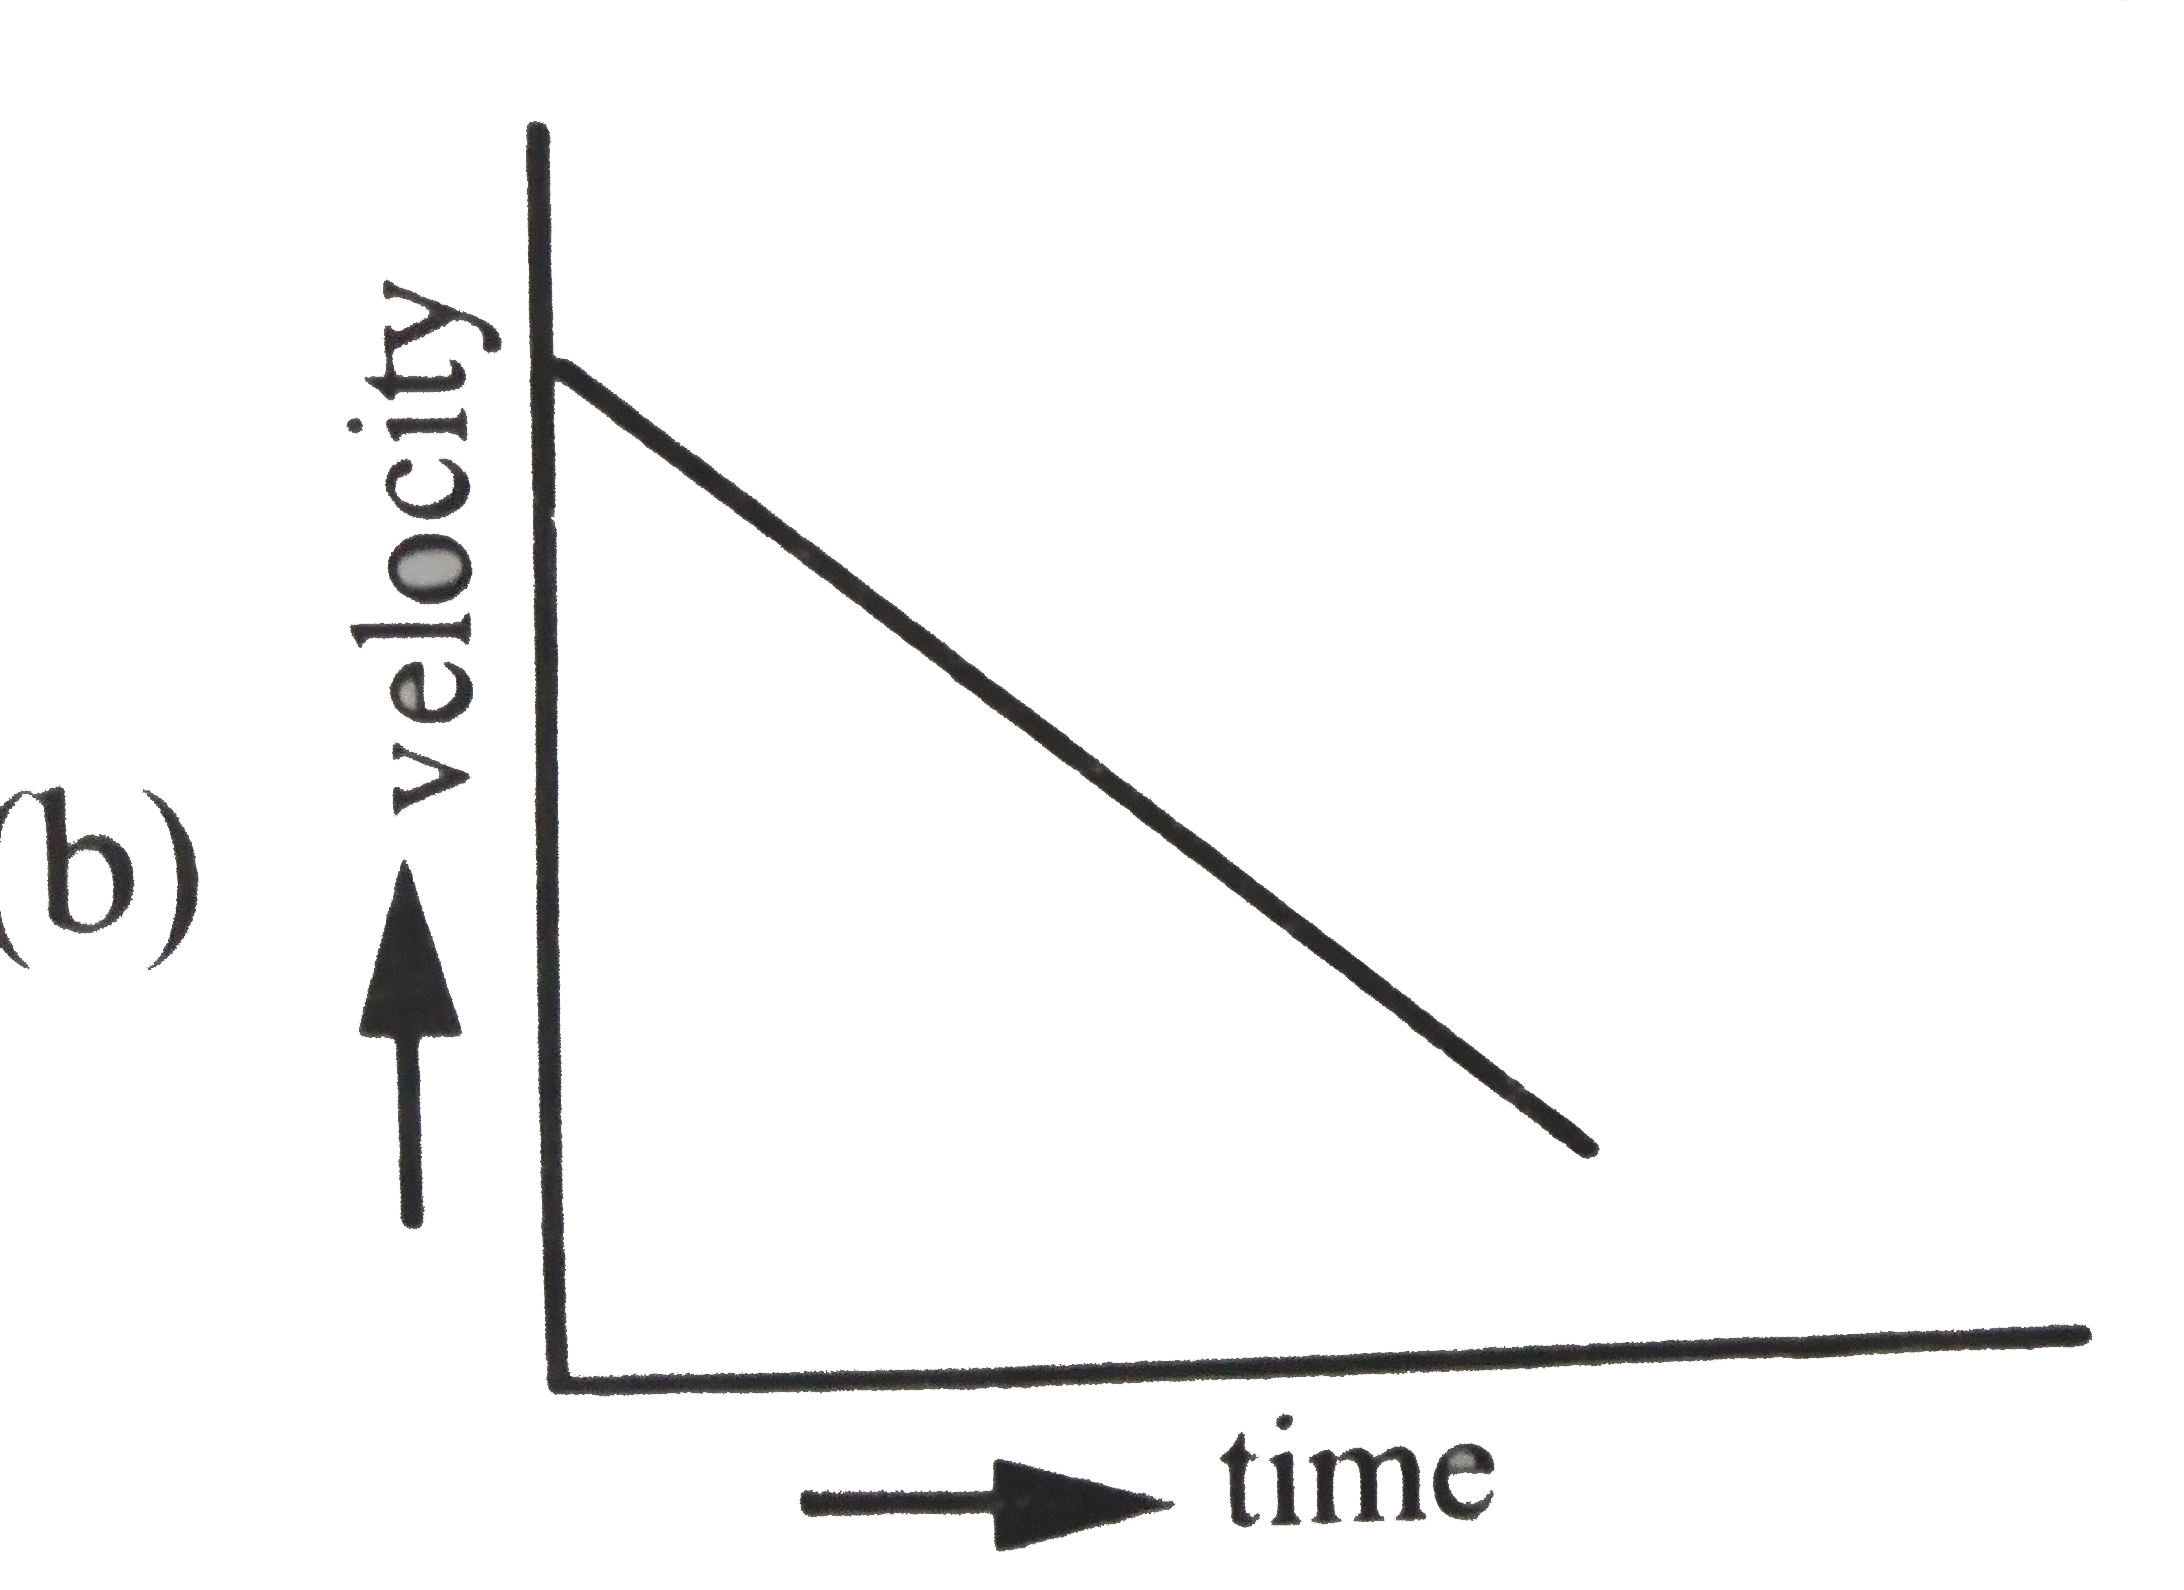 C
C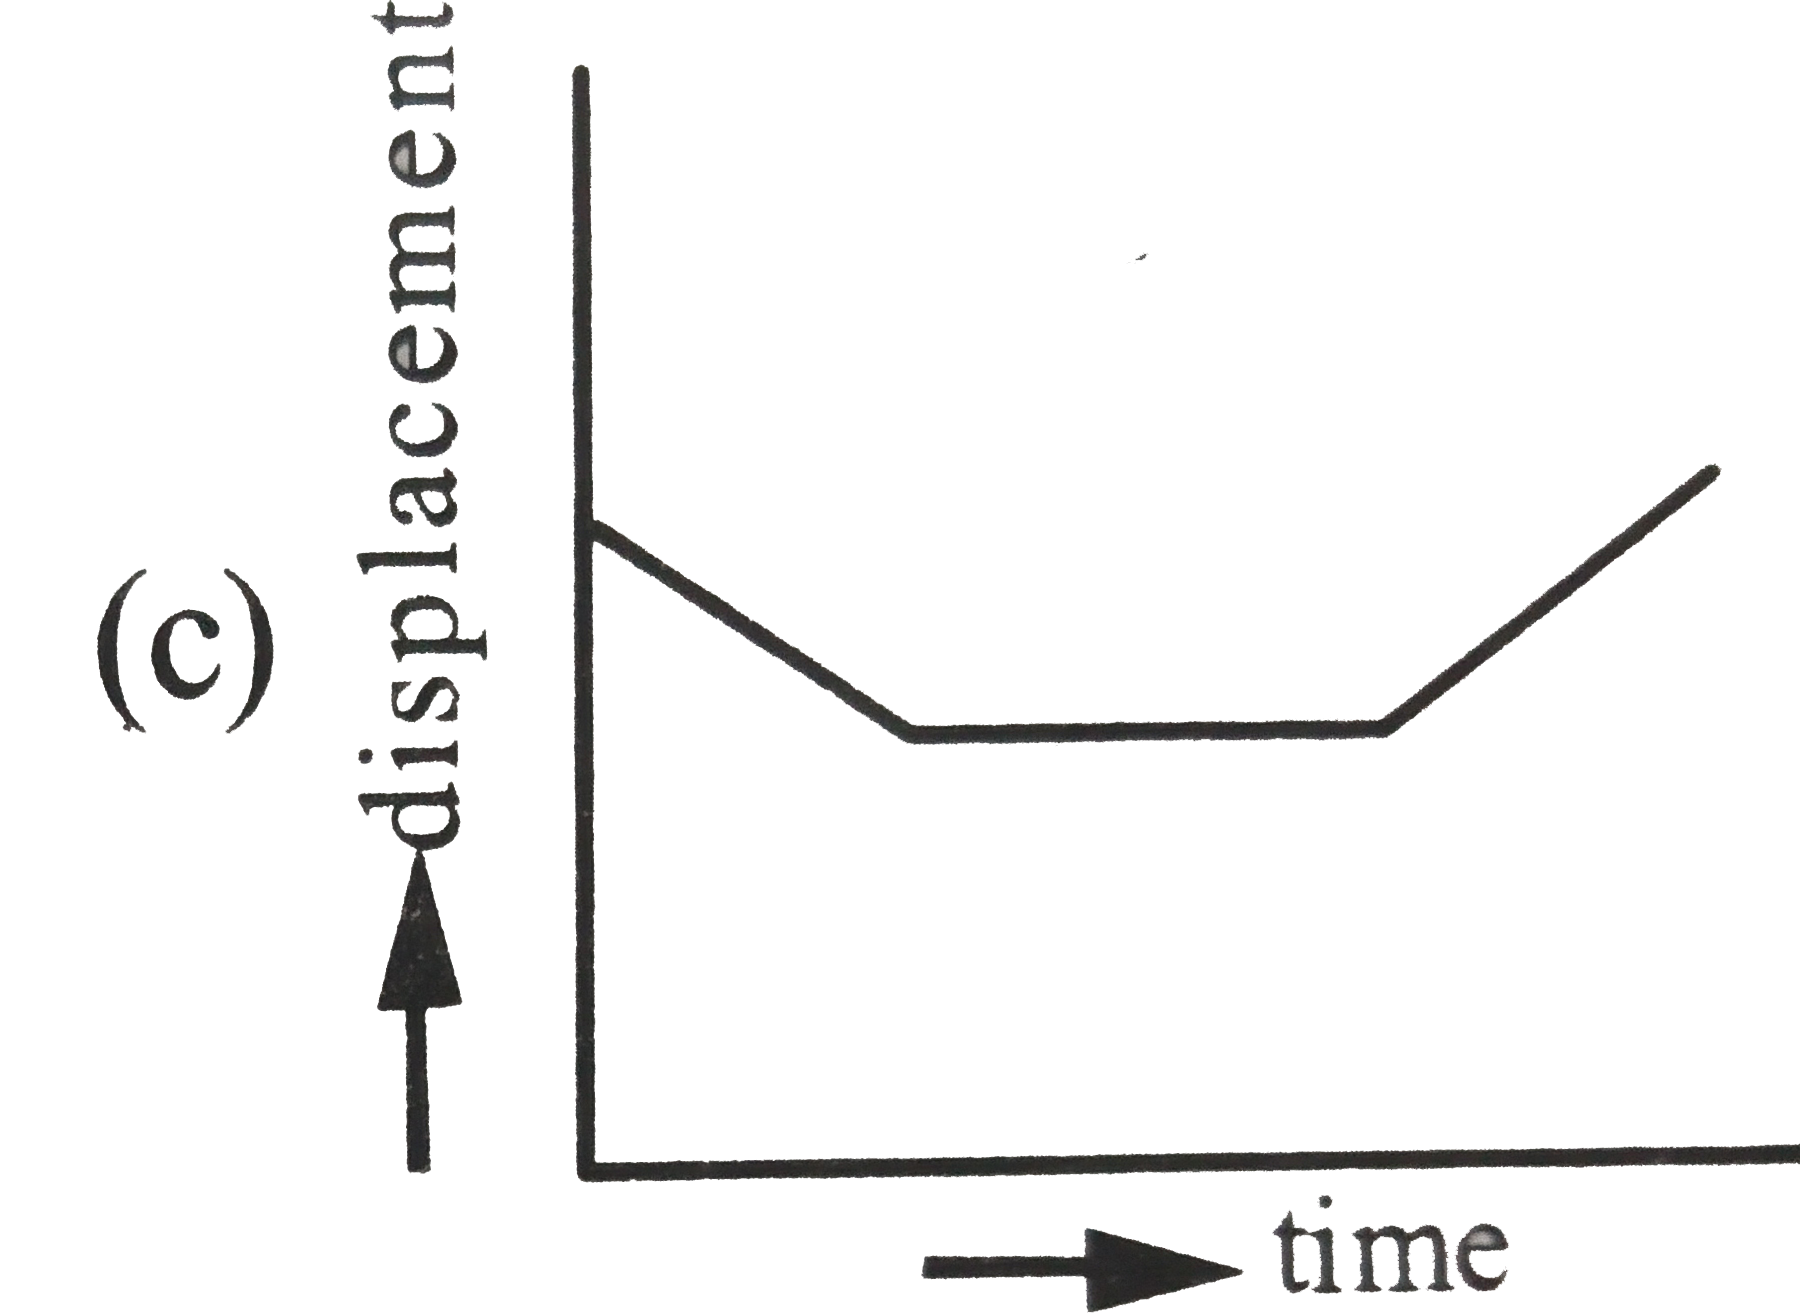 D
D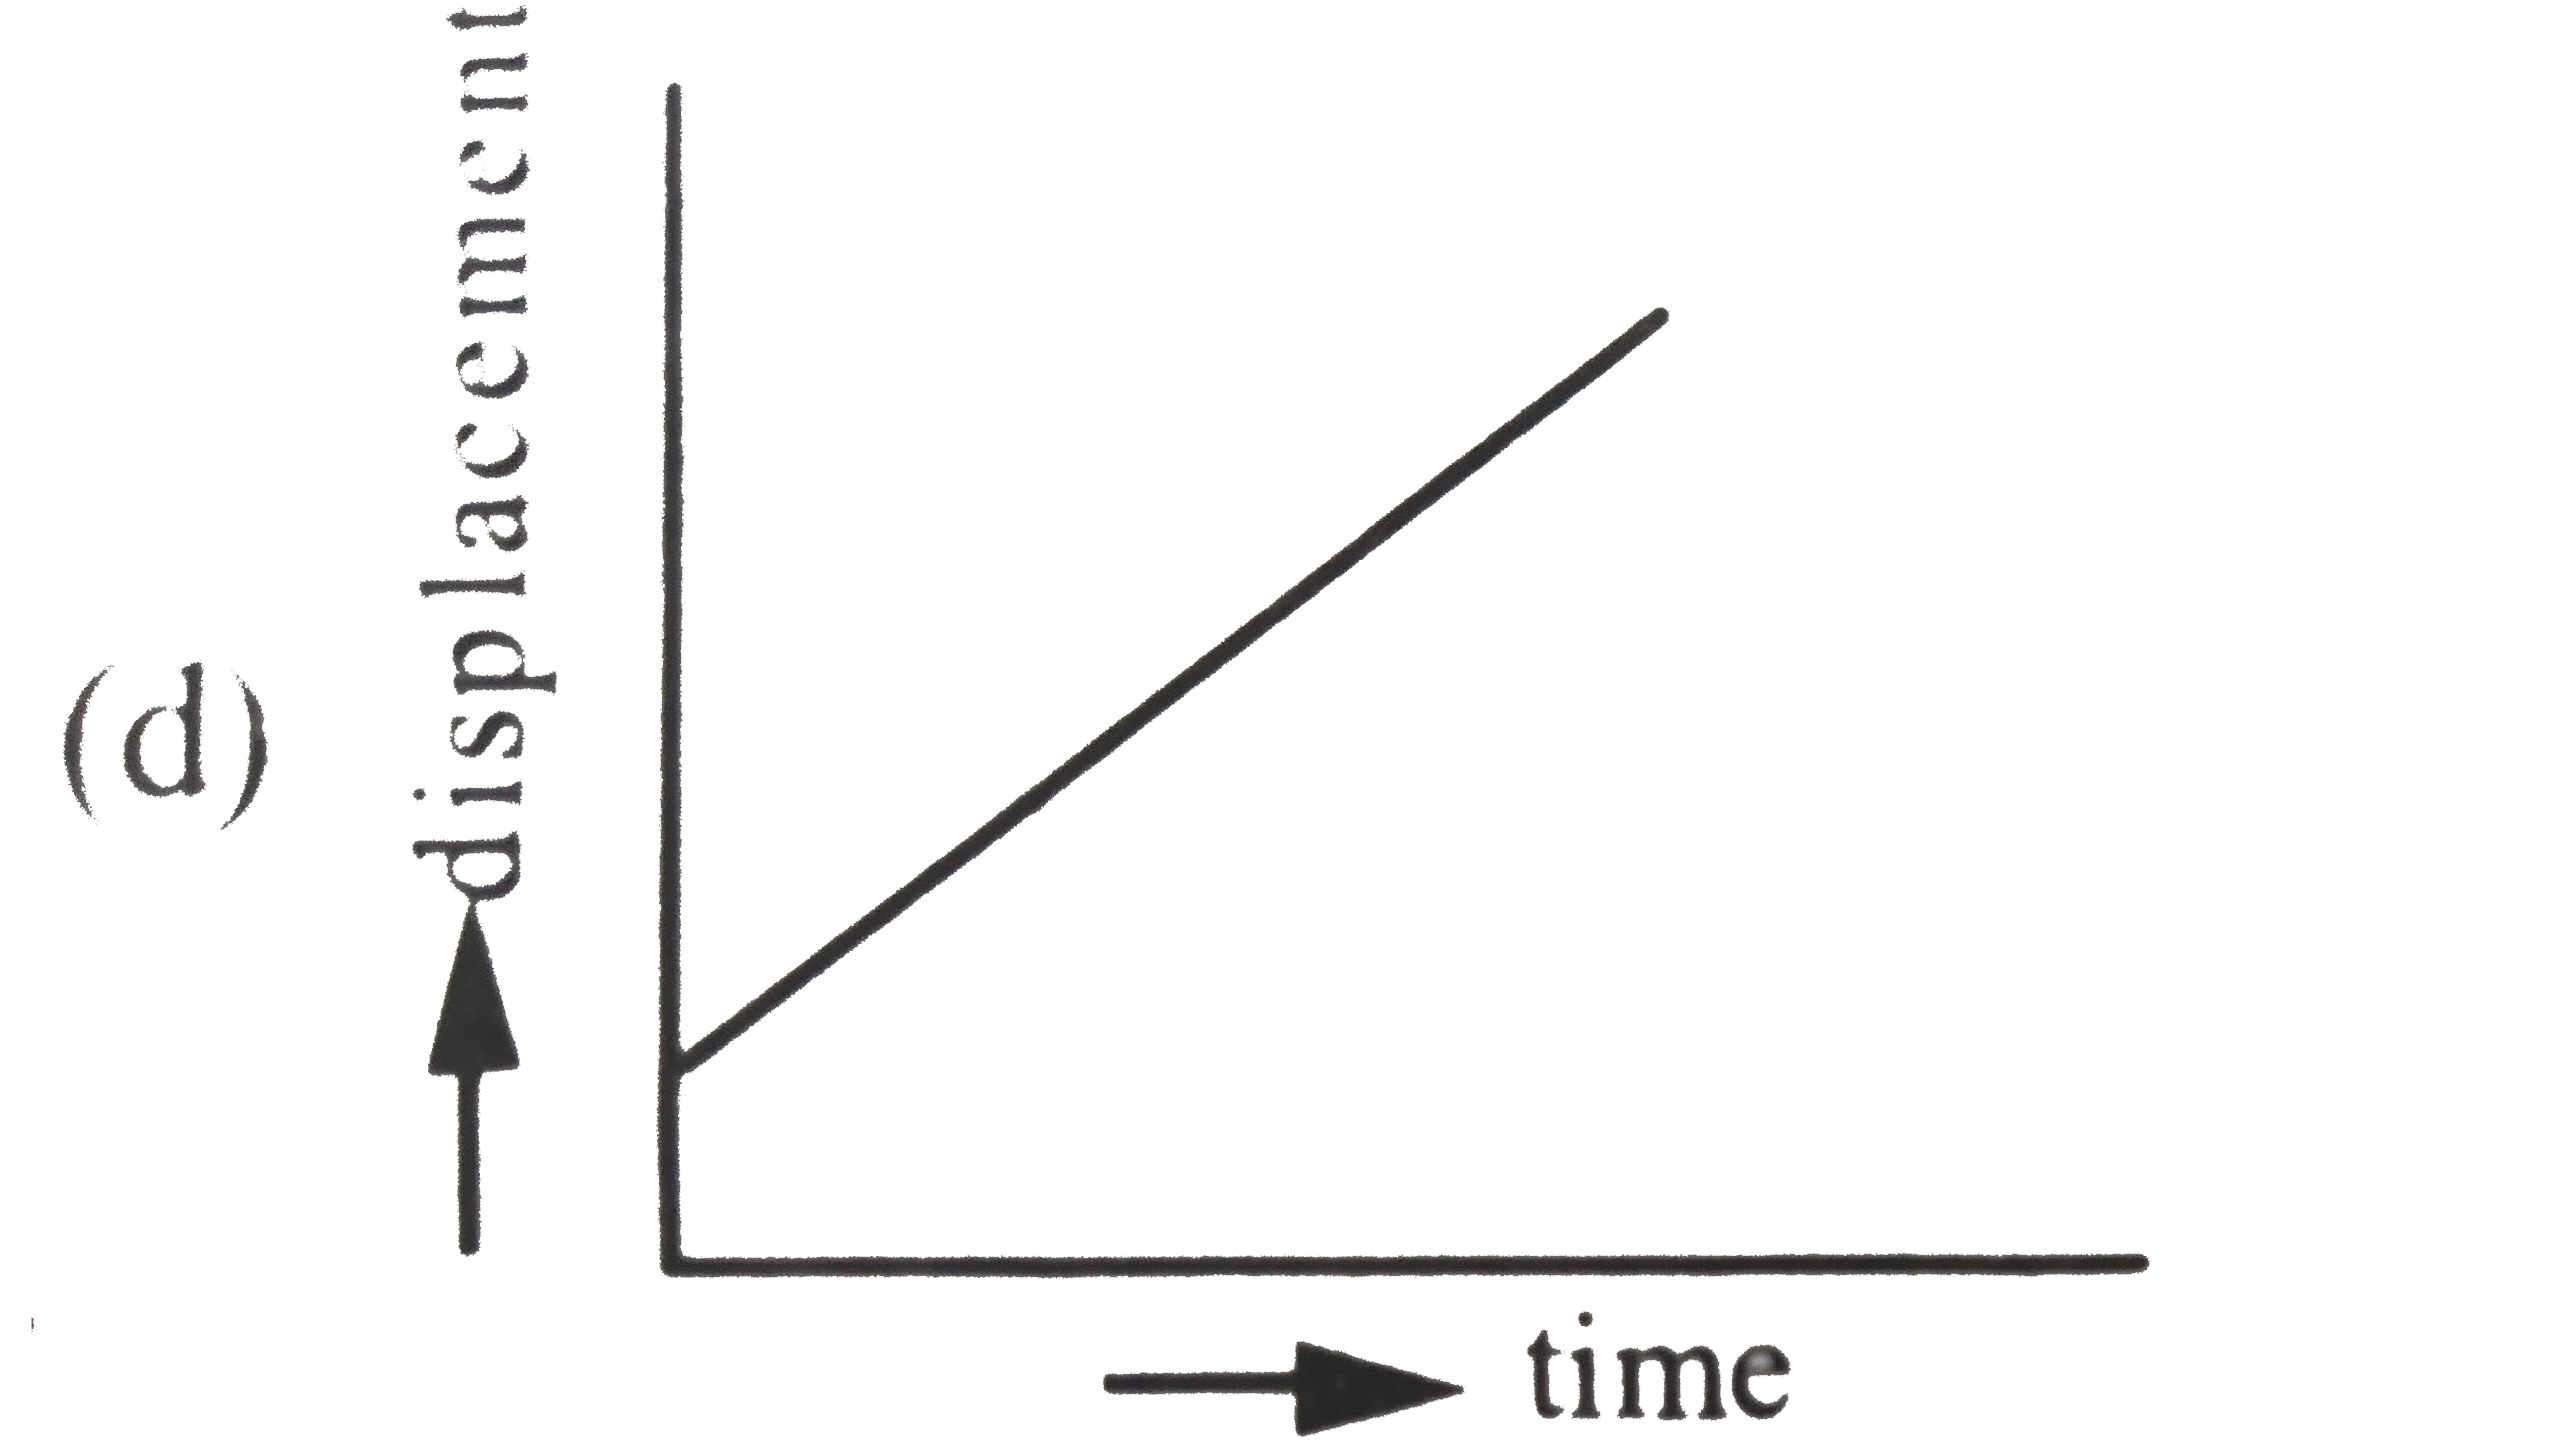
Which one of the following correctly represents the variation between linear momentum (P) and kinetic energy (E) ofa body?
A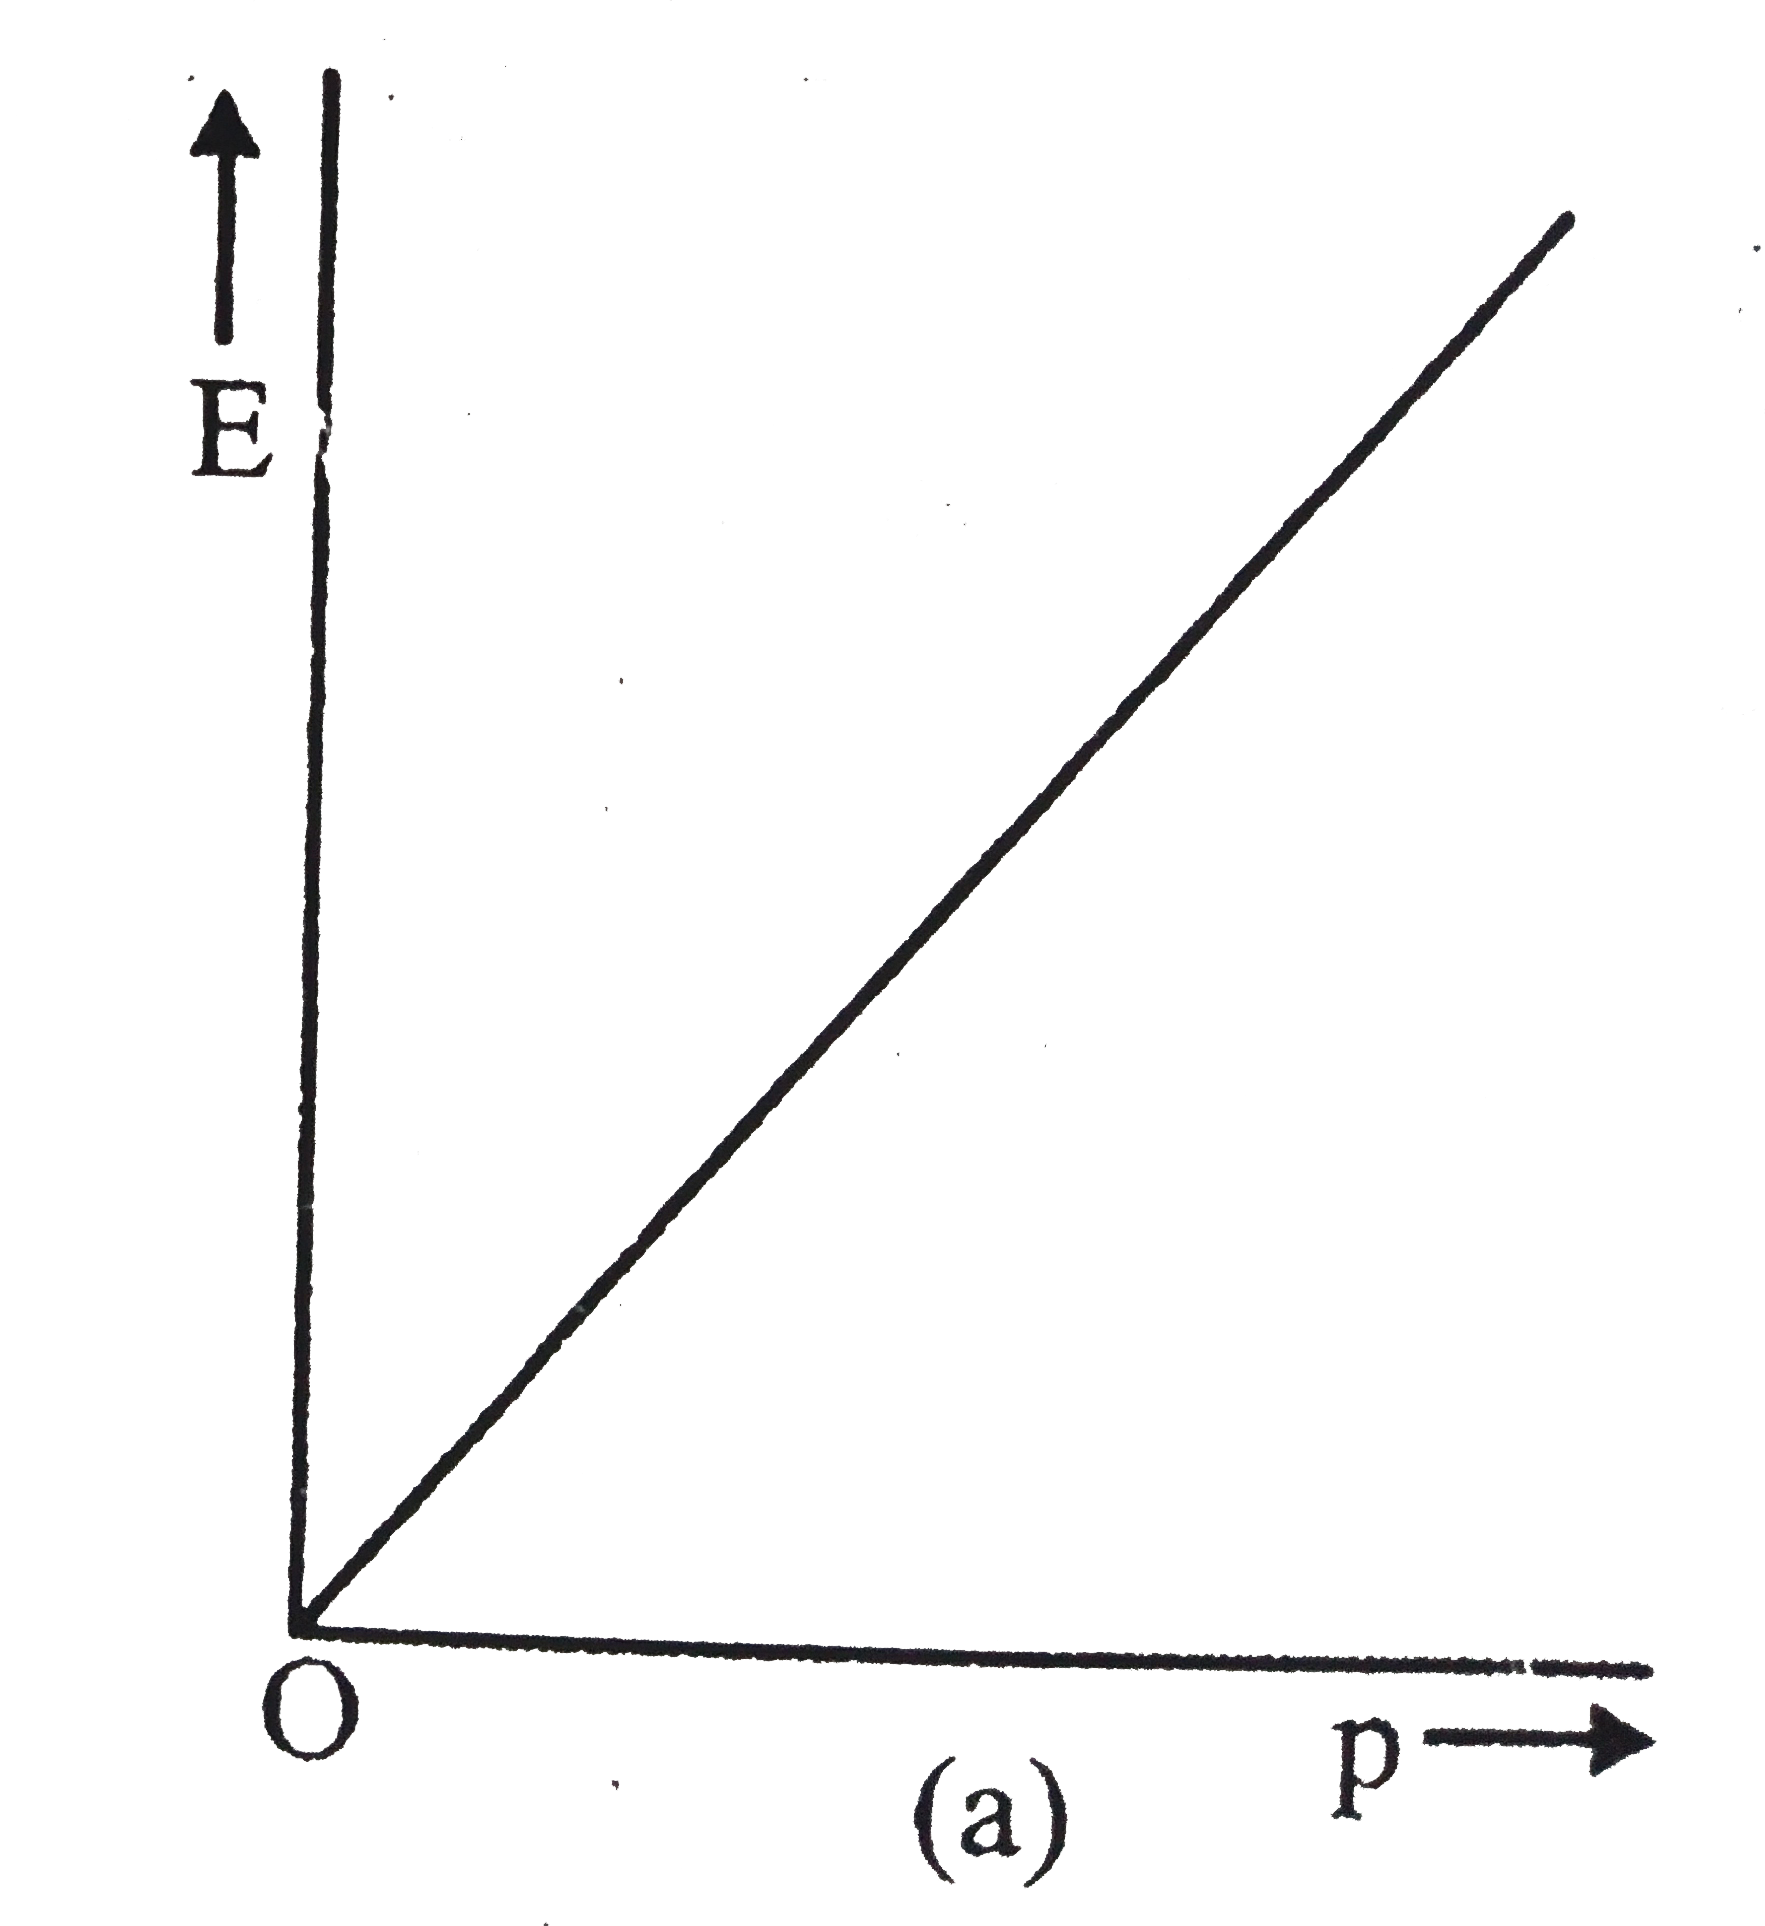 B
B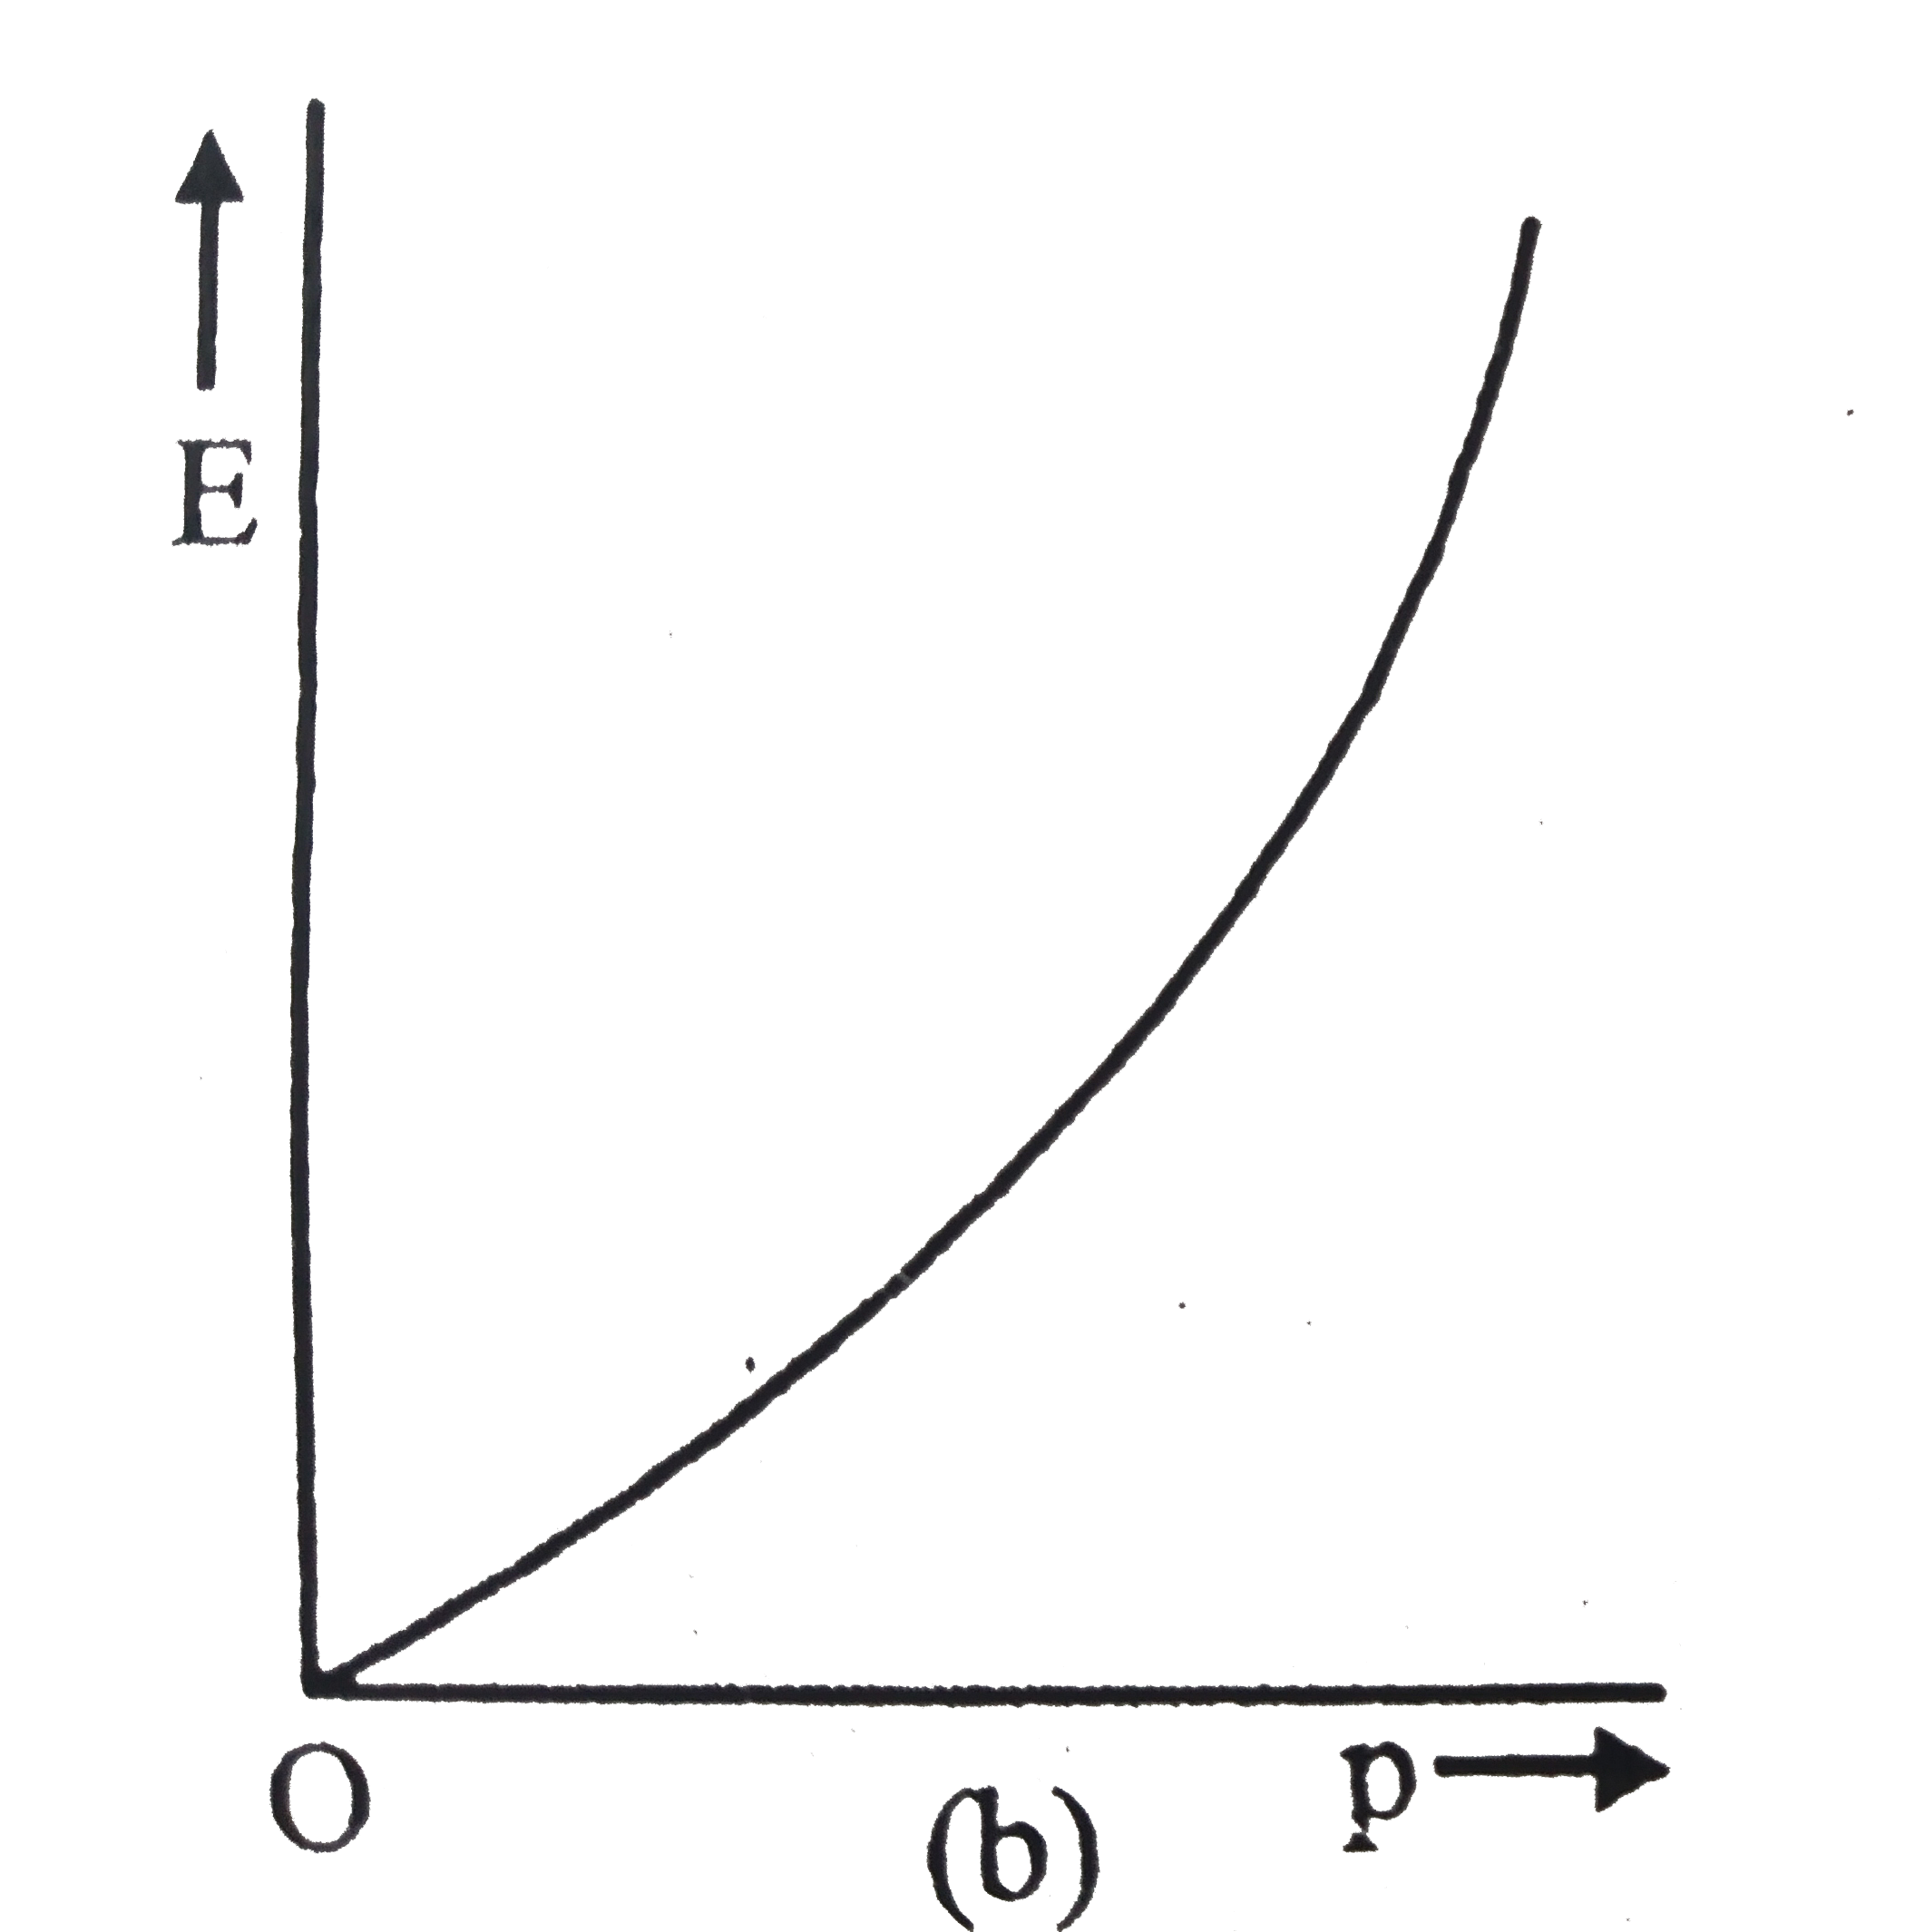 C
C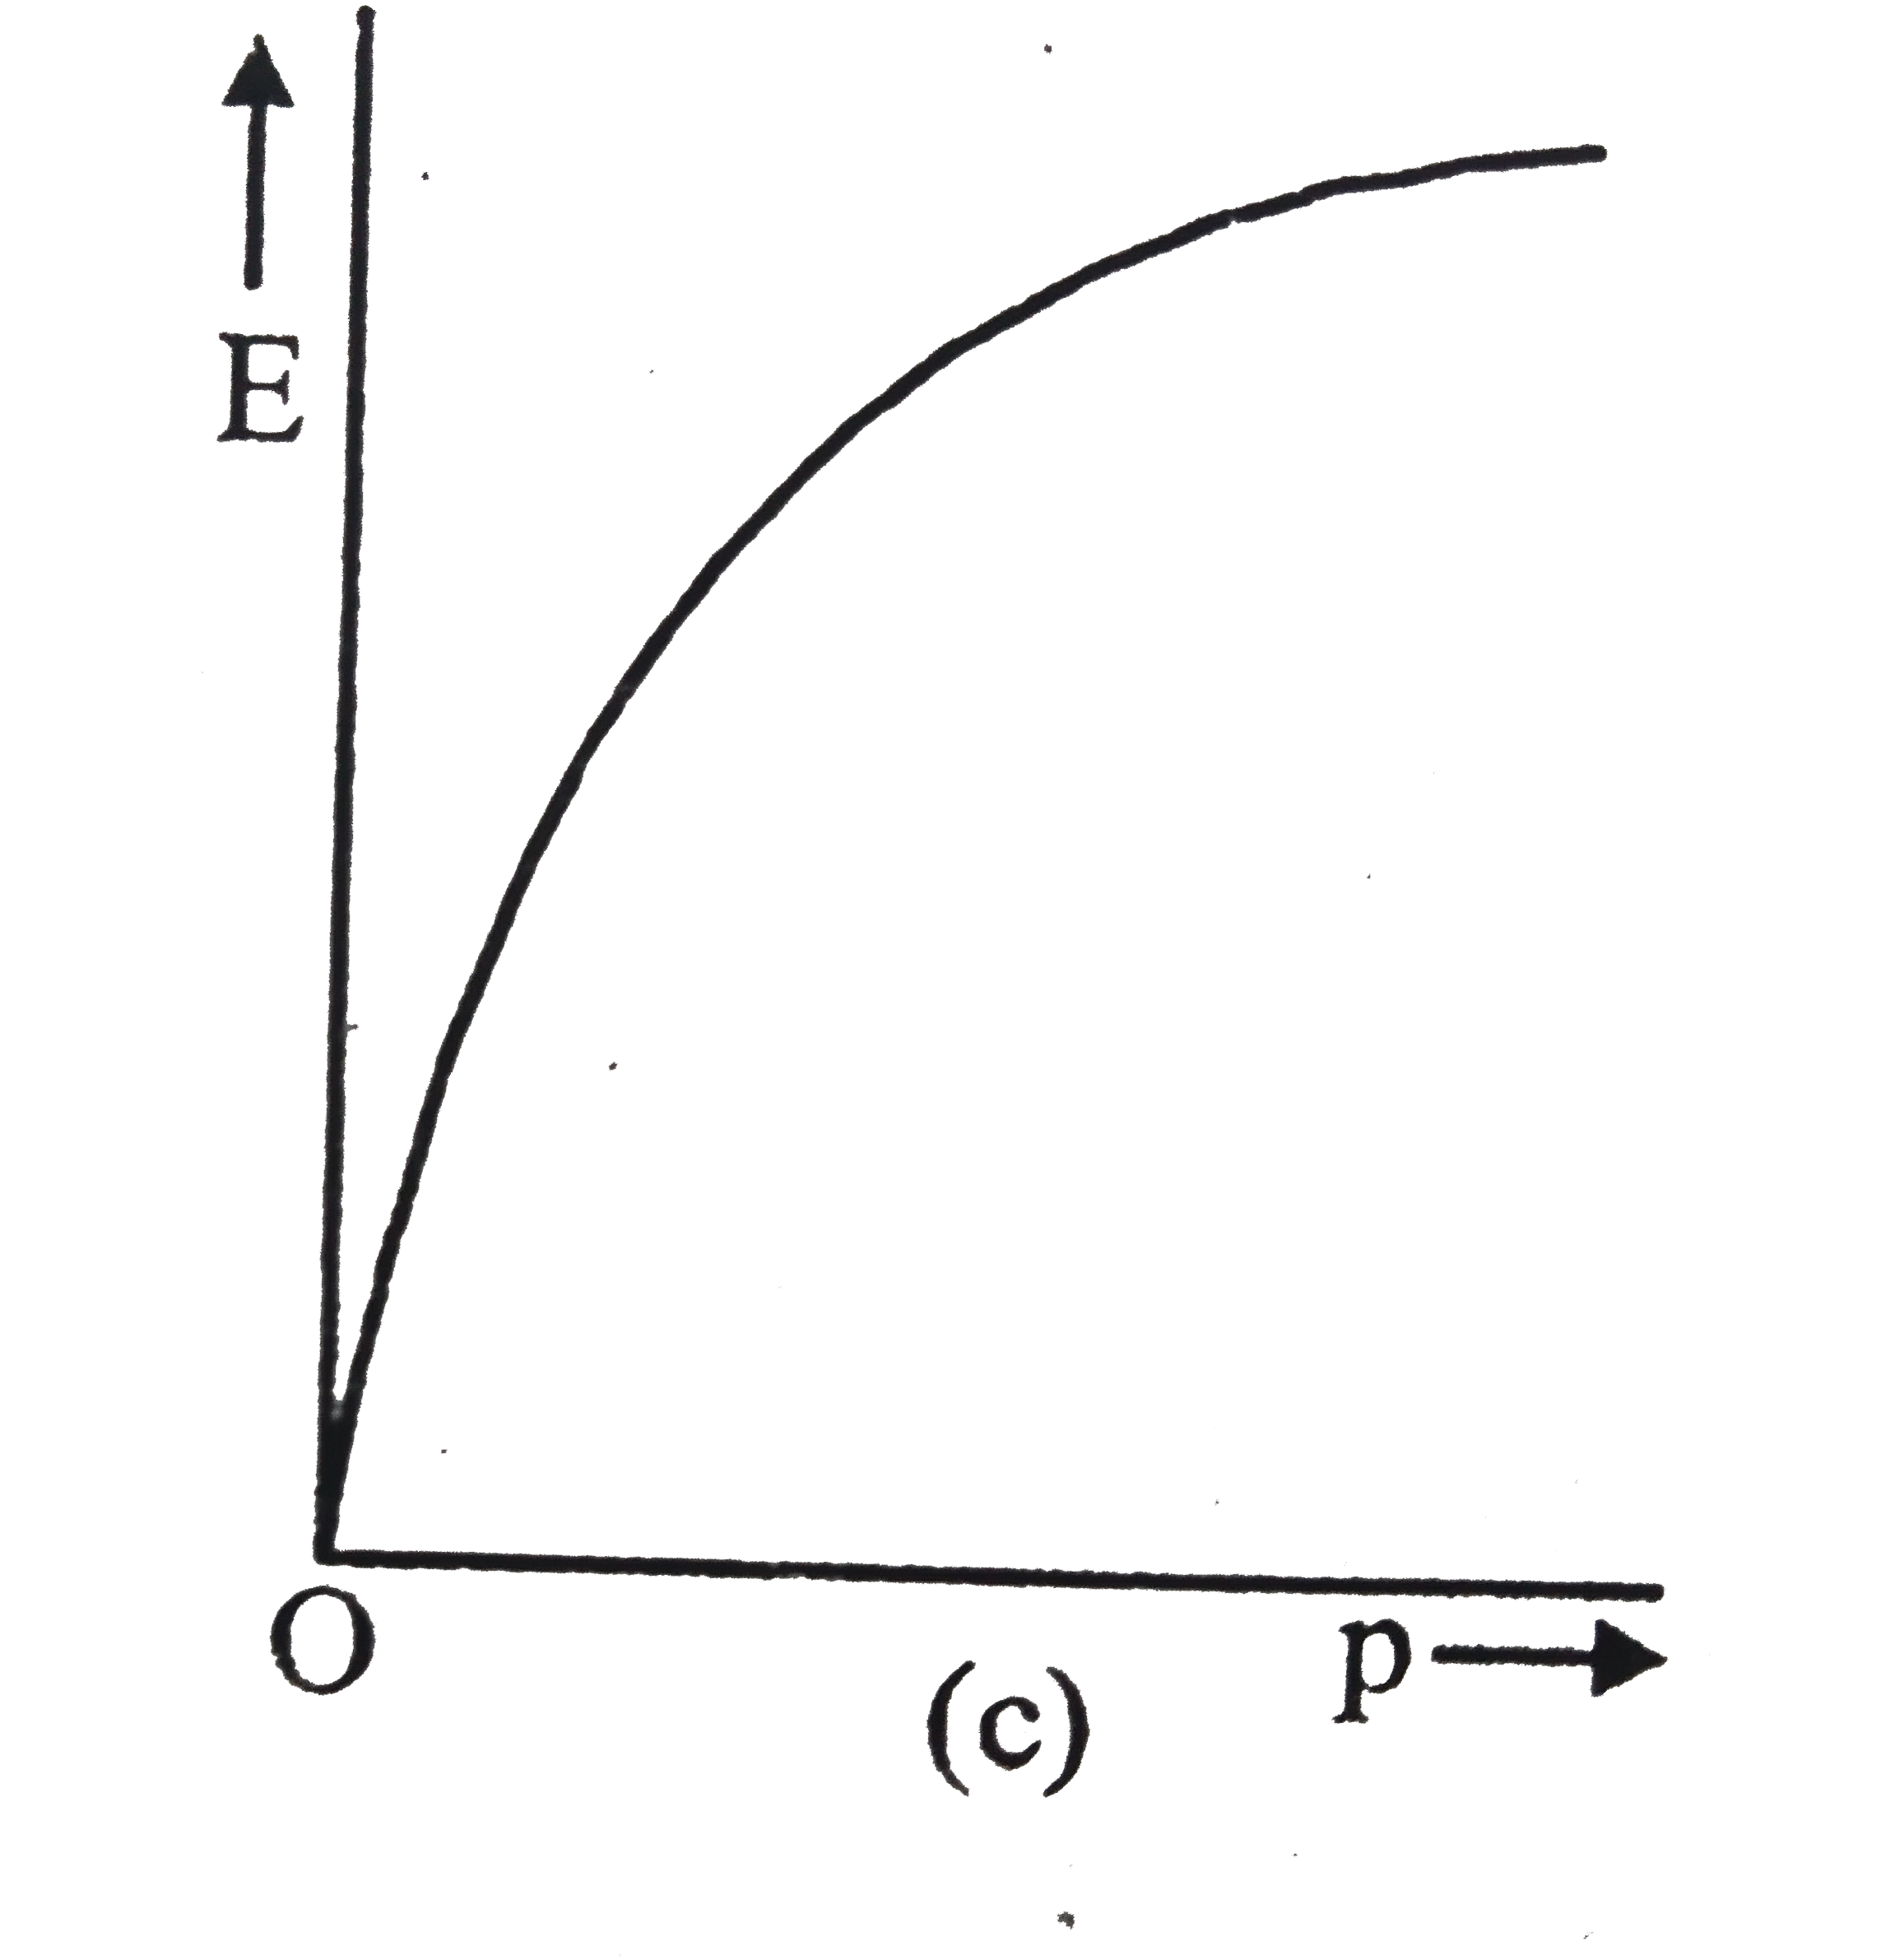 D
D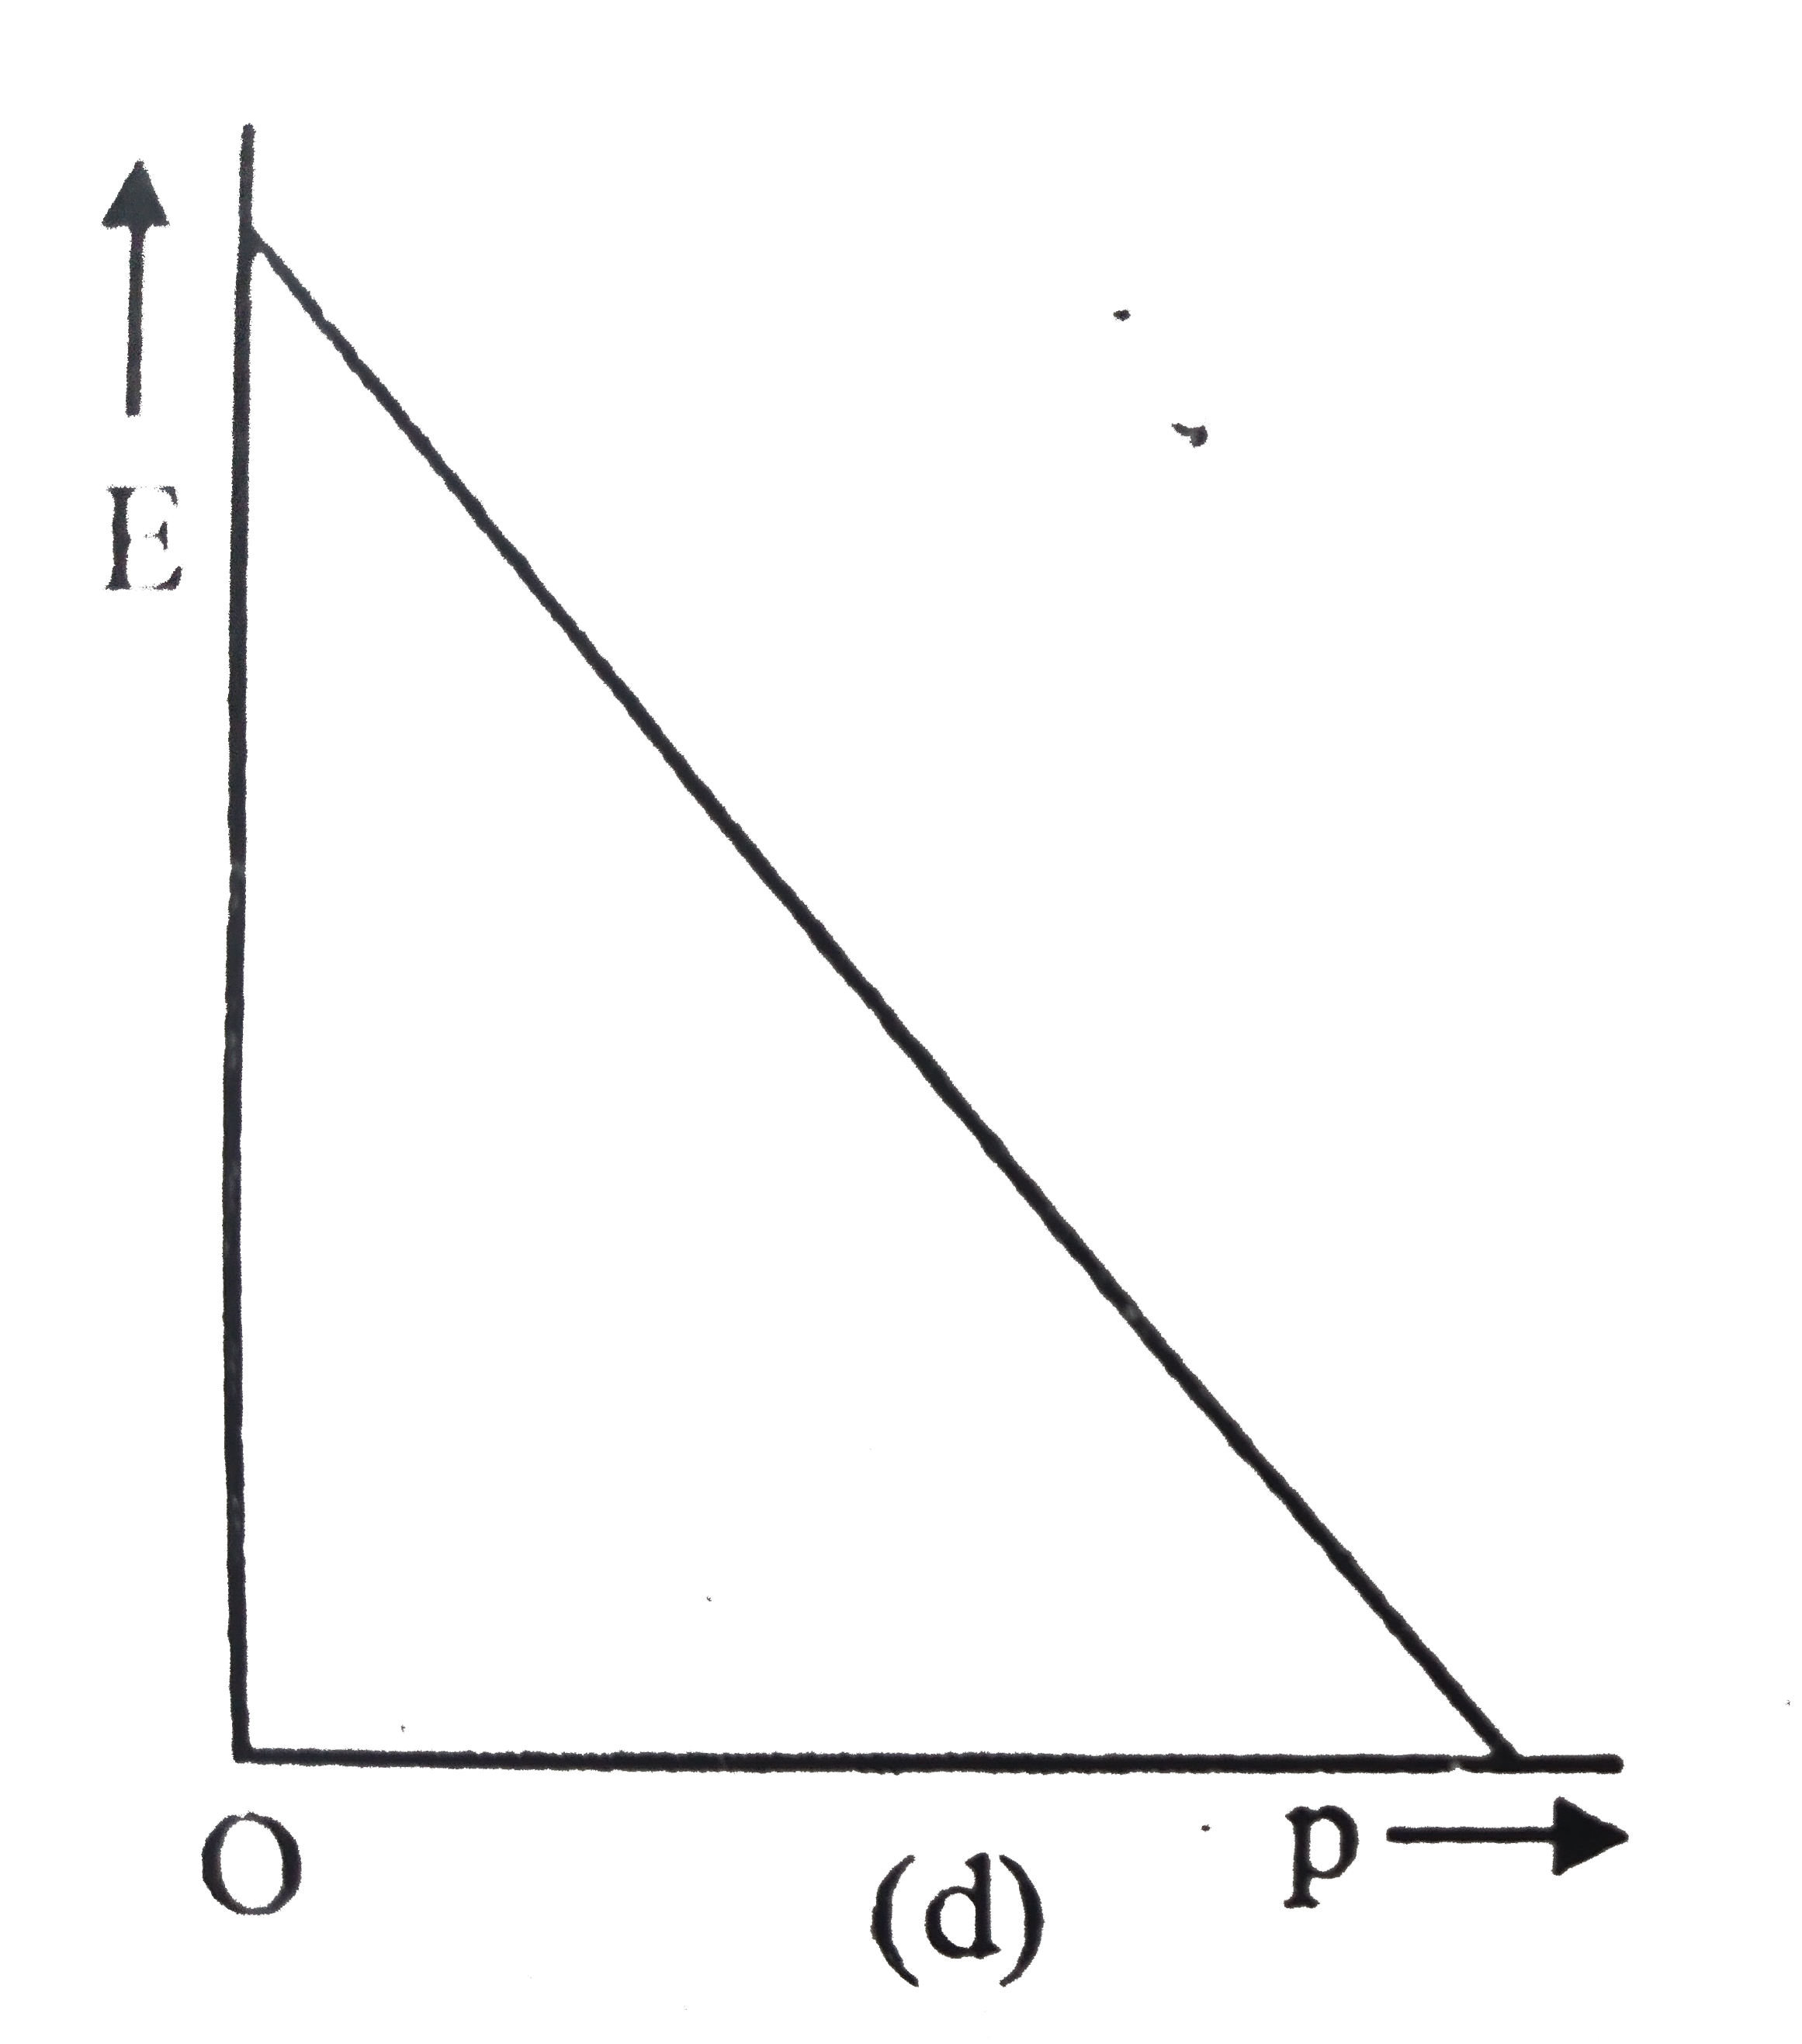
Which of the following graph represents uniform motion
A B
B C
C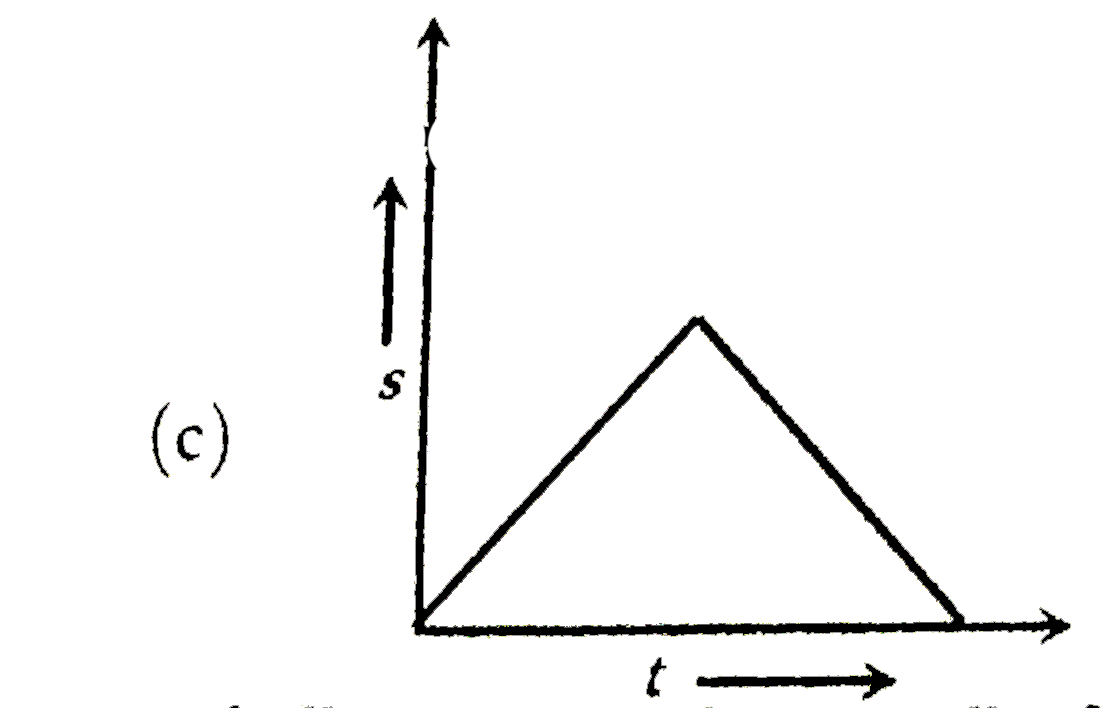 D
D
Which of the following graphs represent a uniformaly accelerated motion ?
View SolutionWhich of following graphs represent accelerated motion ?
View SolutionWhich of the following graphs best represents the motion of a raindrop?
View SolutionRelationship between angular momentum L and kinetic energy E of a rigid body in pure rotation is
View SolutionA body moves from rest with a constant ac- celeration. Which of the following graphs represents the variation of its kinetic energy (E) with distance travelled (x)?
View Solution

