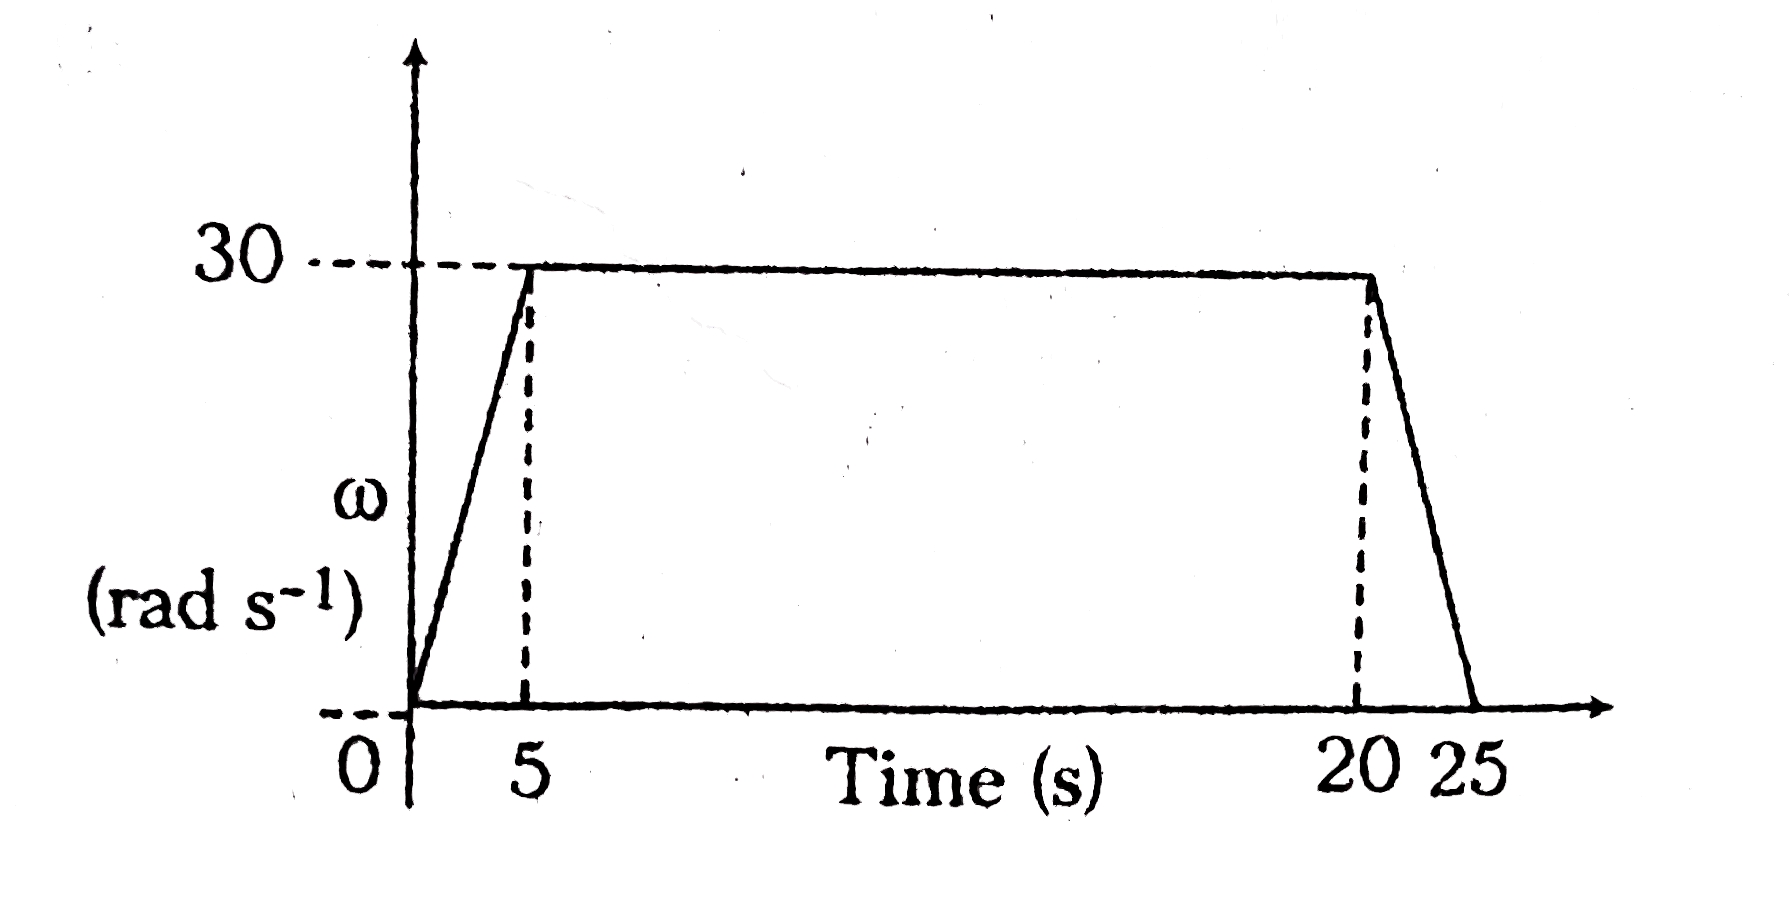
The figure shows the angular velocity versus time graph of a flywheel. The angle, in radians through which the flywheel turns during 25 s is
A
120
B
480
C
600
D
750
Video Solution
Text Solution
The correct Answer is:C
Angular rotated, θ= area under ω−t graph
area under ω−t graph = area of trapezium OABCO.
∵ of (OABCO) =12 (Sum of parallel sides) × distance between them
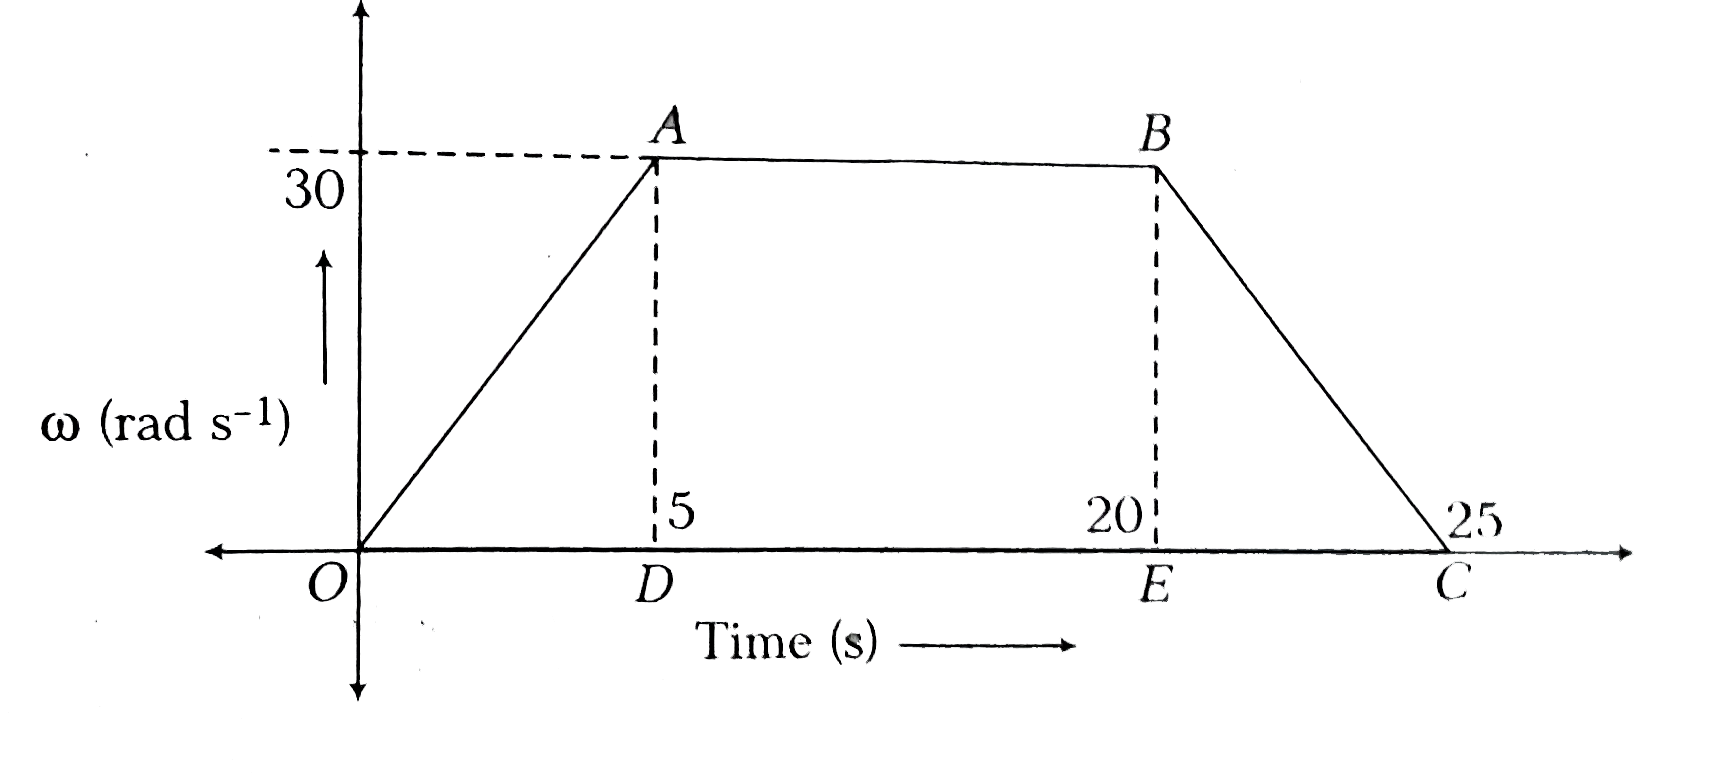
=12(AB+OC)×AD=12(15+25)×30=600.
|
Topper's Solved these Questions
- ROTATIONBook:DC PANDEYChapter:ROTATIONExercise:(B) Chapter Exercises
Explore 25 Videos
- ROTATIONBook:DC PANDEYChapter:ROTATIONExercise:(C) Chapter Exercises
Explore 39 Videos
- ROTATIONBook:DC PANDEYChapter:ROTATIONExercise:Check point 9.3
Explore 15 Videos
- RAY OPTICSBook:DC PANDEYChapter:RAY OPTICSExercise:Integer type q.
Explore 15 Videos
- ROTATIONAL MECHANICSBook:DC PANDEYChapter:ROTATIONAL MECHANICSExercise:Subjective Questions
Explore 2 Videos
Similar Questions
Knowledge Check
Figure shows a velocity-time graph. This shows that.
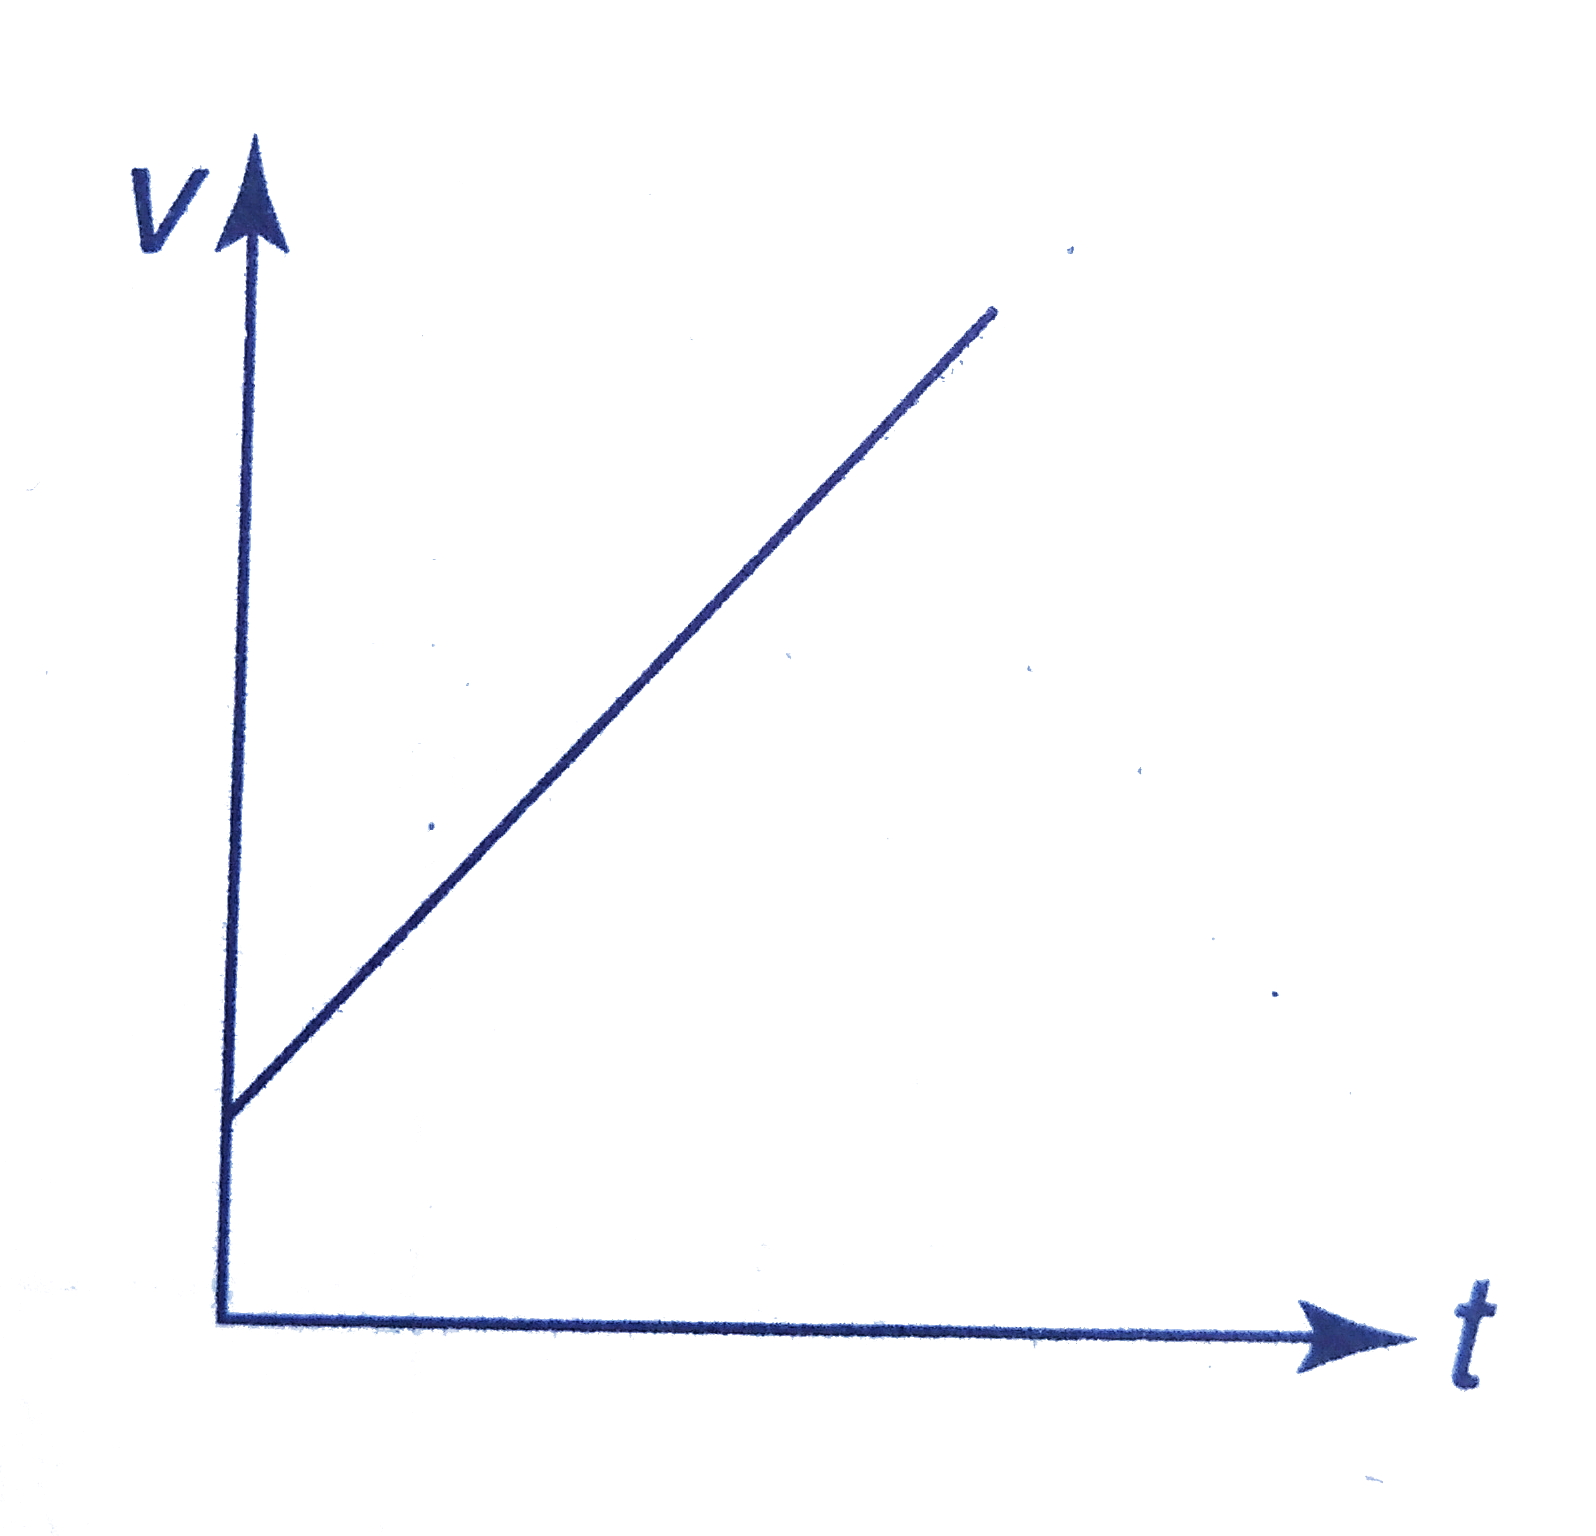 Athe body is at restBthe body starts from rest and moves with uniform velocityCthe body has some initial velocity and moves with uniform accelerationDthe motion is retarded
The velocity versus time graph of a body moving in a straight line is as shown in the figure below
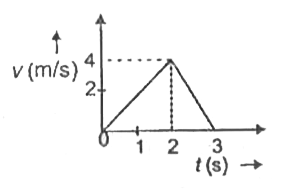 AThe distance covered by the body in 0 to 2s is 8mBThe acceleration of the body in 0 to 2s is 4ms−2CThe accelerationof the body in 2 to 3s is 4ms−2DThe distance moved by the body during 0 to 3 is 6 m
The following figure shows the velocity time graph of a body. According to this at the point B-
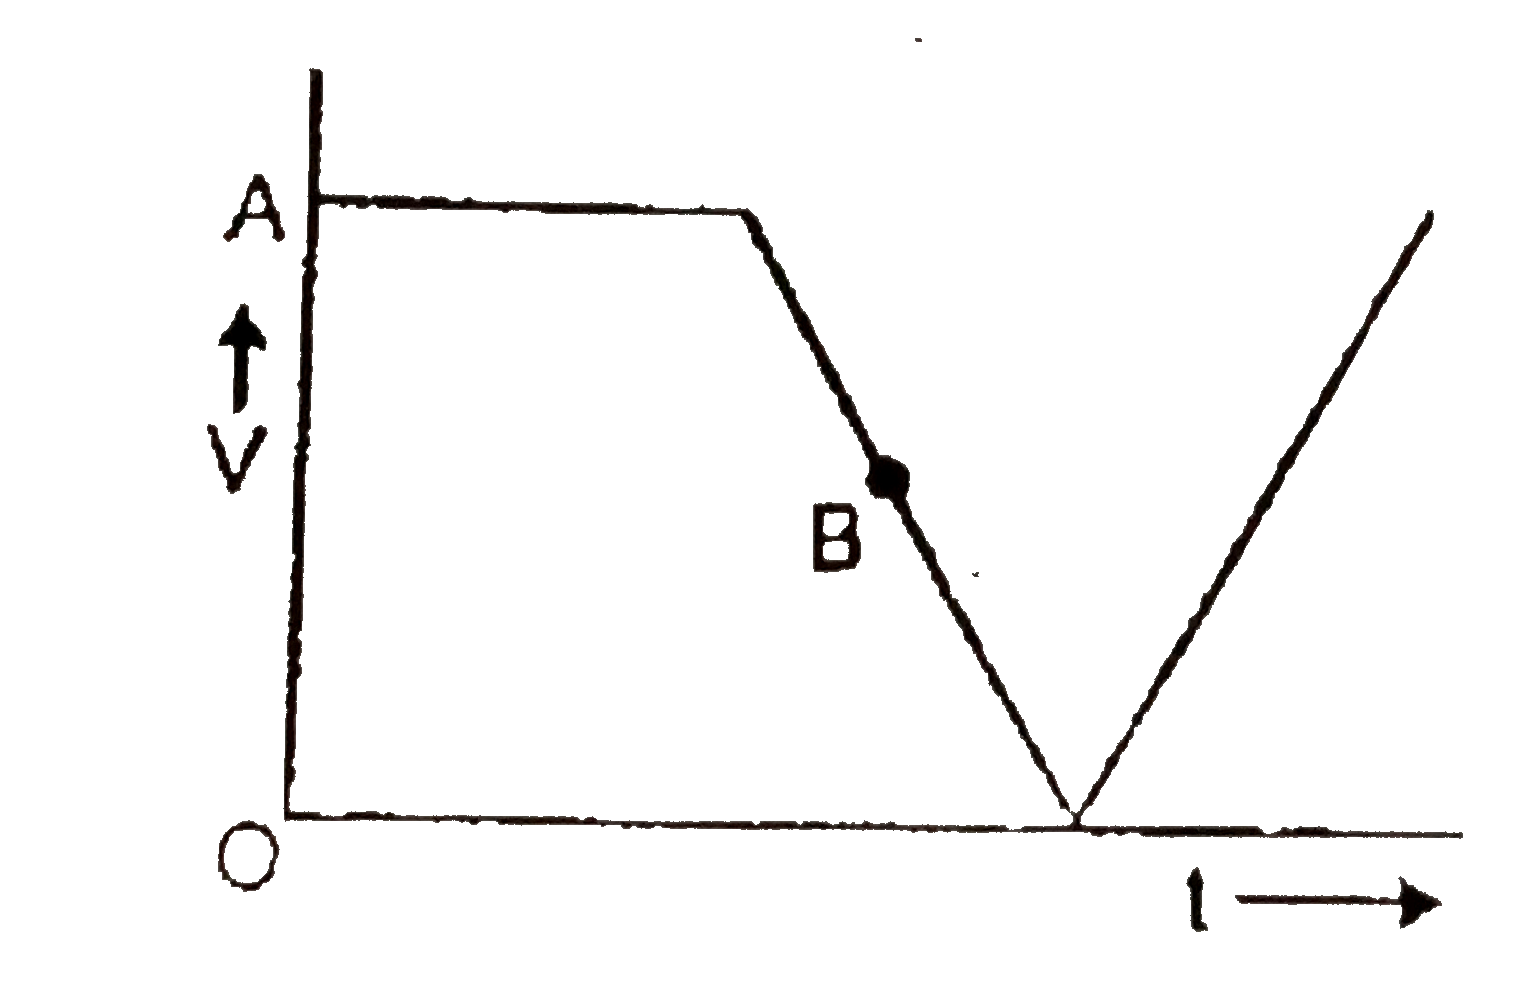 AThe force is zeroBThe force is in the direction of the motionCThe force is in opposite direction of the motionDIt is only the gravitational force
A wheel starts from rest and attains an angular velocity of 20 radian/s after being uniformly accelerated for 10 s. The total angle in radian through which it has turned in 10 second is
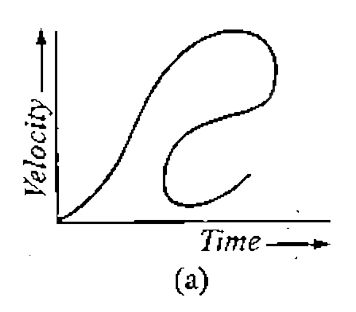
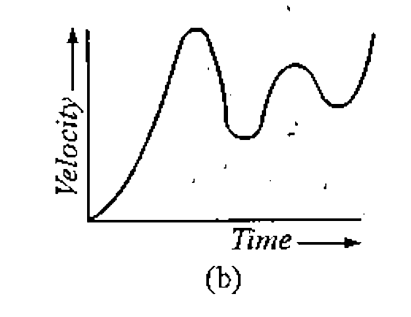
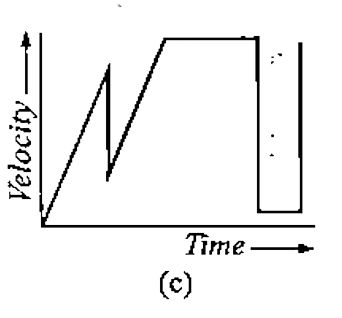
View SolutionFigure shows some velocity versus time graphs :
 ,
,  ,
,  ,
, 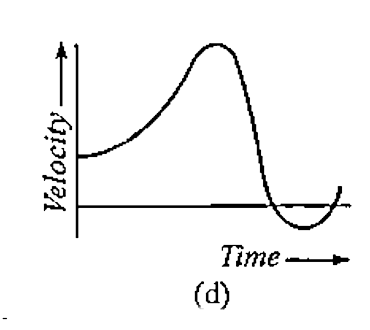
Only some of these can be realised in practice.These are:
View SolutionA wheel rotates with a constant angular velocity of 600 rpm. What is the angle through which the wheel rotates in 1s?
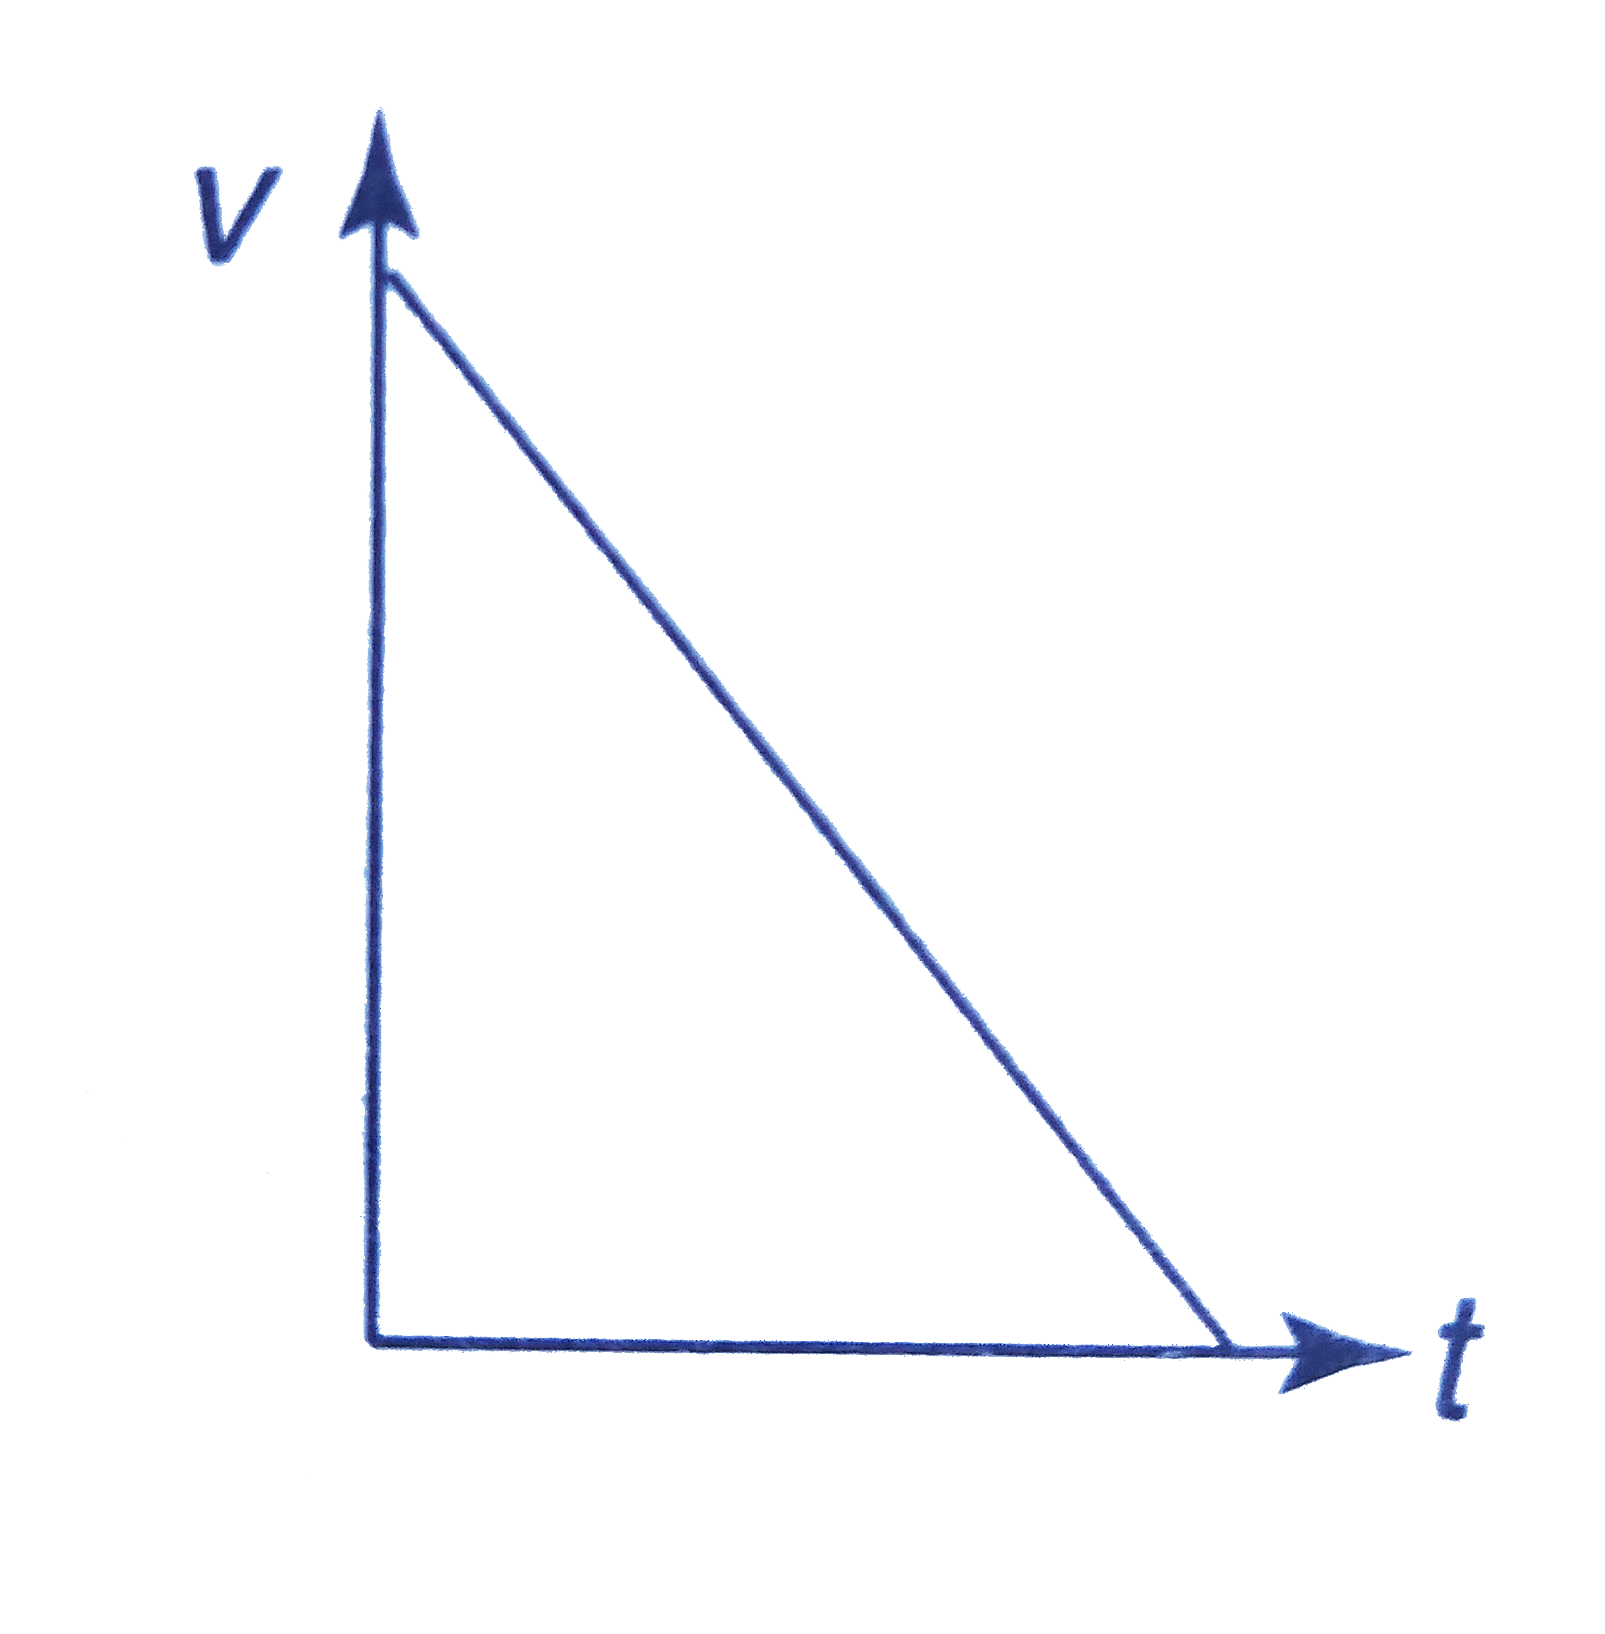
View SolutionFigure gives the velocity-time graph. This shows that the body is.
View SolutionA wheel rotates with a constant angular velocity of 300 rpm. The angle through which the wheel rotates in 1 s is.
View Solution


