
The graph above shows a compact car's fuel economy as a function of speed. Which of the following is true ?
The rate of increase in fuel economy below 50 miles per hour is greater than the rate of decrease in fuel economy above 50 miles per hour.
The rate of increase in fuel economy below 50 miles per hour is equal to the rate of decrease in fuel economy above 50 miles per hour.
The rate of increase in fuel economy below 50 miles per hour is less than the rate of decrease in fuel economy above 50 miles per hour.
Fuel economy peaks at 50 miles per hour, but nothing can be said about the rates of change in fuel economy abov e and below 50 miles per hour.
The correct Answer is:C
Examine the graph and look for trends in the rate of increase and decrease of fuel economy before and after 50 mph. Note the increase below 50 mph (to the left of 50 on the horizontal axis) and the decrease above 50 mph (to the right of 50): the decreasing part of the graph is steeper than the increasing part. In other words, the rate of increase below 50 mph is less than the rate of increase above 50 mph. Choice (C) is correct.
Related Playlists
- BOOK - KAPLANCHAPTER - FUNCTIONS EXERCISE - FUNCTION NOTATION1videos
FUNCTIONS
- BOOK - KAPLANCHAPTER - FUNCTIONS EXERCISE - GRAPHS OF FUNCTIONS1videos
FUNCTIONS
- BOOK - KAPLANCHAPTER - FUNCTIONS EXERCISE - DESCRIBING REAL-LIFE SITUATIONS WITH FUNCTIONS1videos
FUNCTIONS
- BOOK - KAPLANCHAPTER - EXPONENTS, RADICALS, POLYNOMIALS, AND RATIONAL EXPRESSIONSEXERCISE - RATIONAL EXPRESSIONS AND EQUATIONS1videos
EXPONENTS, RADICALS, POLYNOMIALS, AND RATIONAL EXPRESSIONS
- BOOK - KAPLANCHAPTER - GEOMETRY EXERCISE - THREE-DIMENSIONAL FIGURES1videos
GEOMETRY
Similar Questions
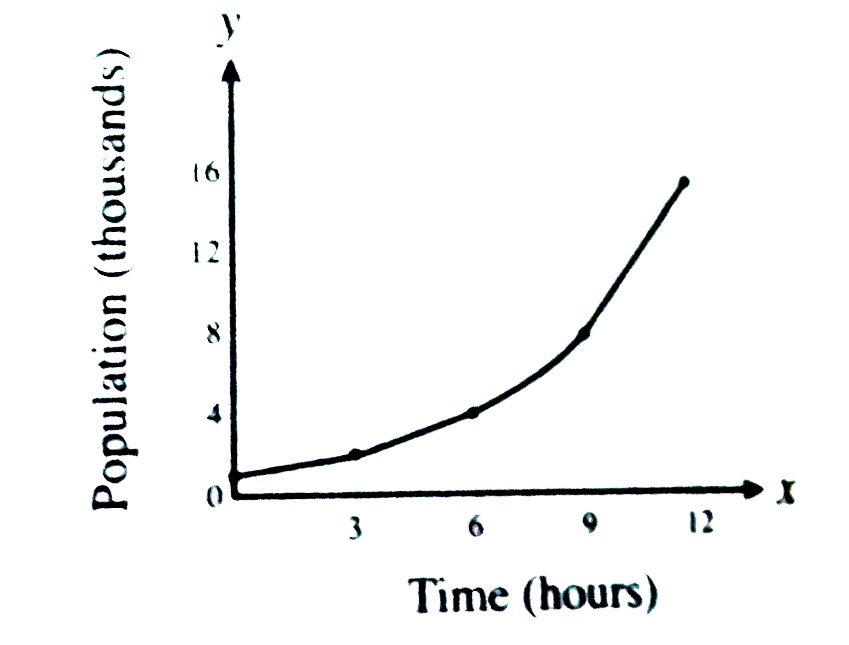
The graph above shows the size of a certain population after time t. Which of the following equations correctly shows y as a function of t ?View SolutionWhich of the following graph is a function?
View Solution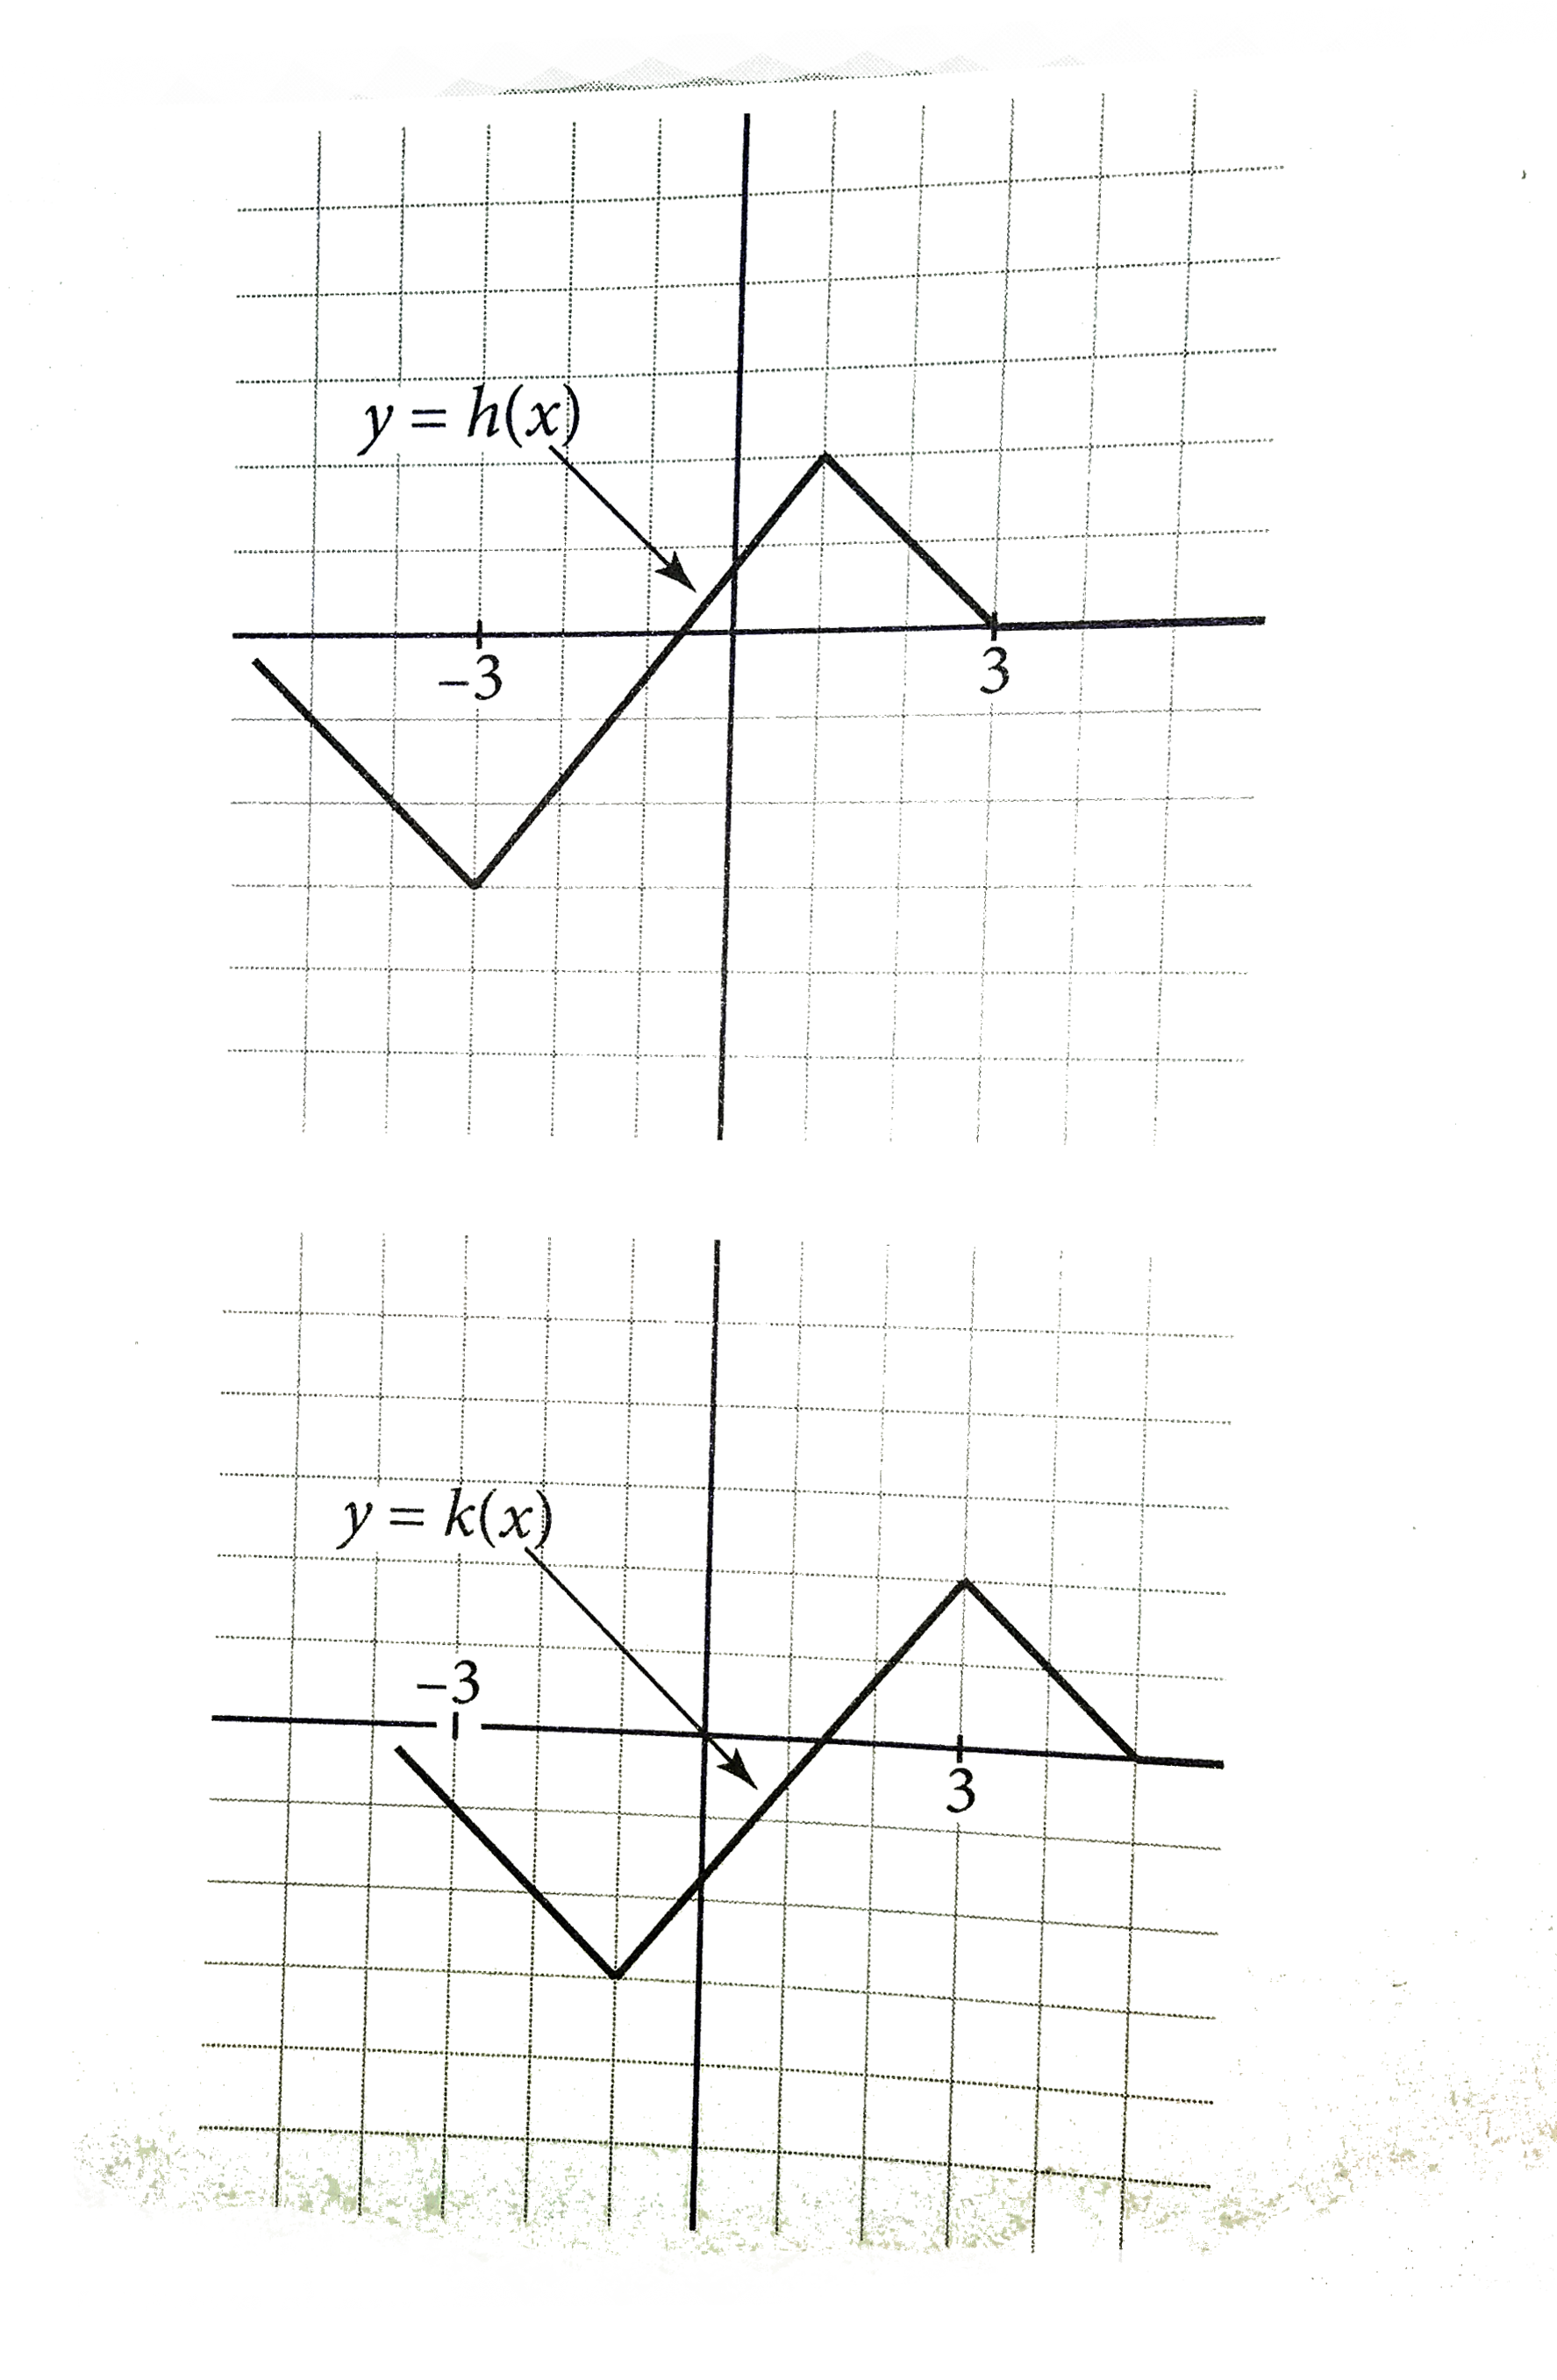
The graphs above show the complete functions h and k. which one of the following expresses k(x) in terms of h(x)?View SolutionV(y)=15,000(12)y3
Leah buys a car,which loses value exponentially over time.The function v above models the value of car y years after Leah buys it. Based on the function above,which of the following is true?View SolutionThe graph given show the position of two cars A and B as a function of time. The cars move along the x axis on parallel but separate tracks, so that they can pass each other's position without colliding.
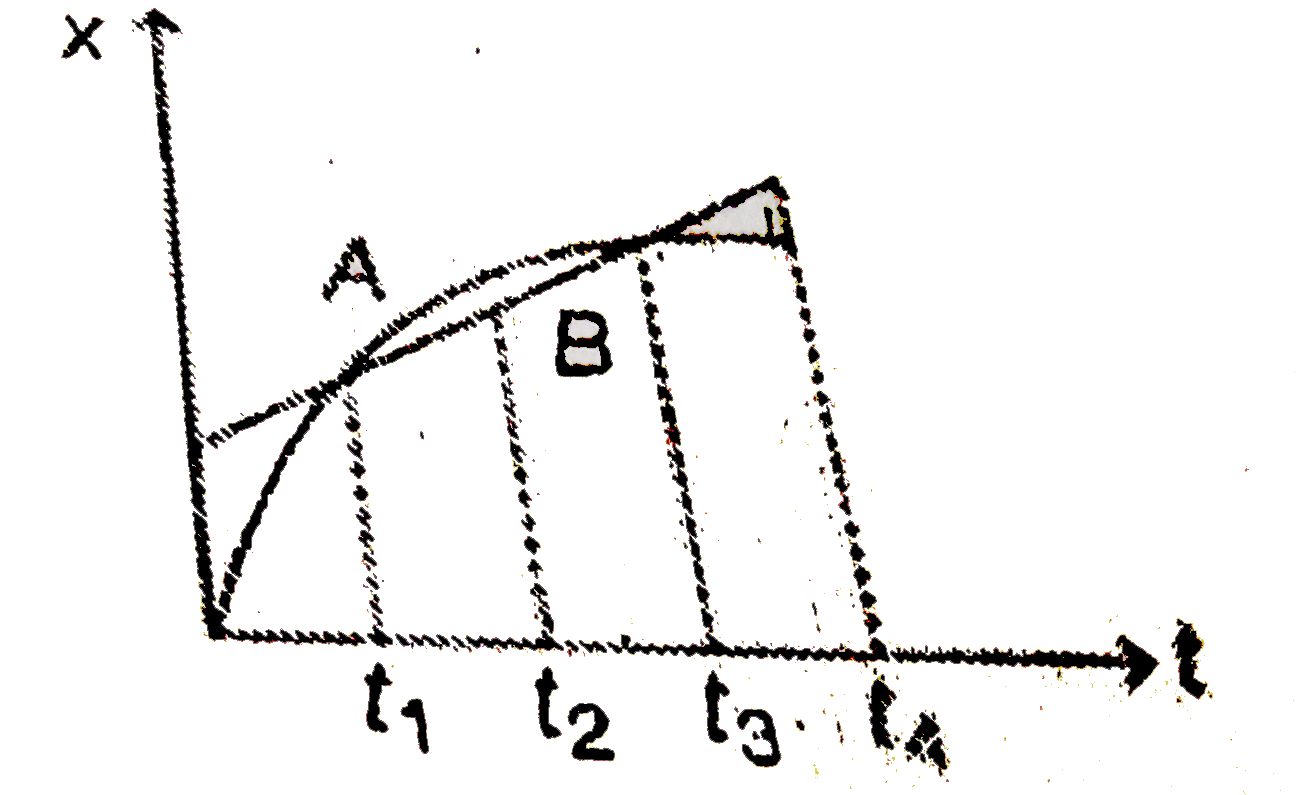
Which one of the following best describes the motion of car A as shown on the graphs?View SolutionThe graph given show the position of two cars A and B as a function of time. The cars move along the x axis on parallel but separate tracks, so that they can pass each other's position without colliding.

Which one of the following best describes the motion of car A as shown on the graphs?View SolutionWhich of the following graphs is NOT a function ?
View Solution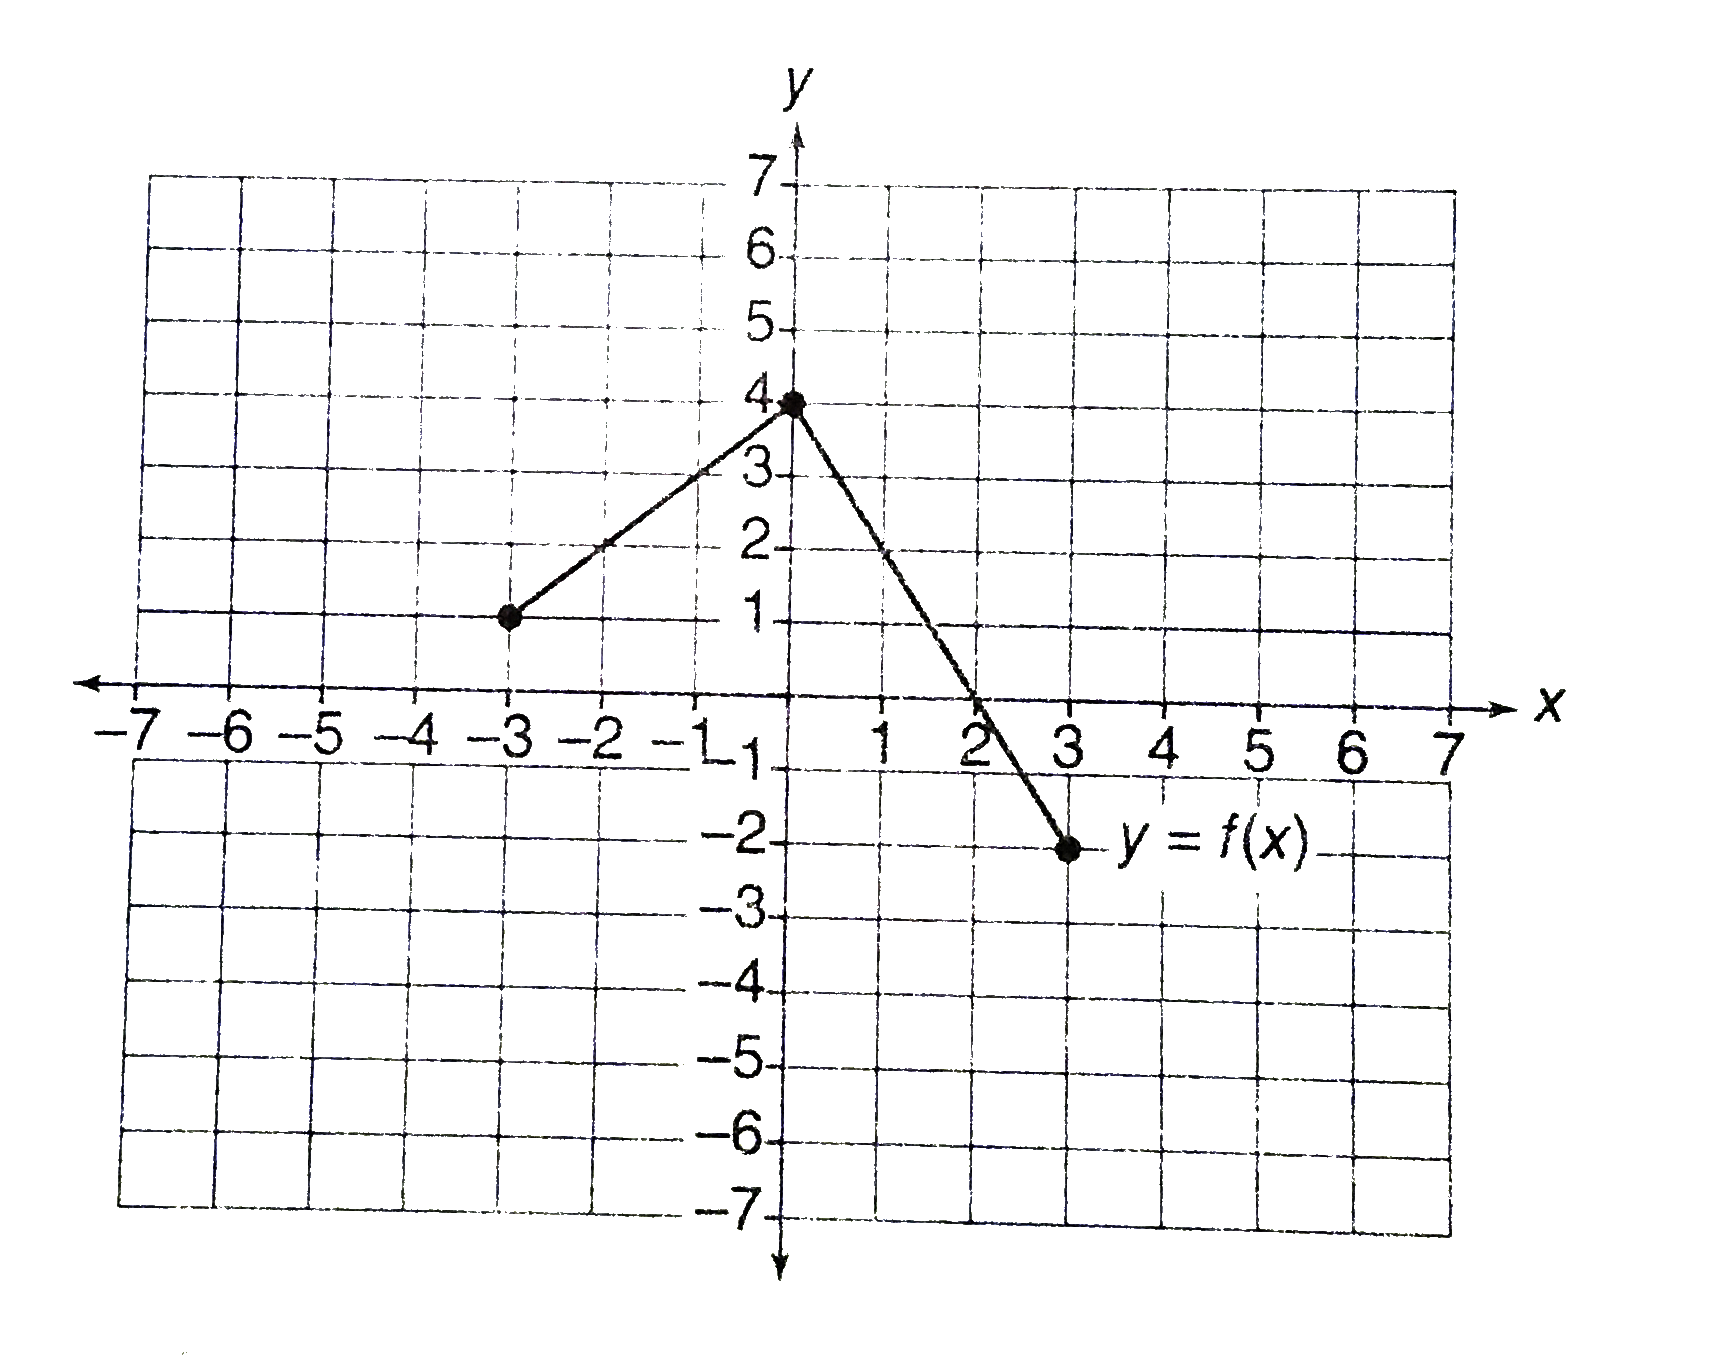
If the accomanying figure above shows the graph of function f, which of the following could represent the graph of y=f(x+1)?View SolutionA car parked on a road side from sometimes , starts moving with a constant speed . Which of the following distance- time graph shows the motion of that car ?
View Solution
If the graph above shows the function f(x)=x3, which one of the following graphs shows f(x)=(x+2)2−3?View Solution

