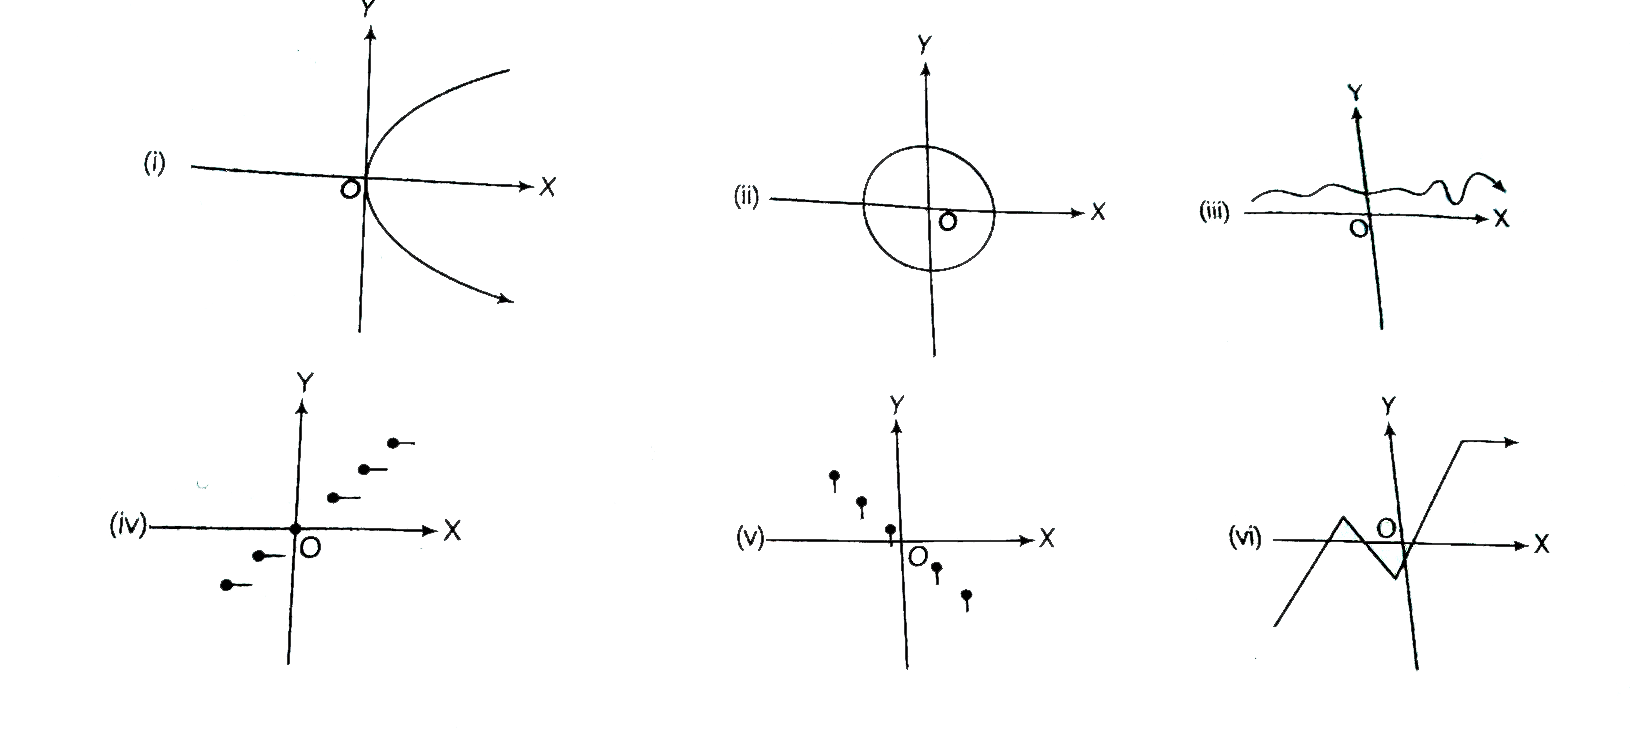
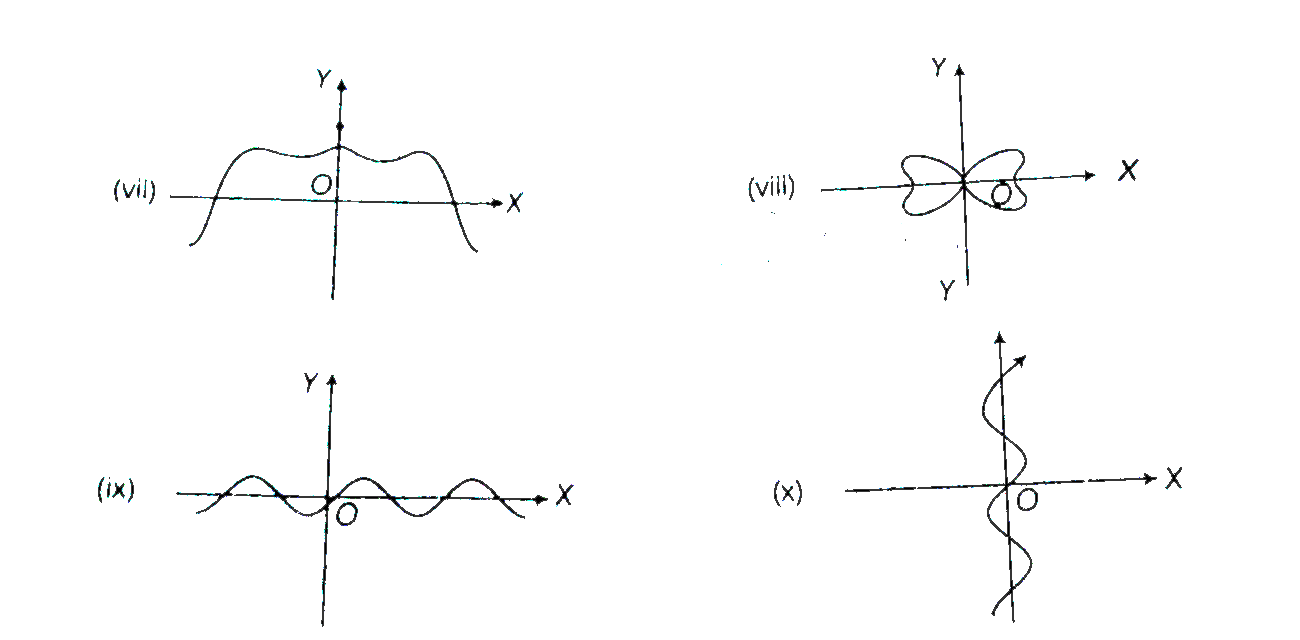
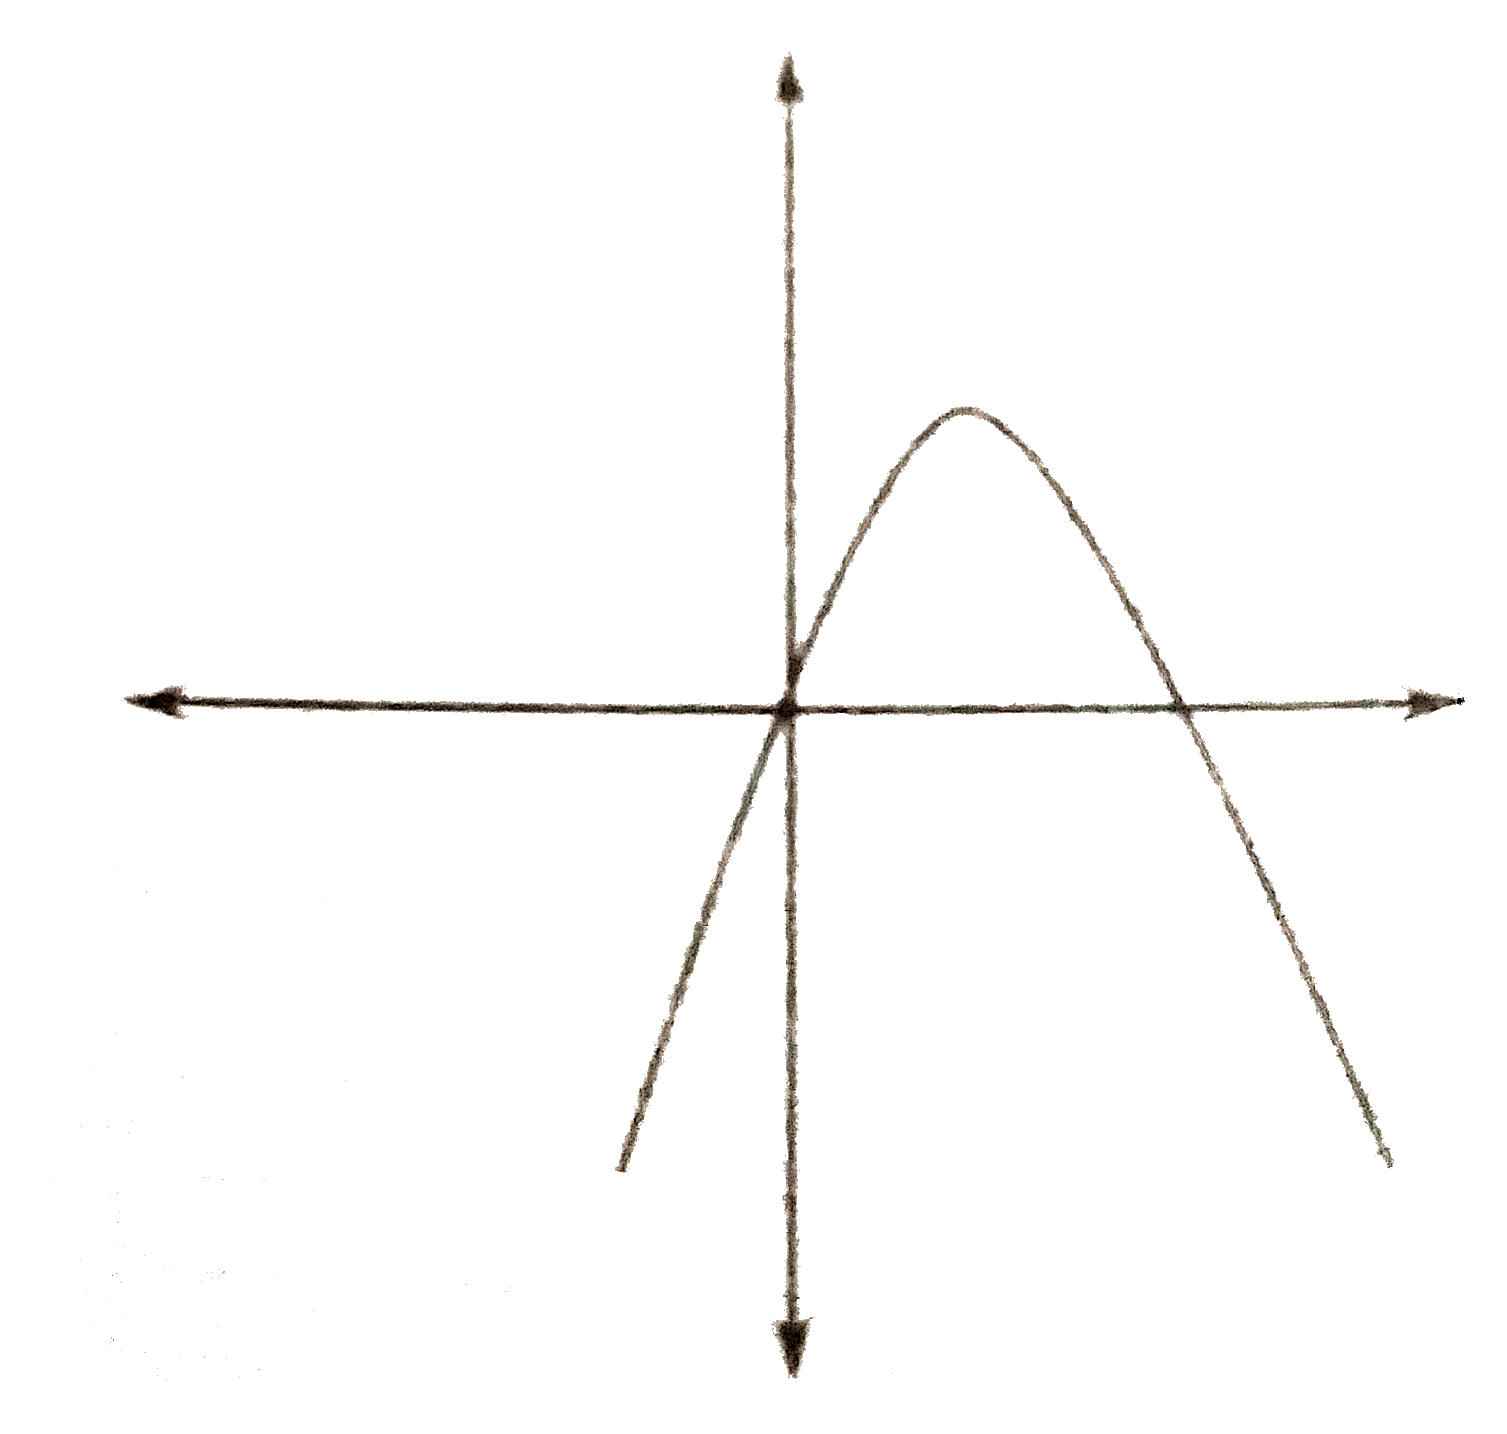
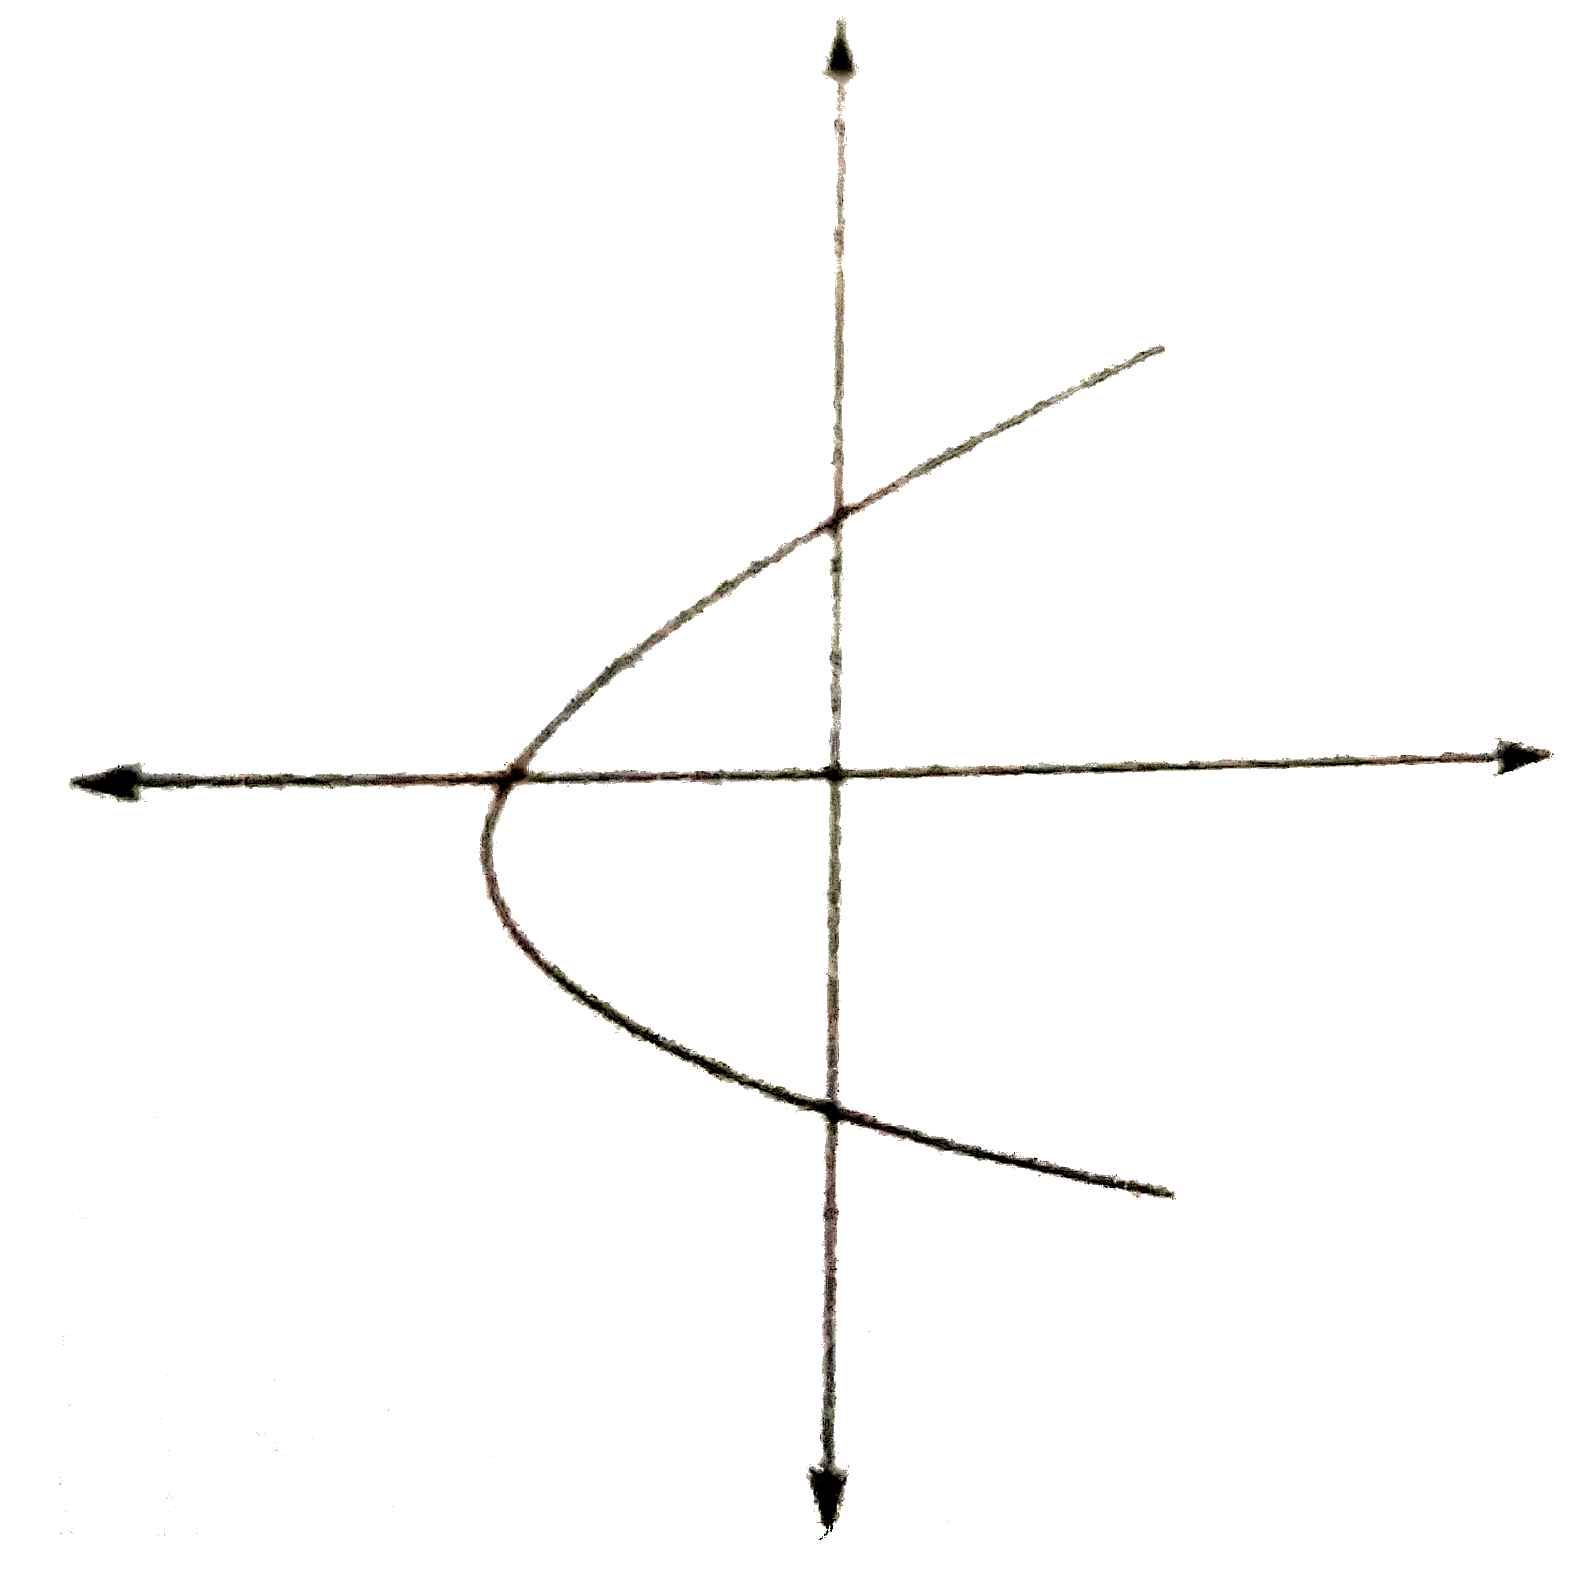
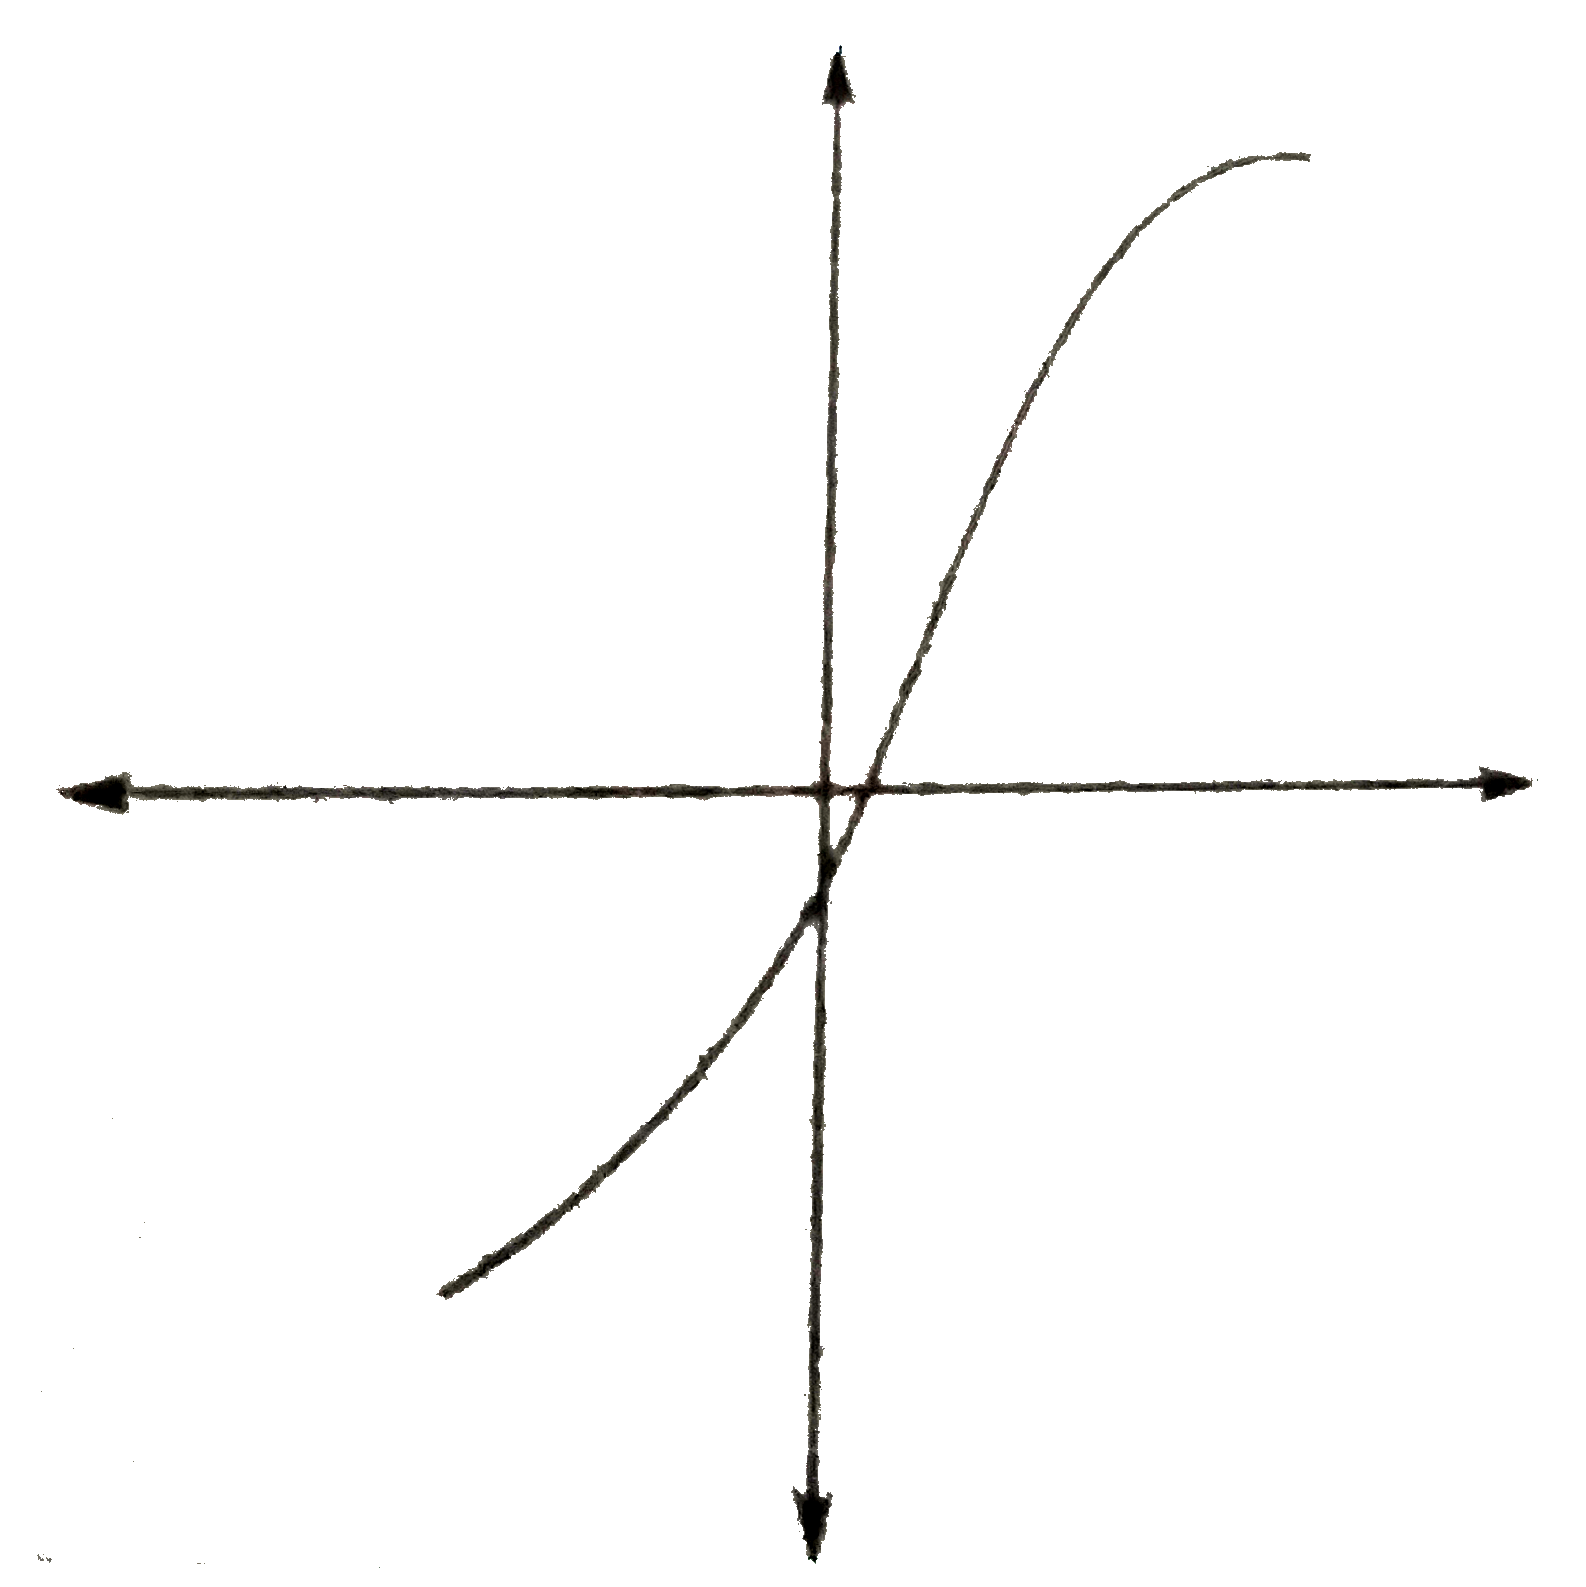
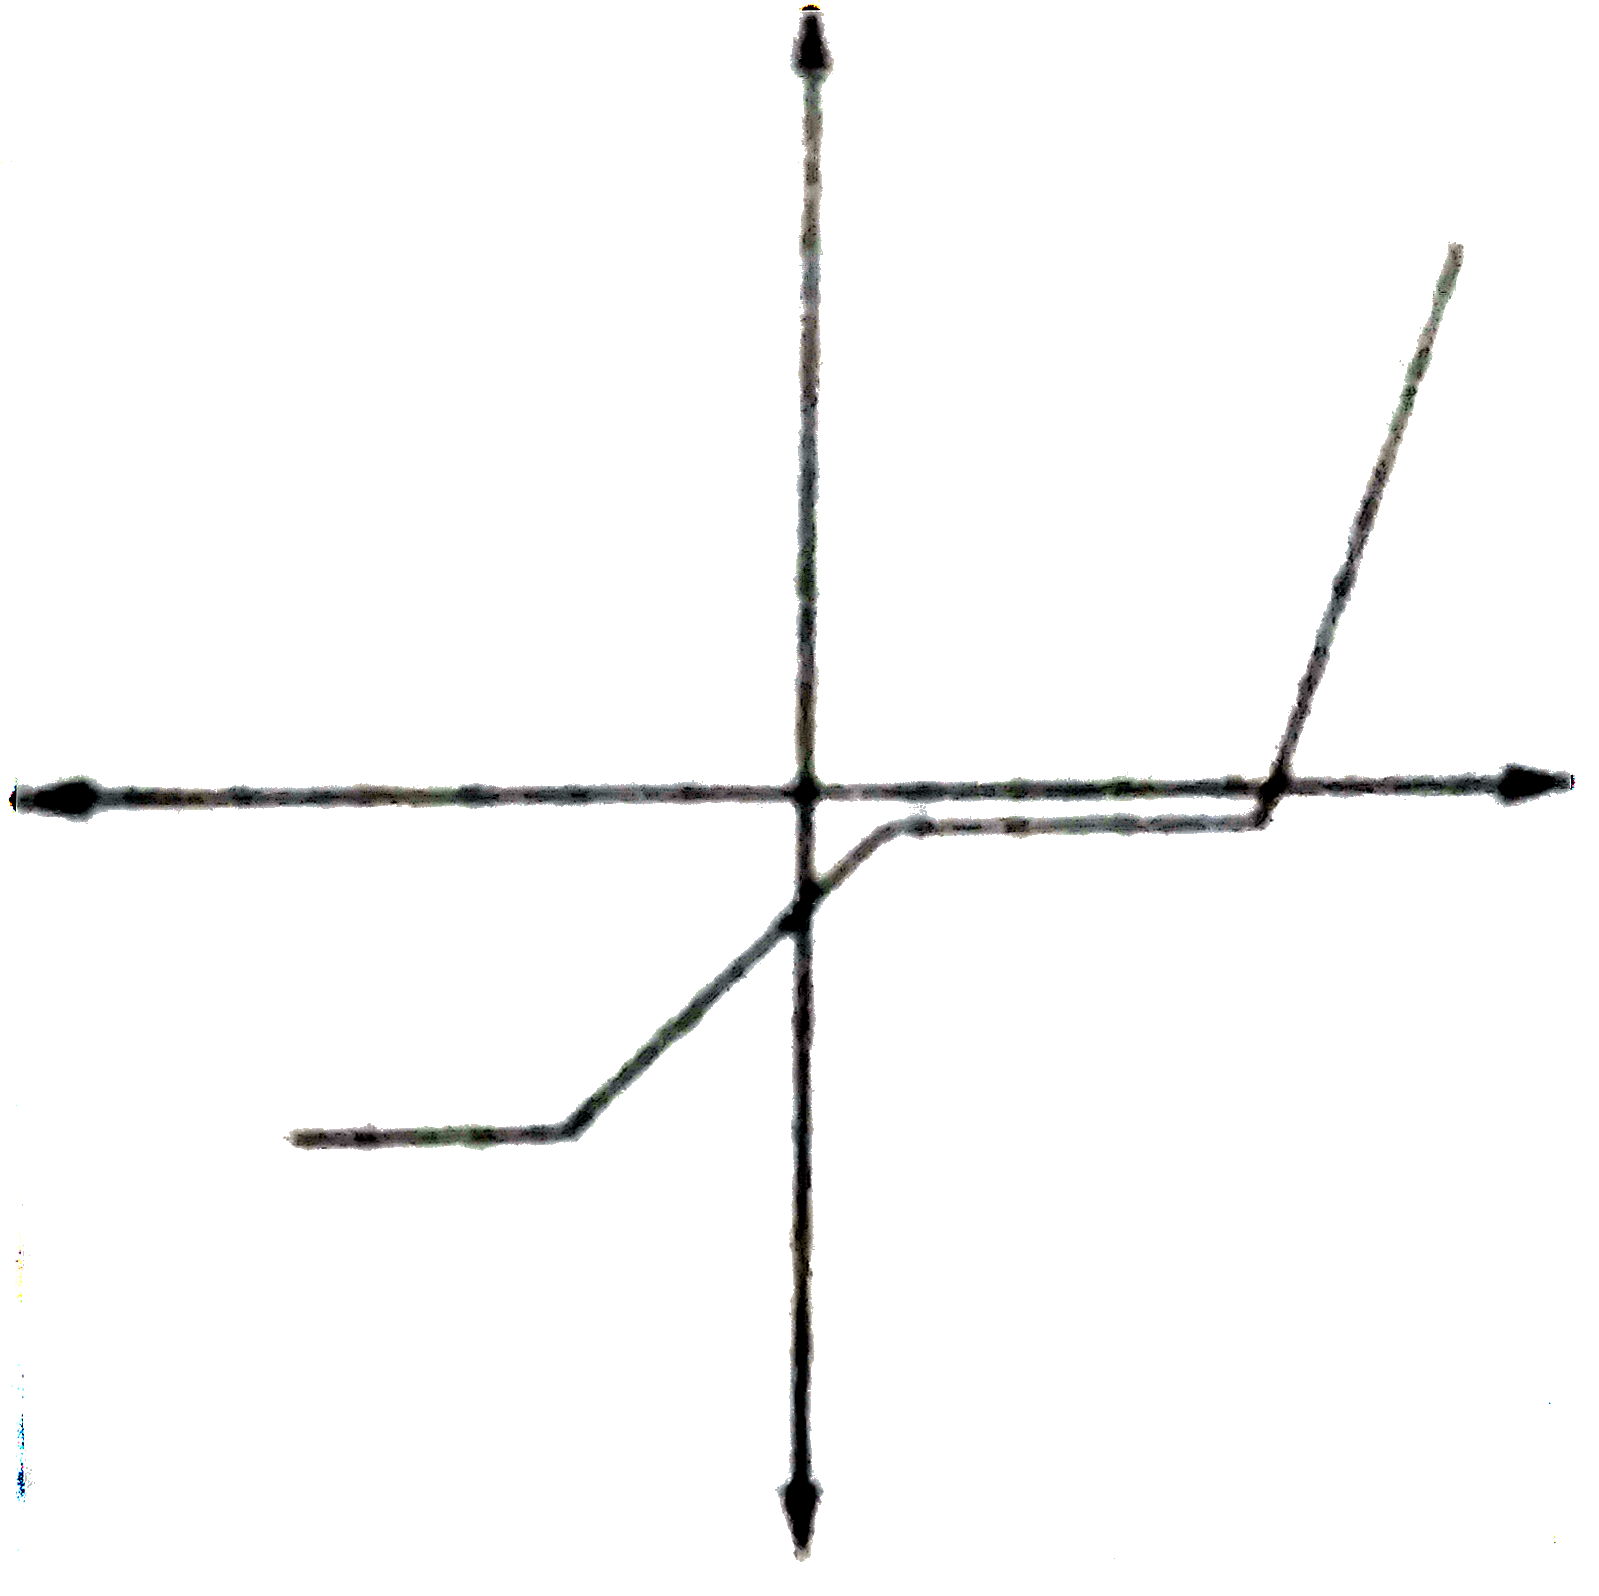
Which of the following graphs is NOT a function ?
A
B
C
D
Video Solution
Text Solution
The correct Answer is:B
In every function, there can be only one value in the range (only y value) for each value in the domain (each x value). In the graph shown in (B), there are two y values for each value of x (that is greater than -3).
|
Topper's Solved these Questions
Similar Questions
Knowledge Check
Which of the following graphs is the graph of function g(x)|x−1|−1?
A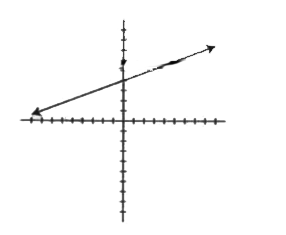 B
B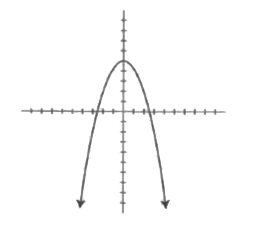 C
C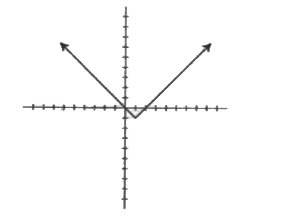 D
D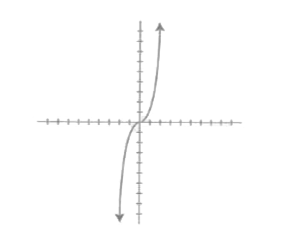
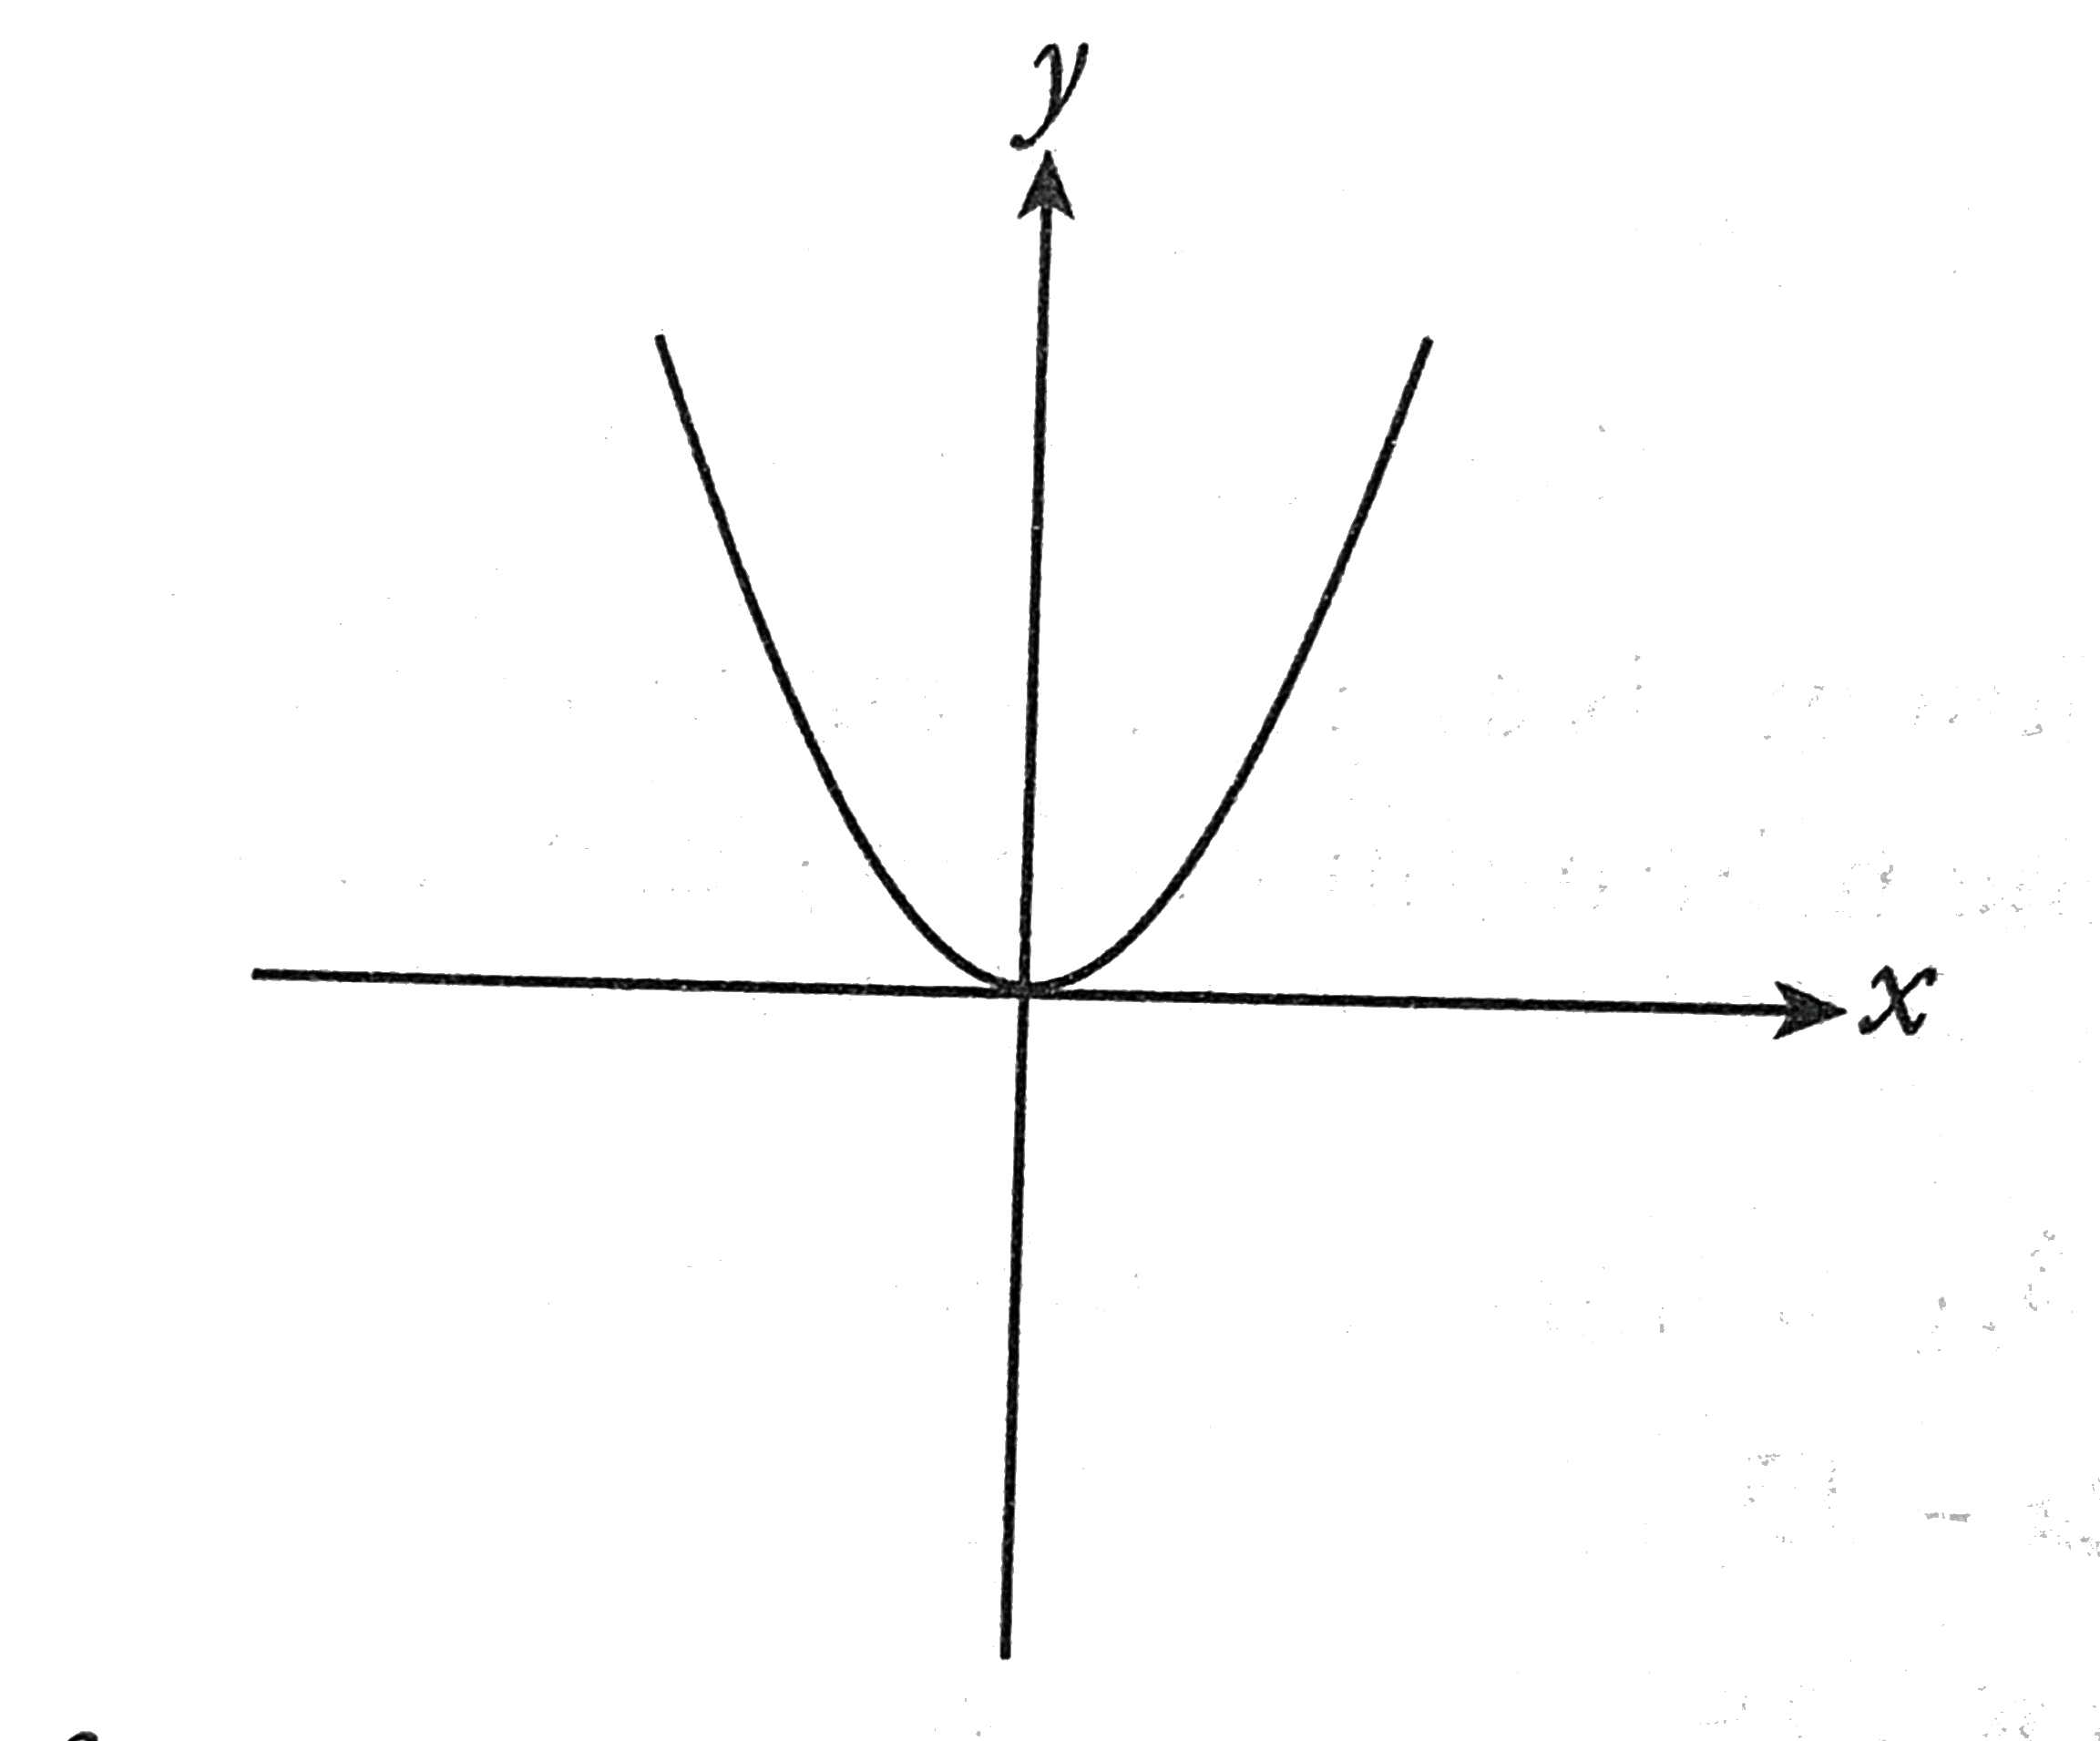
The quadratic y=f(x) is shown above. Which of the following graphs represents the function y=f(x+3)−4?A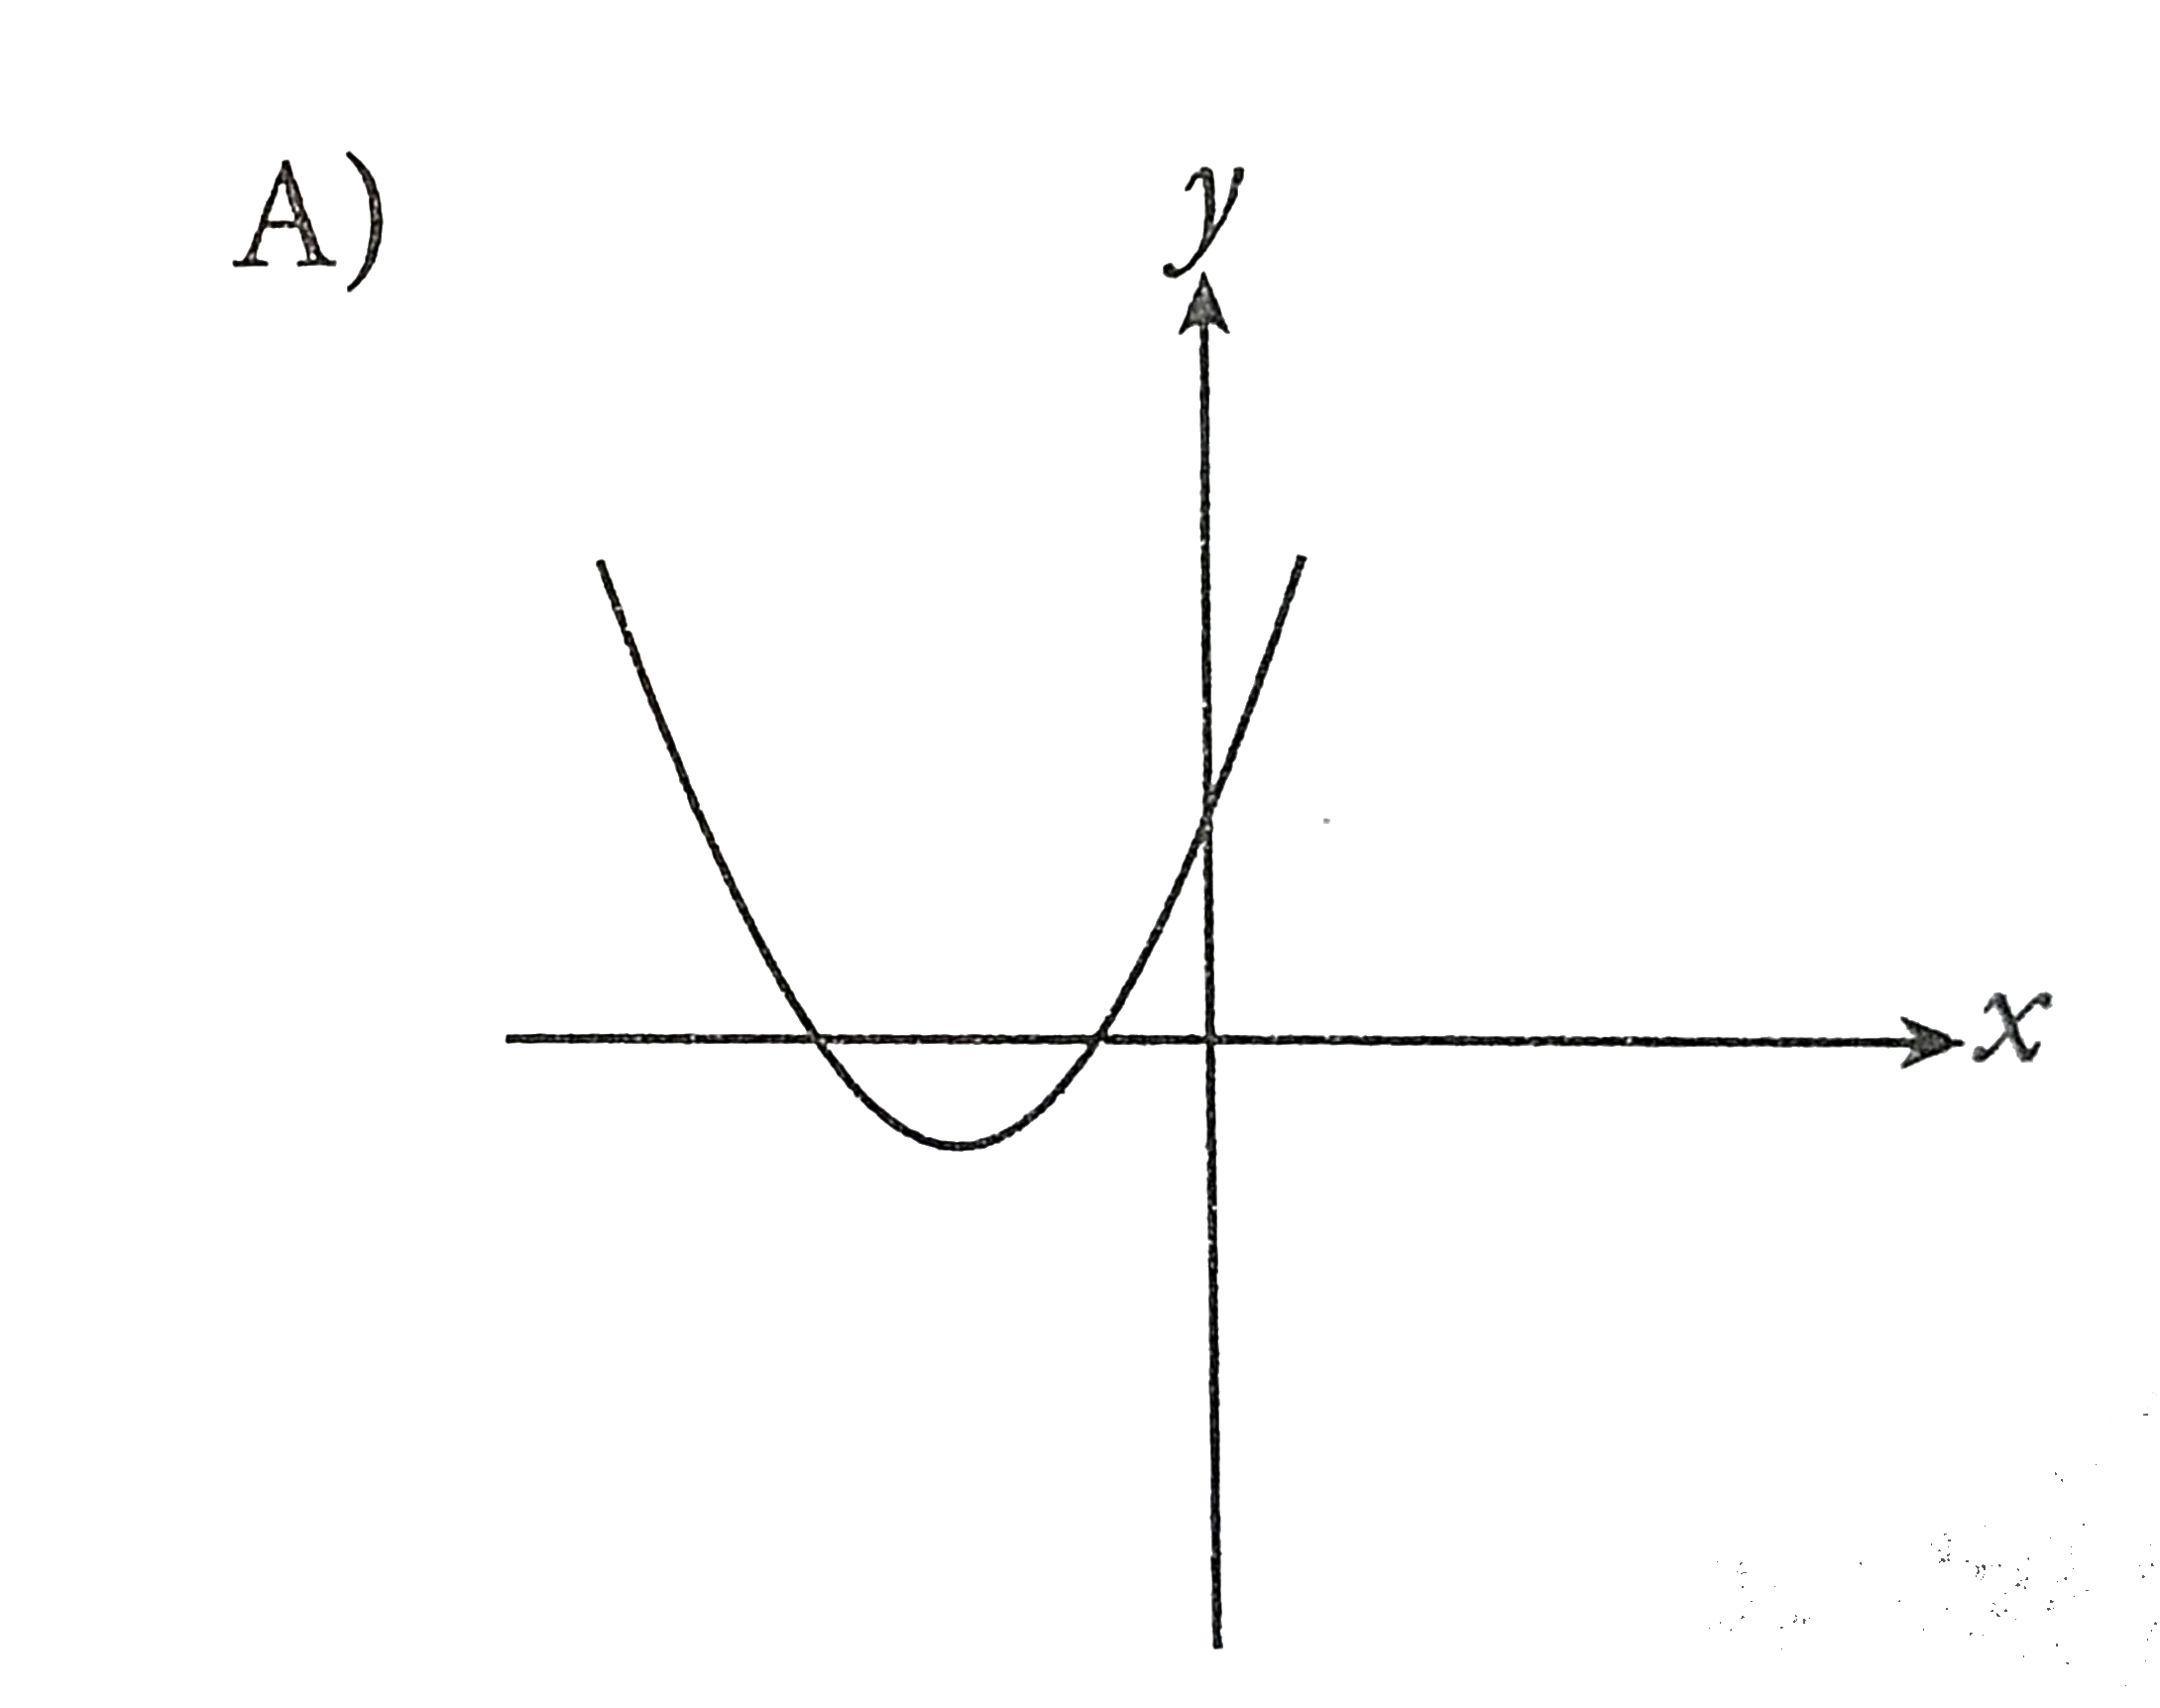 B
B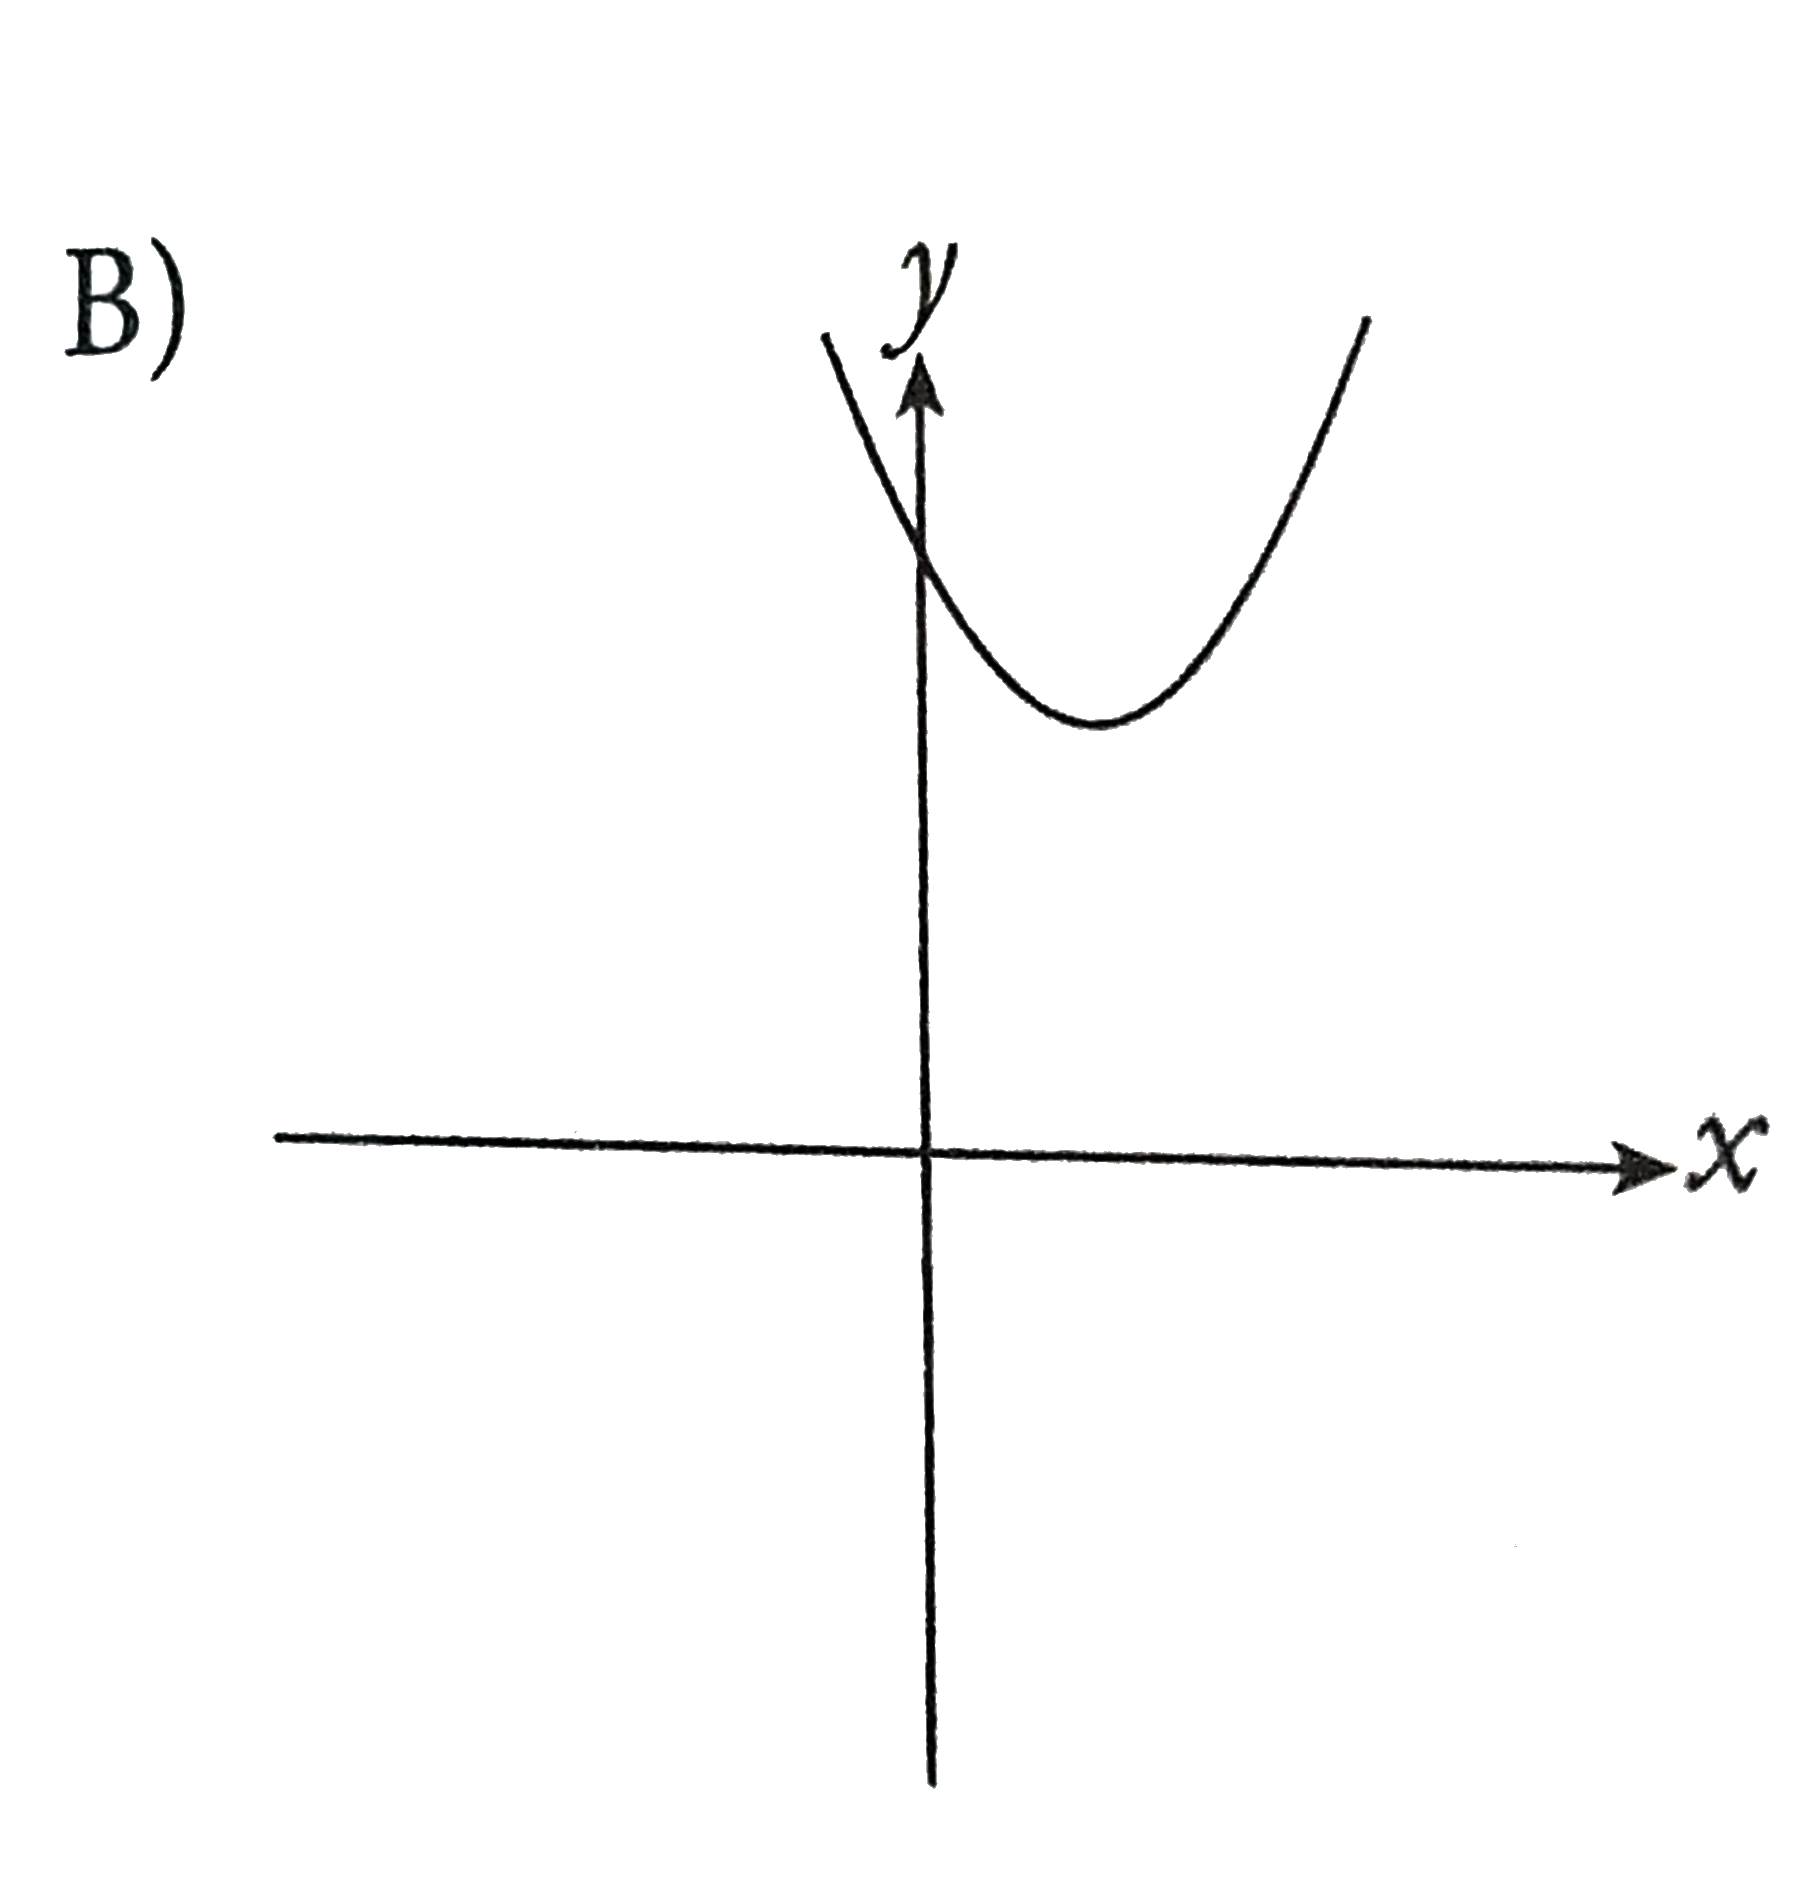 C
C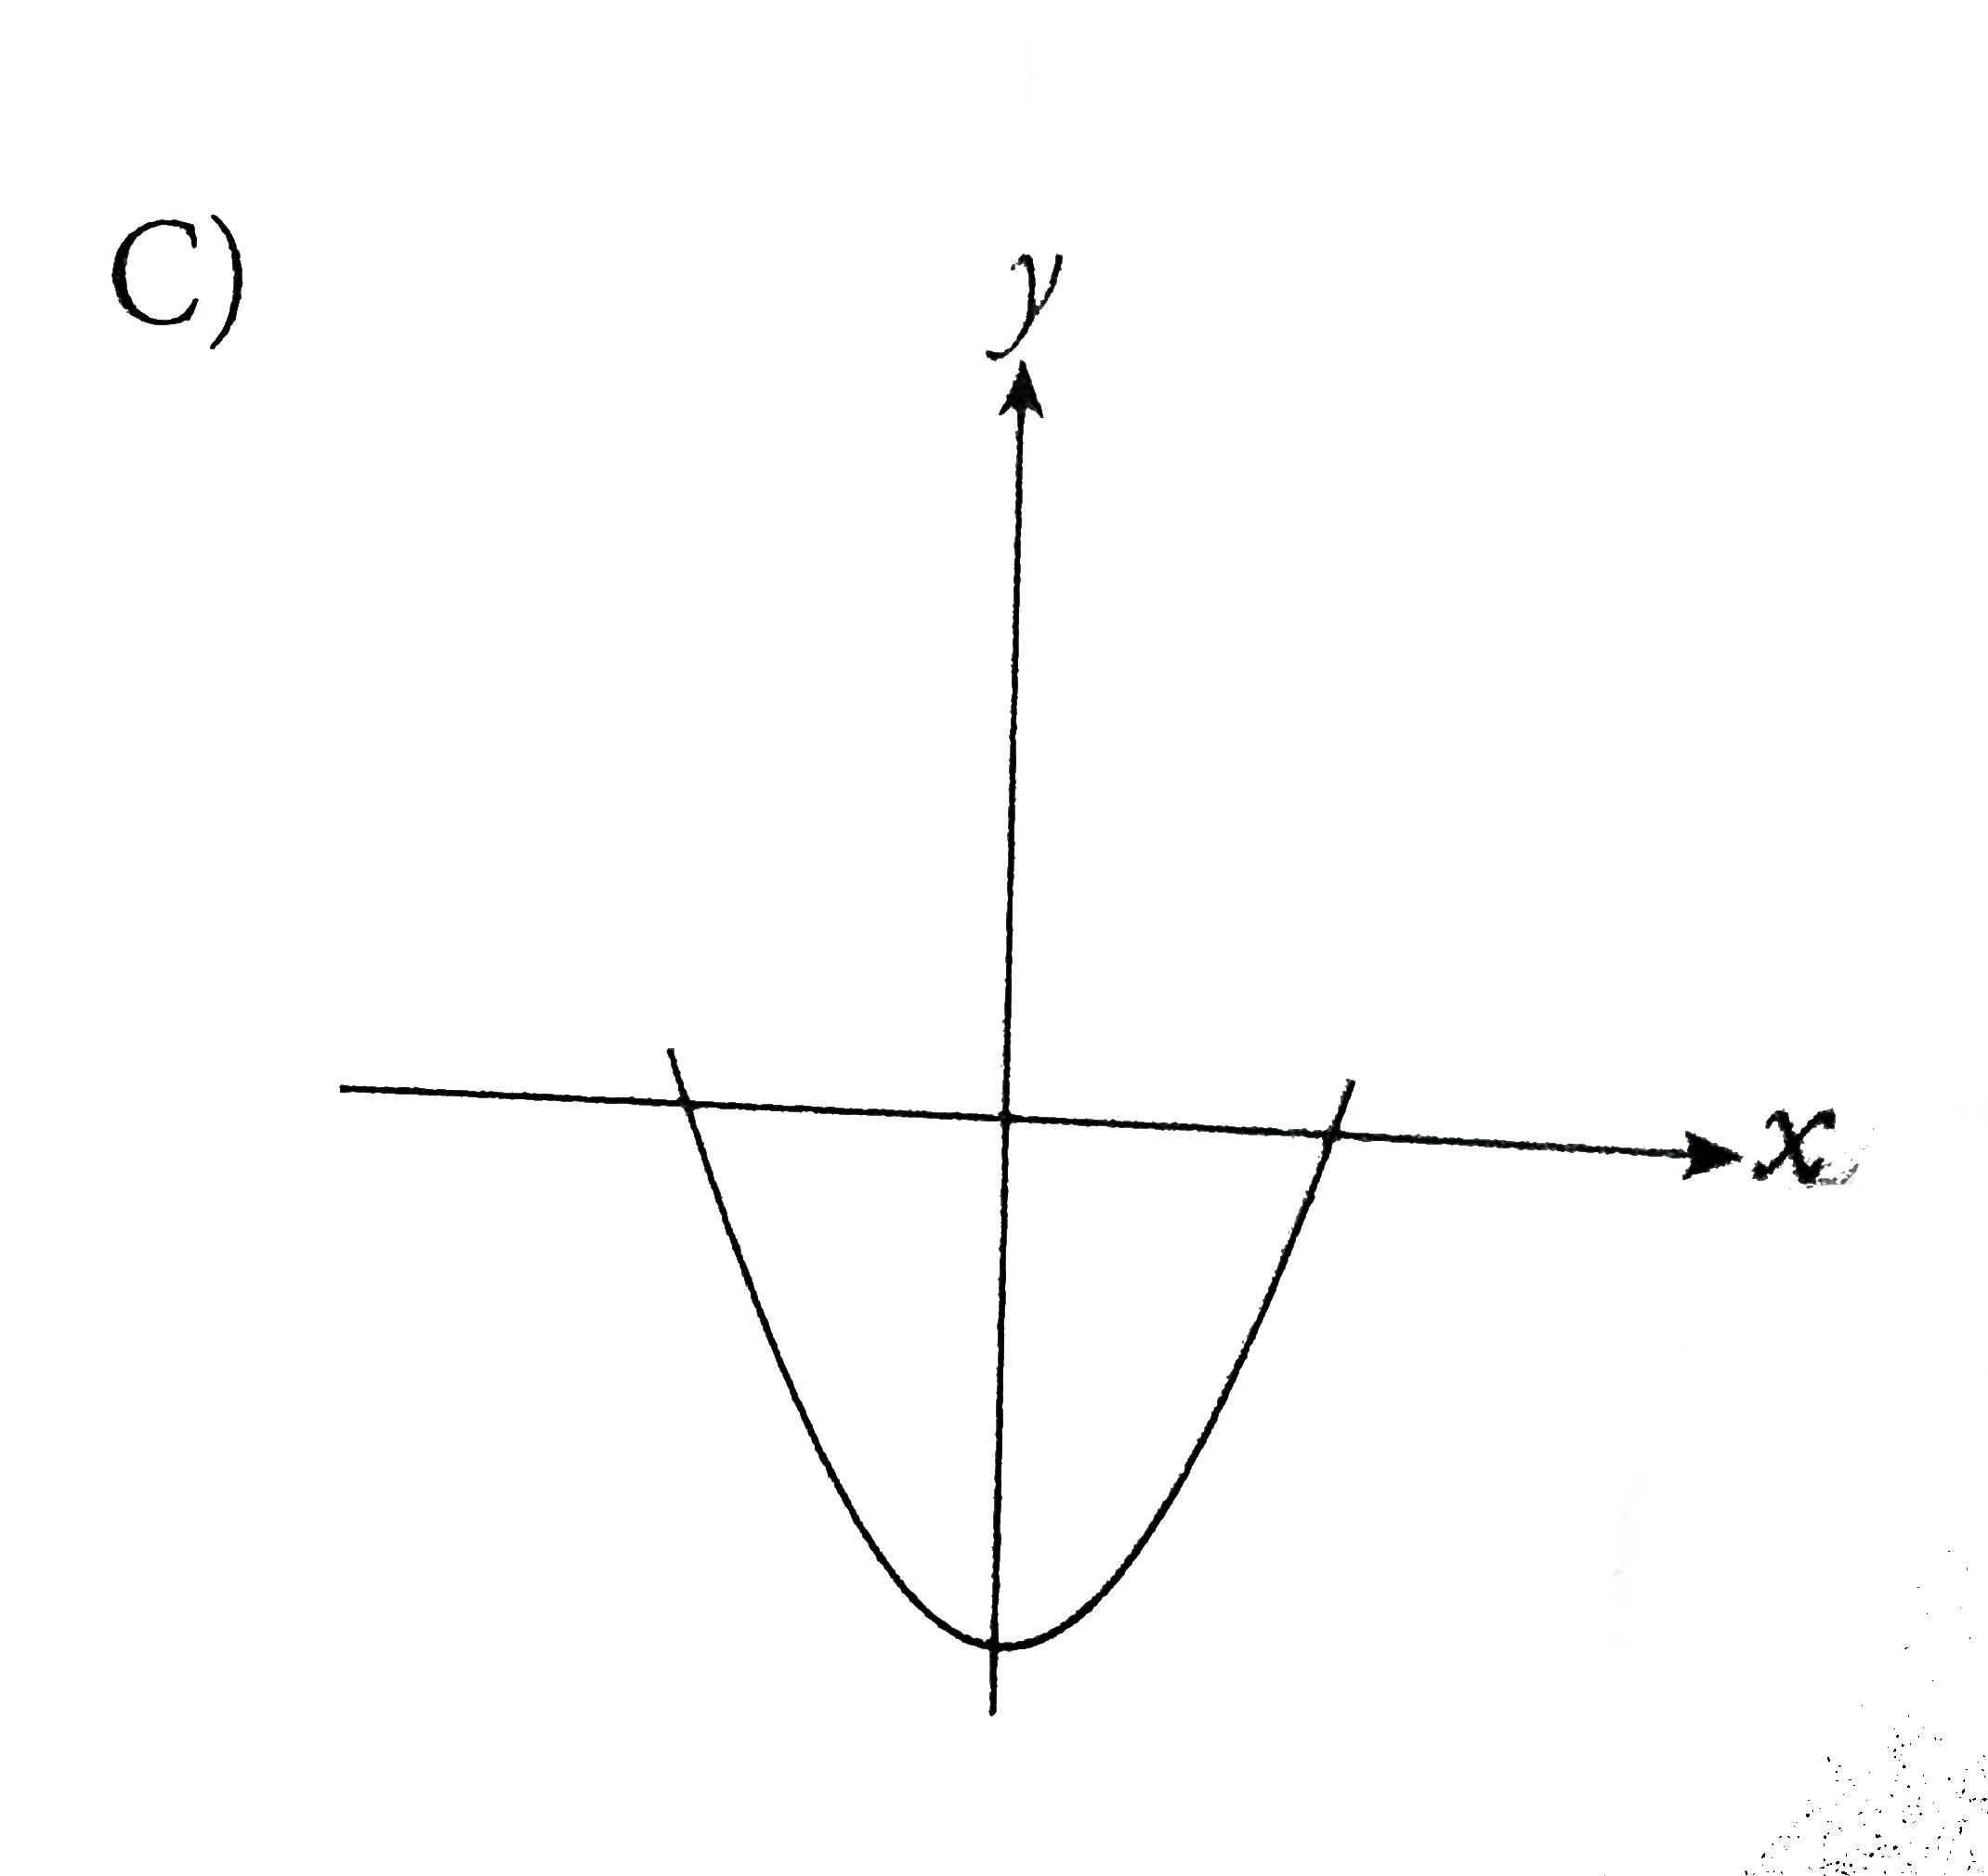 D
D
Which one of the following graphs represent a function? (FIGURE)
View SolutionWhich of the following graph represent the function f(x)=∫√x0eu2x du, for x>0andf(0)=o
View Solution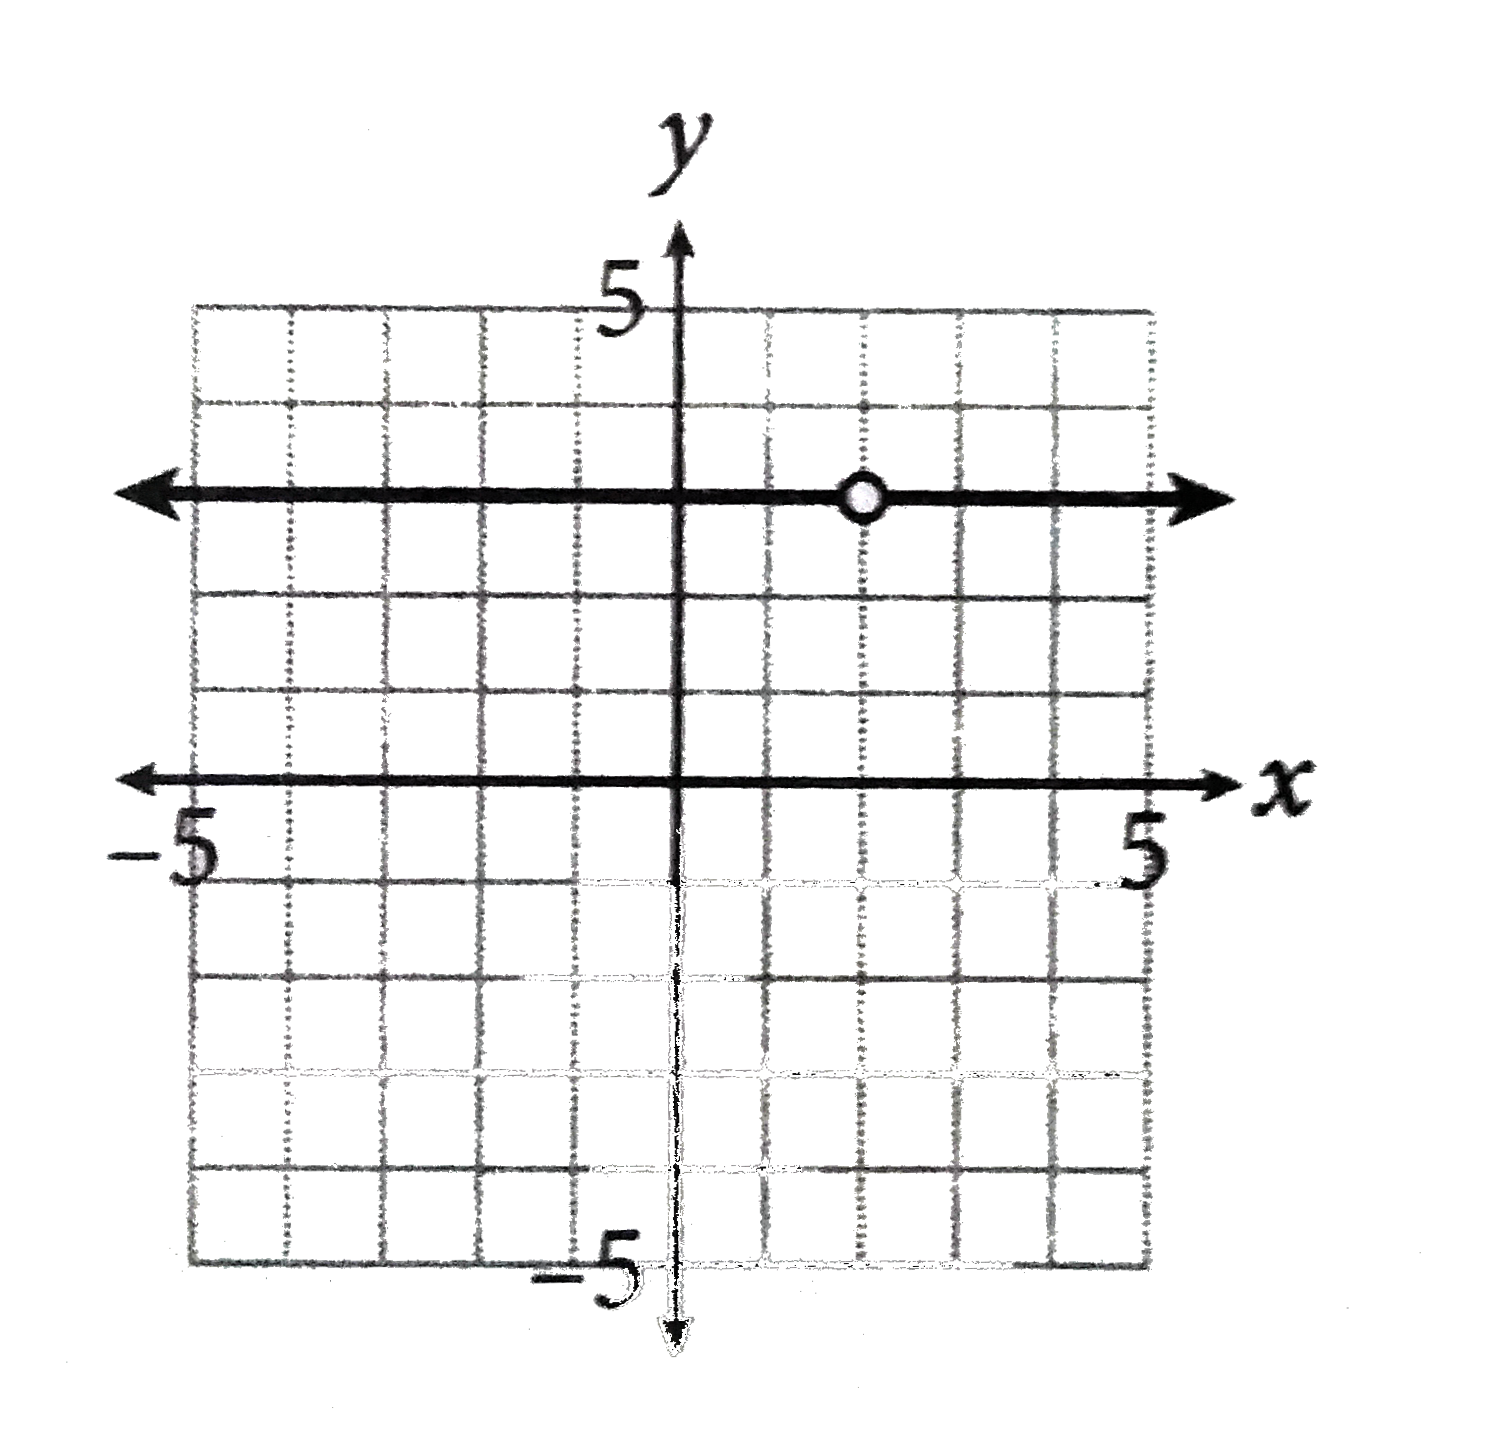
Which of the following rational functions could represent the graph shown?
View SolutionWhich of the following is a function whose graph is symmetrical about the origin ?
View SolutionWhich of the following is an example of a function whose graph in th exy-plane has no x-intercepts
View SolutionWhich of the following functions is an odd functions ?
View Solution

