For fixed amount of ideal gas In P (y-axis) us In B (x-axis) curve is plotted at constant T Select correct statements.
Slope of curve for any ideal gases would be same
Slope of curve for ideal gases would depend on amount of gas and temperaure
Intercept on y-axis for any ideal gases would be same
Intercept on y-axis for ideal gases would depend on amount of gas and temperature
The correct Answer is:A, D
Step by step video, text & image solution for For fixed amount of ideal gas In P (y-axis) us In B (x-axis) curve is plotted at constant T Select correct statements. by Chemistry experts to help you in doubts & scoring excellent marks in Class 12 exams.
Updated on:21/07/2023Topper's Solved these Questions
- GRAPHICAL INTERPRETATIONBOOK - GRB PUBLICATIONCHAPTER - GRAPHICAL INTERPRETATIONEXERCISE - Comprehension 1
1 Videos
- GRAPHICAL INTERPRETATIONBOOK - GRB PUBLICATIONCHAPTER - GRAPHICAL INTERPRETATIONEXERCISE - Comprehension
49 Videos
- GRAPHICAL INTERPRETATIONBOOK - GRB PUBLICATIONCHAPTER - GRAPHICAL INTERPRETATIONEXERCISE - Electrochemistry
9 Videos
- F-BLOCK ELEMENTSBOOK - GRB PUBLICATIONCHAPTER - F-BLOCK ELEMENTSEXERCISE - Subjective type
7 Videos
- HYDROCARBON (ALIPHATIC)BOOK - GRB PUBLICATIONCHAPTER - HYDROCARBON (ALIPHATIC)EXERCISE - Previous years jee questions
28 Videos
Similar Questions
Knowledge Check
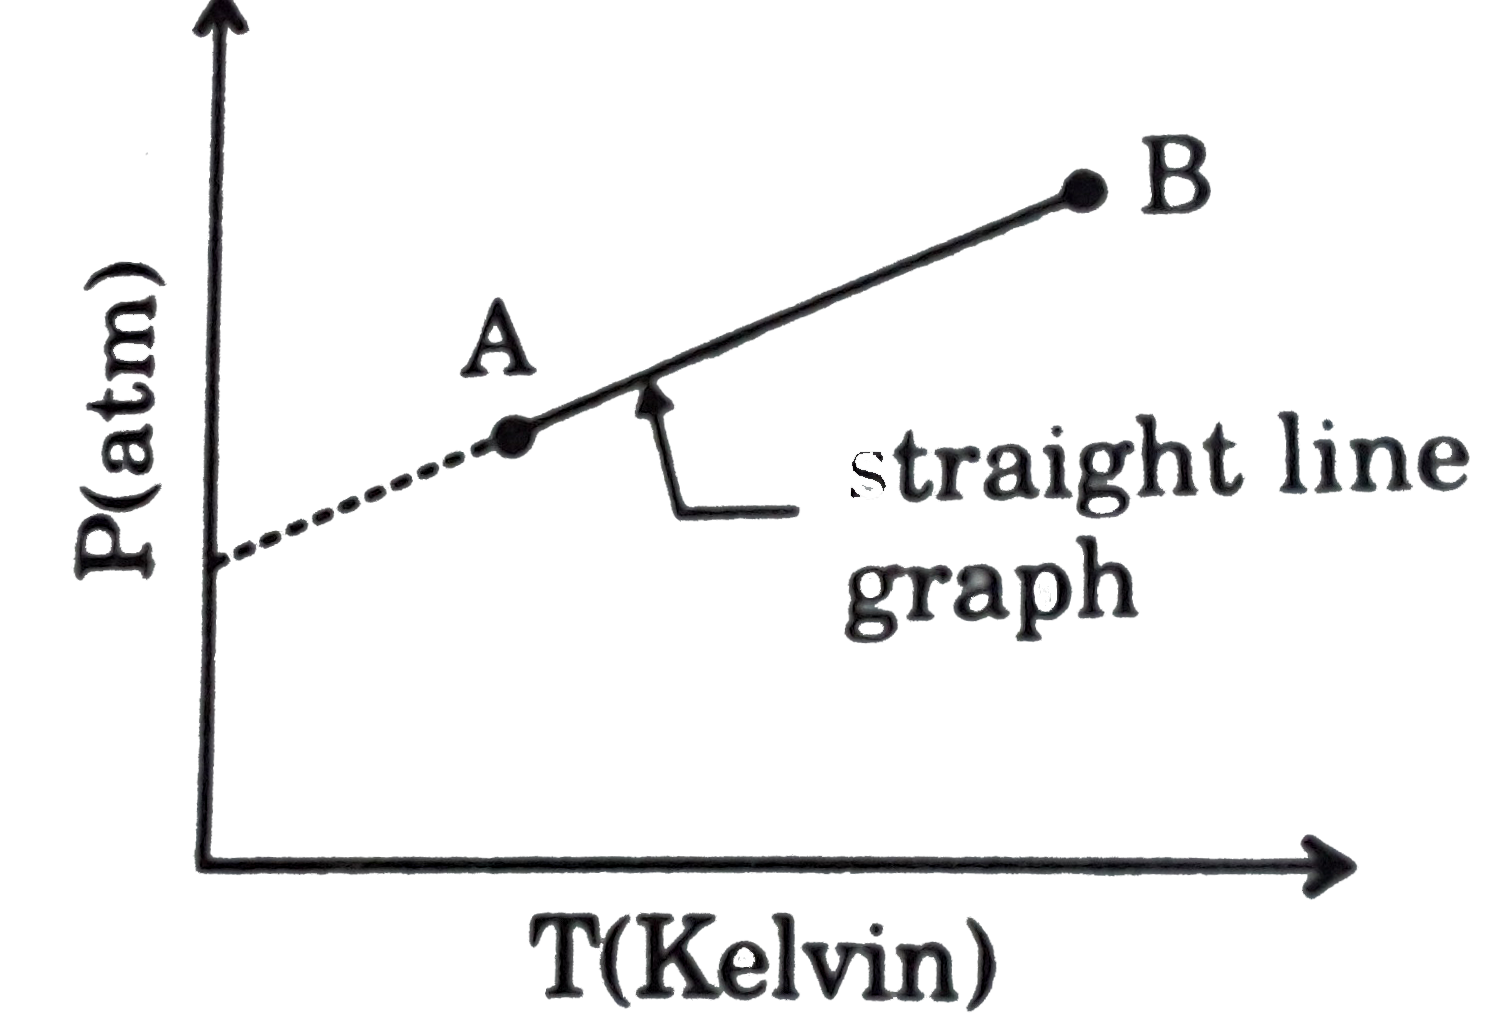
For a fixed amount of an ideal gas P us T plot is given as shown. Identify the correct option.
 AThe change from A to B should be isochoricBVolume first increases reached maxima and then decreasesCPV=nRT is not applicableDNone of the statements are correct
If normal the curve y=f(x) is parallel to X-axis, then correct statement is
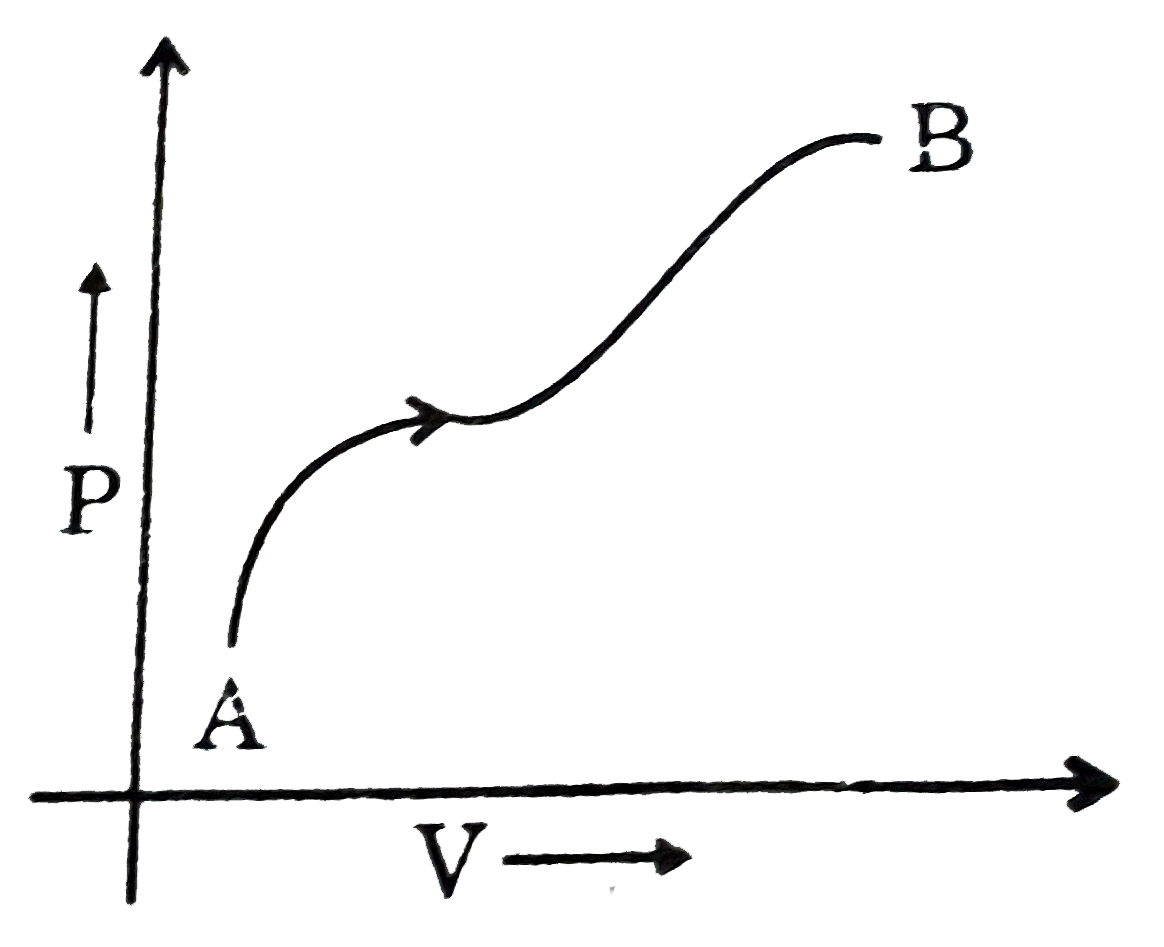
Adxdy=0Bdydx=0Cdydx=1Ddxdy≠0The graph given below shows the P-V plot for a process on an ideal gas. Select the correct statement.
 AEnthalpy content of the gas is constantly increasing and the process is carried out slowlyBEnthalpy content of the gas first increases then decreases and the process is quasistaticlyCEnthalpy content of the gas is constant and the process taken infinite amount of time for completionDEnthalpy content first decreases then increases and the process is reversible
When a sample of ideal gas is changed from an initial state to a final state, various curves can be plotted for the process like P-V curve, V-T curve,P-T curve etc.
For example, P-V curve for a fixed amount of an ideal gas at constant temperature is a rectangular hyperbola, V-T curve for a fixed amount of an ideal gas at constant volume is again a straight line. However, the shapes may vary if the constant parameters are also changed.
Now, answer the following questions :
Which of the following statements is correct regarding a fixed amount of ideal gas undergoing the following process :

View SolutionWhen a sample of ideal gas is changed from an initial state to a final state, various curves can be plotted for the process like P-V curve, V-T curve,P-T curve etc.
For example, P-V curve for a fixed amount of an ideal gas at constant temperature is a rectangular hyperbola, V-T curve for a fixed amount of an ideal gas at constant volume is again a straight line. However, the shapes may vary if the constant parameters are also changed.
Now, answer the following questions :
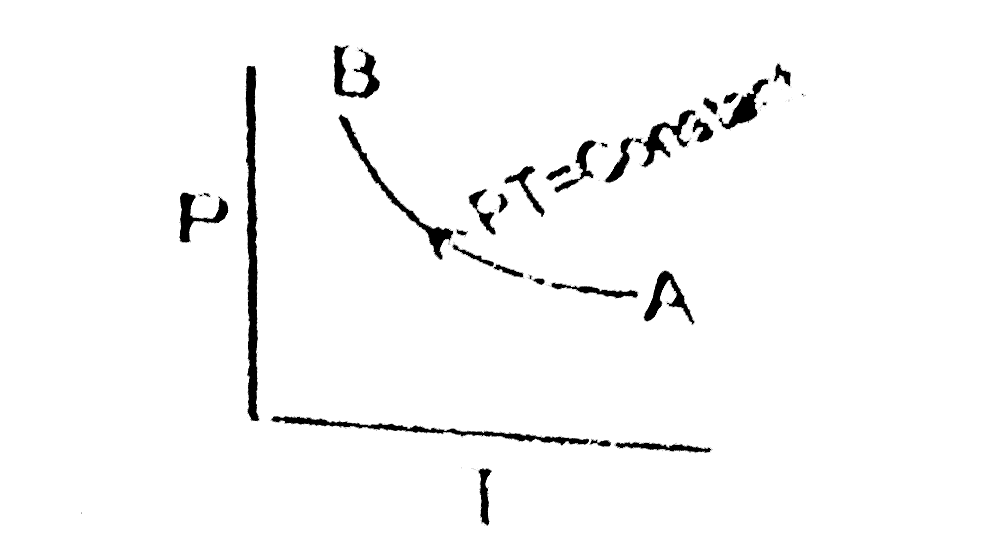
Which of the following graphs is not possible for a fixed amount of ideal gas upon moving from initial state A to final state B :
View SolutionWhen a sample of ideal gas is changed from an initial state to a final state, various curves can be plotted for the process like P-V curve, V-T curve,P-T curve etc.
For example, P-V curve for a fixed amount of an ideal gas at constant temperature is a rectangular hyperbola, V-T curve for a fixed amount of an ideal gas at constant volume is again a straight line. However, the shapes may vary if the constant parameters are also changed.
Now, answer the following questions :
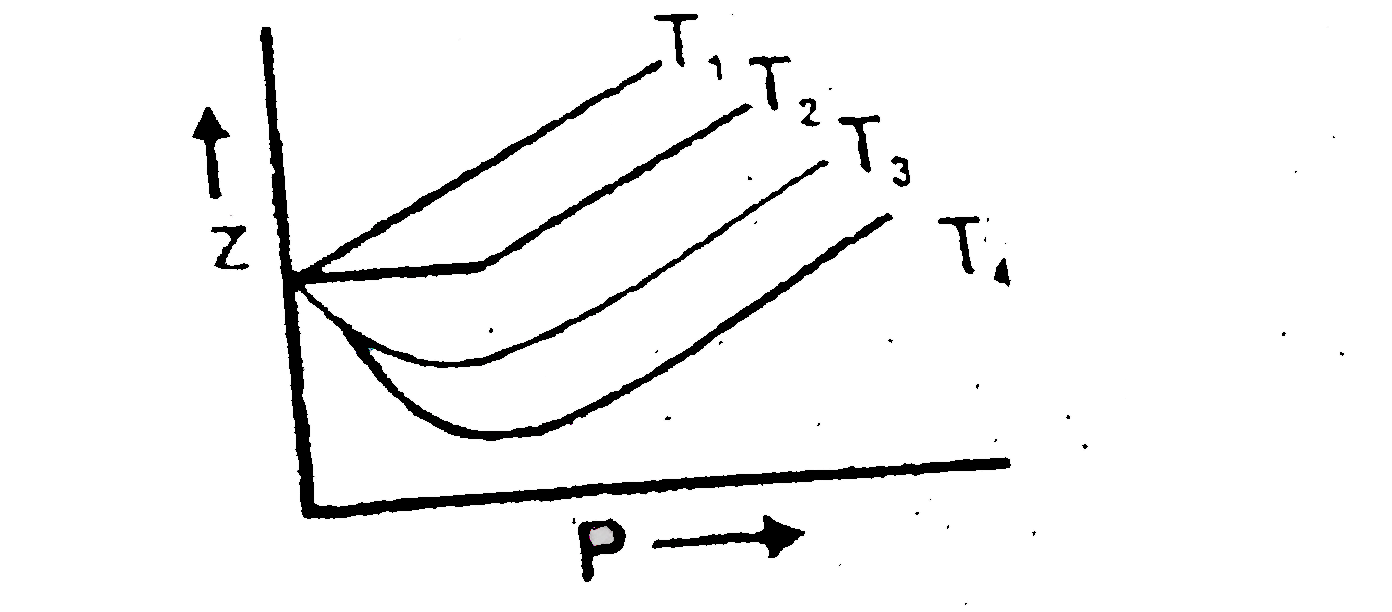
From the given plot between Z and P for a real gas the correct is :

View SolutionWhen a sample of ideal gas is changed from an initial state to a final state, various curves can be plotted for the process like P-V curve, V-T curve,P-T curve etc.
For example, P-V curve for a fixed amount of an ideal gas at constant temperature is a rectangular hyperbola, V-T curve for a fixed amount of an ideal gas at constant volume is again a straight line. However, the shapes may vary if the constant parameters are also changed.
Now, answer the following questions :
Two vander waals gases have same value of 'a' but different value of b which of the following statement is correct
View SolutionWhen a sample of ideal gas is changed from an initial state to a final state, various curves can be plotted for the process like P-V curve, V-T curve,P-T curve etc.
For example, P-V curve for a fixed amount of an ideal gas at constant temperature is a rectangular hyperbola, V-T curve for a fixed amount of an ideal gas at constant volume is again a straight line. However, the shapes may vary if the constant parameters are also changed.
Now, answer the following questions :
Two Vander waals gases have same value 'b' but different 'a' value then which of the following statement is correct under simialr condition .
View Solution
