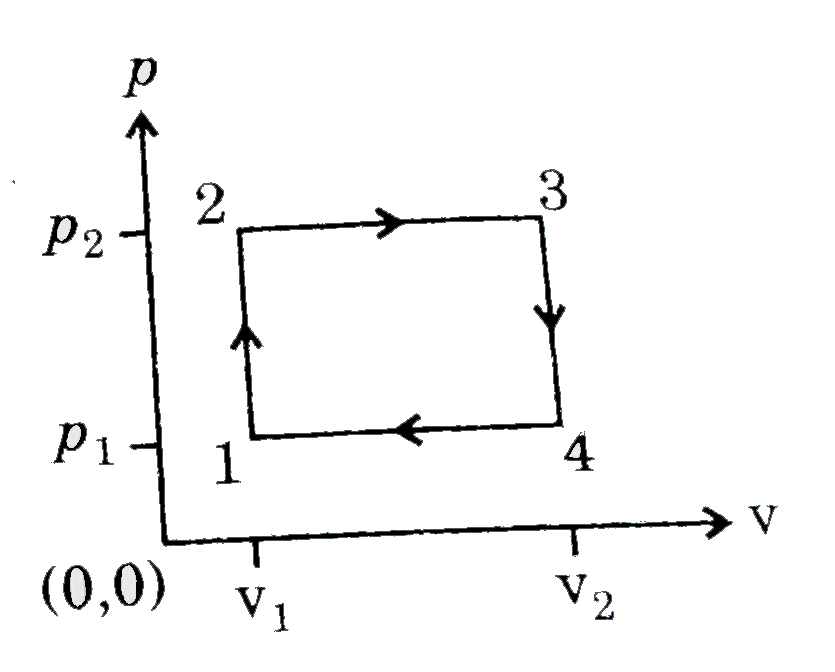
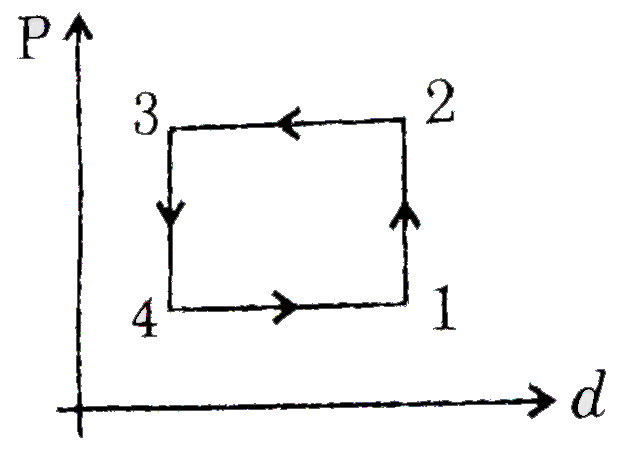
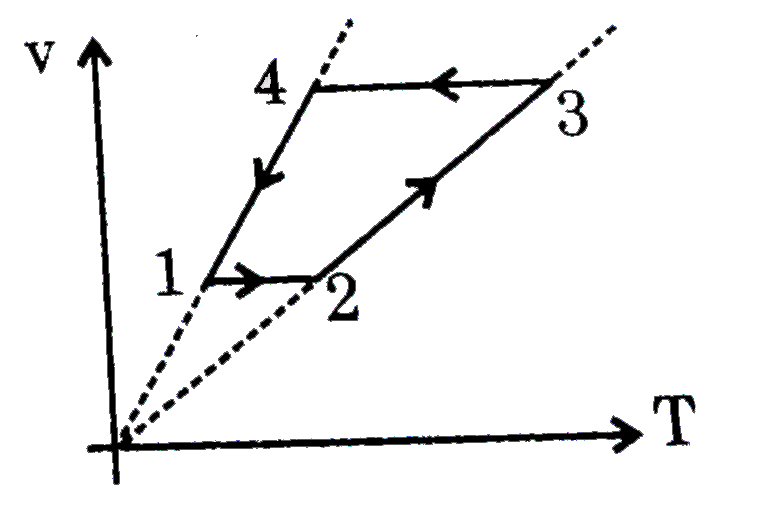
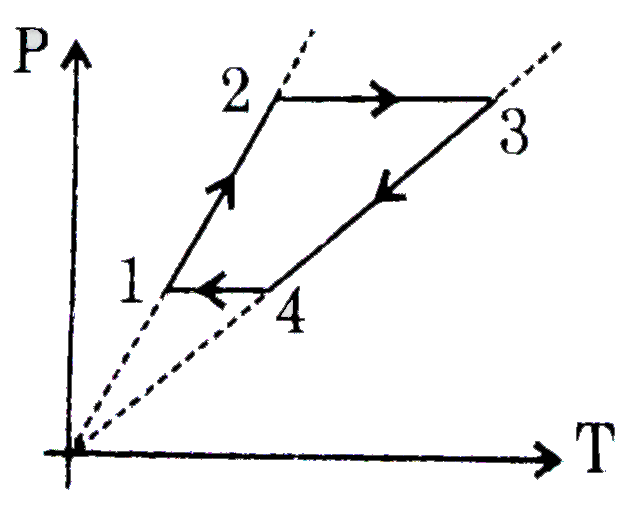
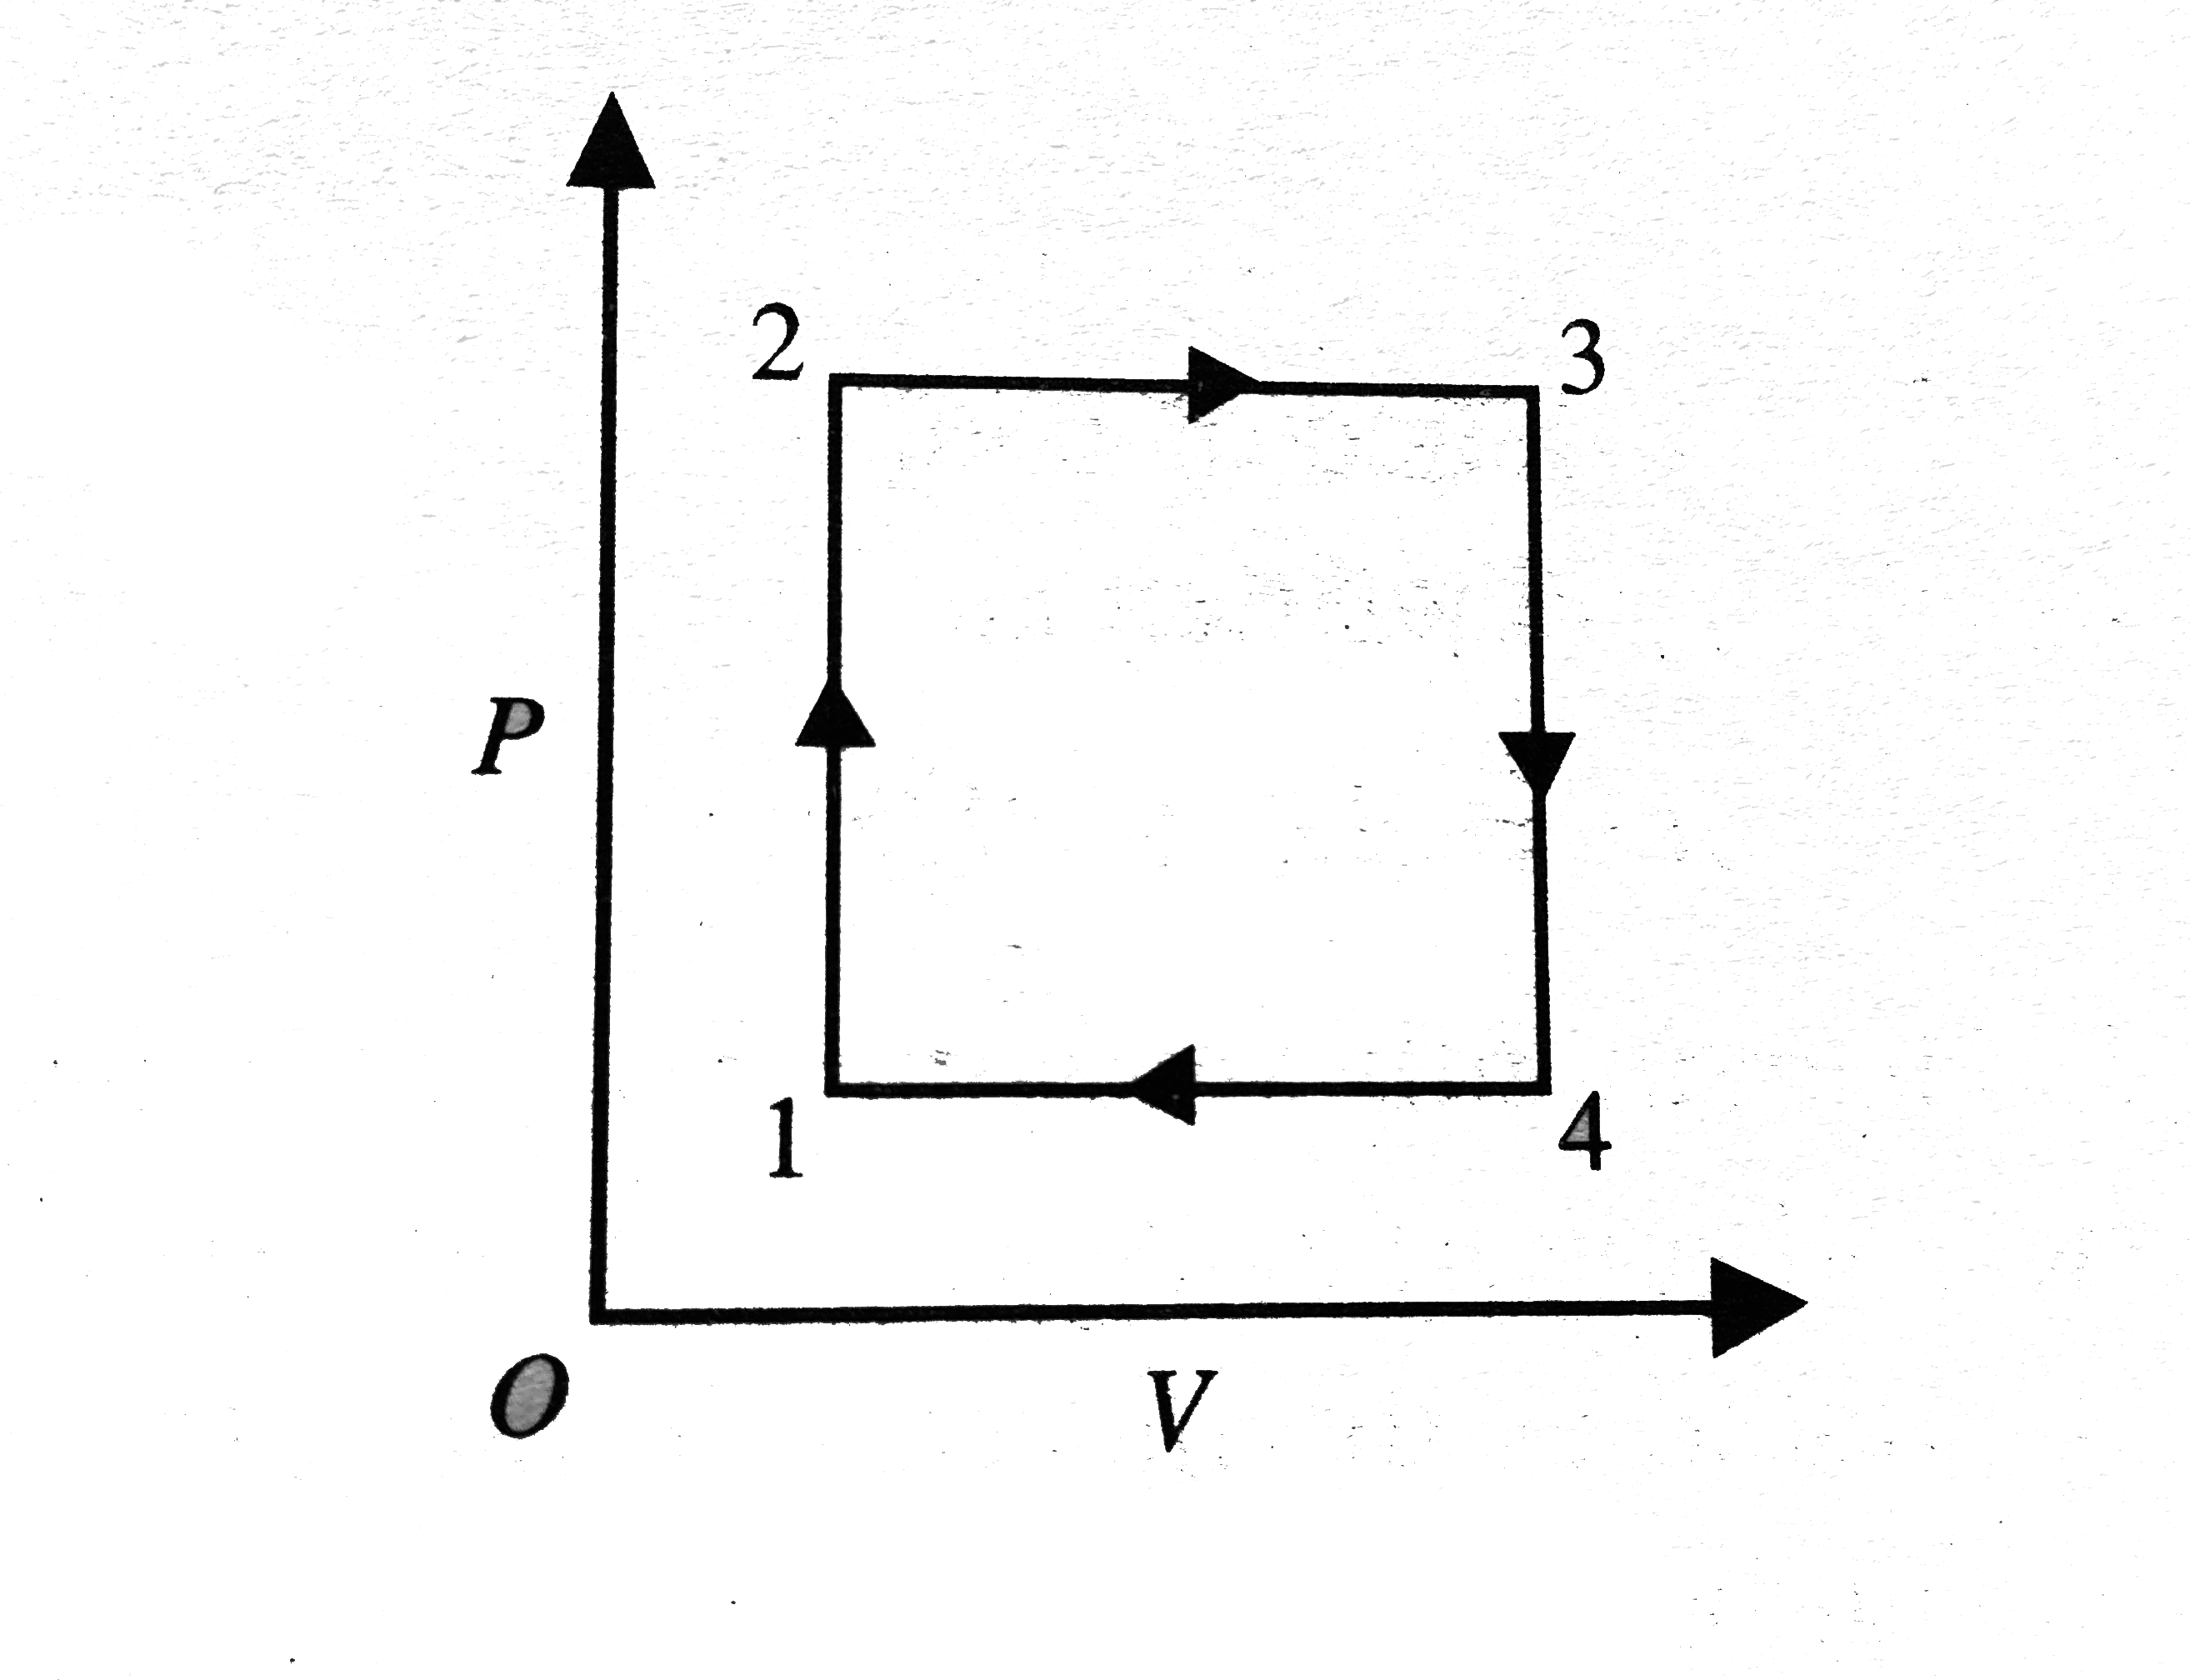
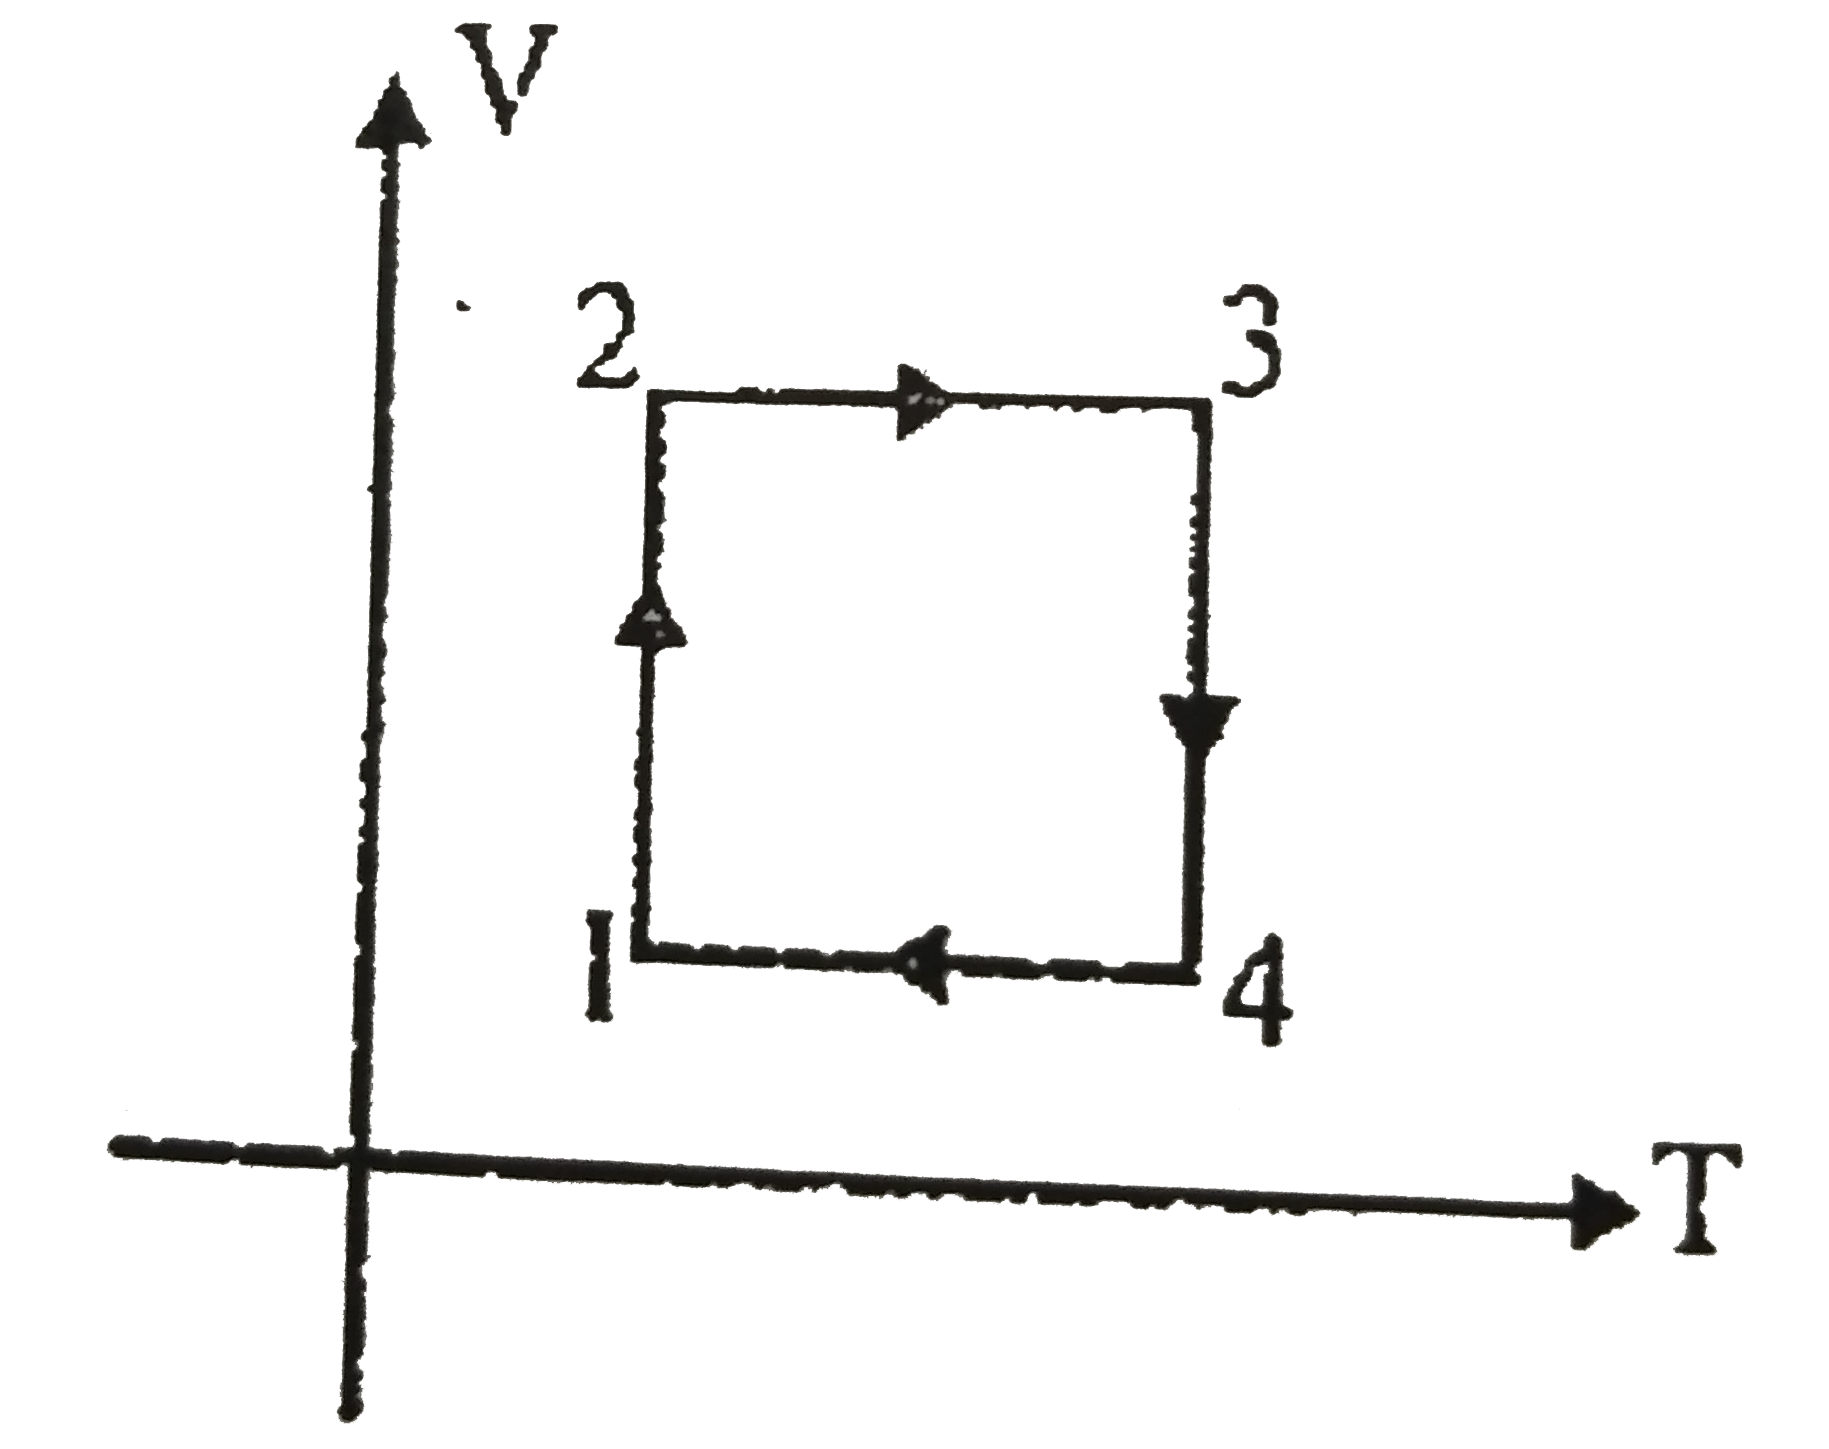
A gas has been subjected to an isochoric and isobaric cycle. Plot of the graph of this cycle in the pressure-density, V-T and P-T co-ordinates are given below. Choose the correct plots.
None of these
The correct Answer is:A, B, C
Step by step video, text & image solution for A gas has been subjected to an isochoric and isobaric cycle. Plot of the graph of this cycle in the pressure-density, V-T and P-T co-ordinates are given below. Choose the correct plots. by Chemistry experts to help you in doubts & scoring excellent marks in Class 12 exams.
Updated on:21/07/2023Topper's Solved these Questions
- GRAPHICAL INTERPRETATIONBook:GRB PUBLICATIONChapter:GRAPHICAL INTERPRETATIONExercise:Comprehension 1
Explore 1 Video
- GRAPHICAL INTERPRETATIONBook:GRB PUBLICATIONChapter:GRAPHICAL INTERPRETATIONExercise:Comprehension
Explore 49 Videos
- GRAPHICAL INTERPRETATIONBook:GRB PUBLICATIONChapter:GRAPHICAL INTERPRETATIONExercise:Electrochemistry
Explore 9 Videos
- F-BLOCK ELEMENTSBook:GRB PUBLICATIONChapter:F-BLOCK ELEMENTSExercise:Subjective type
Explore 7 Videos
- HYDROCARBON (ALIPHATIC)Book:GRB PUBLICATIONChapter:HYDROCARBON (ALIPHATIC)Exercise:Previous years jee questions
Explore 28 Videos
Similar Questions
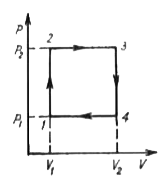
A gas has been subjected to an isochoric-isobaric cycle 1-2-3-4-1 (Fig.). Plot the graph of this cycle in the p−ρ,V−T and p-T coordinates.
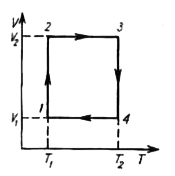
View SolutionA gas has been subjected to isothermal-isochoric cycle 1-2-3-4-1 (Fig.). Plot the graph of this cycle in p−V,p−ρ, and p-T coordinates.
View Solution
Knowledge Check
V-T diagram for n mol monoatomic gas is given below
_PHY_E01_011_Q01.png)
Choose the correct statement"A∣∣∣ΔQ1→2ΔQ3→4∣∣∣=12B∣∣∣ΔQ1→2ΔQ2→3∣∣∣=53CWork done in cyclic process is ΔW=nRT02DThere are only adiabatic and isochoric processes are involvedOn the P−T graph of an ideal gas, choose the correct option(s):
AAdiabatic process will be a straight line.BIsochoric process will be straight line passing through the origin.Cadiabatic curve will have a positive slope.Dthe slope of adiabatic curve is proportional T.V vs T curves at constant pressure P1 and P2 for an ideal gas are shown below
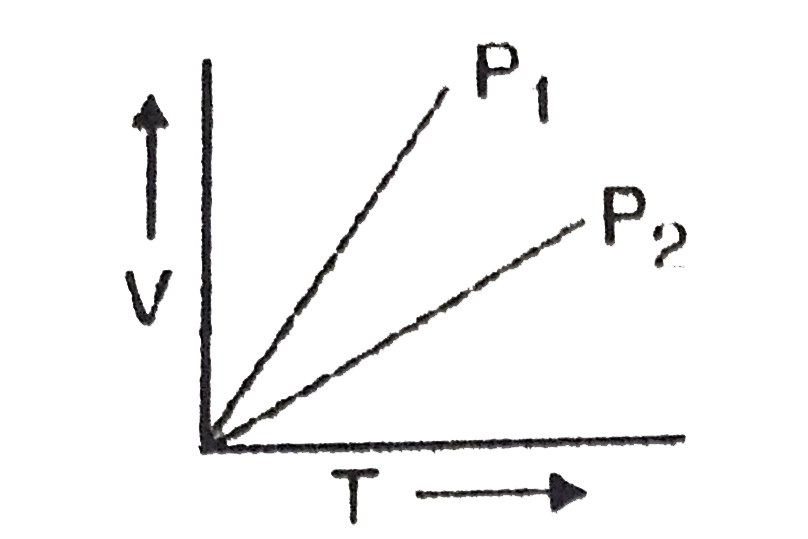
Which is correct ?AP1>P2BP1<P2CP1=P2DAll of the above
A gas has been subjected to an isothermal-isochromic cycle 1-2-3-4-1 see Fig. Represent the same cycle on P - V and P - T diagrams.
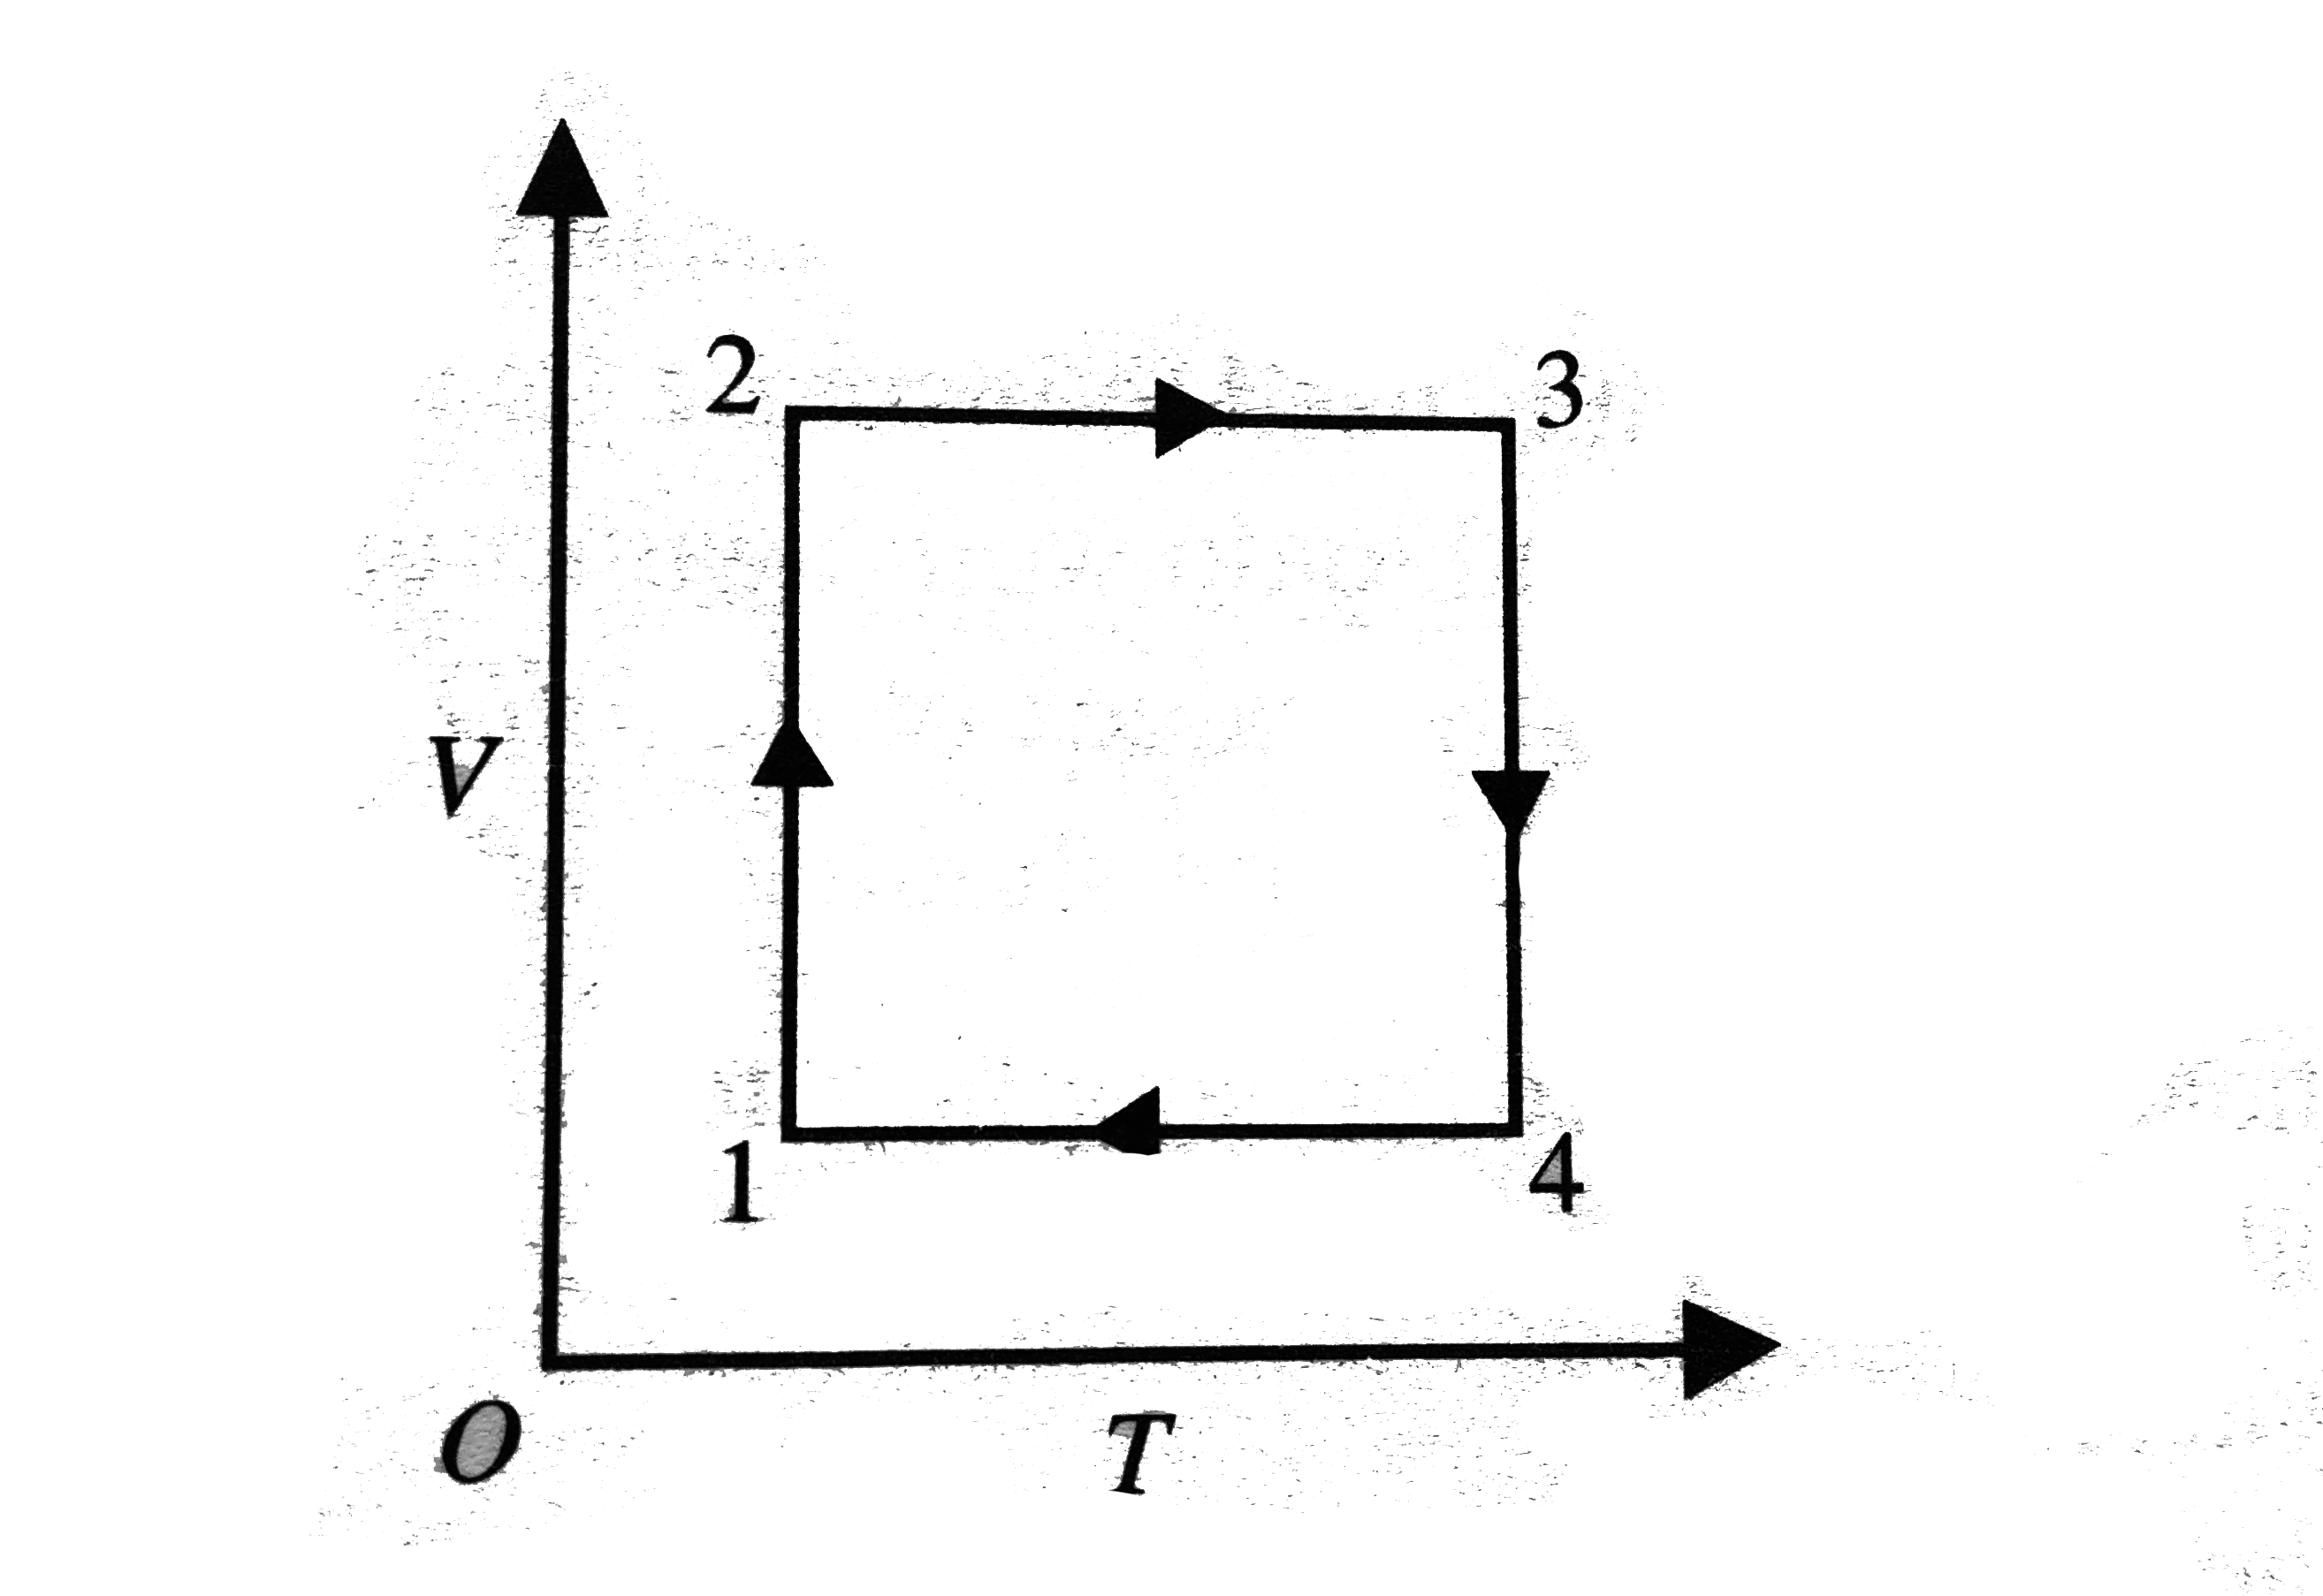
View SolutionA gas has been subjected to isochoric-isobaric processes 1-2-3-4-1 see Fig. Plot this process on T - V and P - T diagrams.
View SolutionA gas has been subjected to a cycle of isochoric, isothermal process 1-2-3-4-1 as shown in the figure. The graph for this cycle on P-T diagram is
View Solution10 moles of an ideal gas is subjected to an isochoric process (volume constant) and a graph of log P us log T is plotted where P is in 'atm' and is in 'Kelvin'. If volume of the container is 82.1 ml then calculate sum of a,b and c.
Where : a = slope of the graph
b = x intercept of the graph
c = y intercept of the graph
View Solution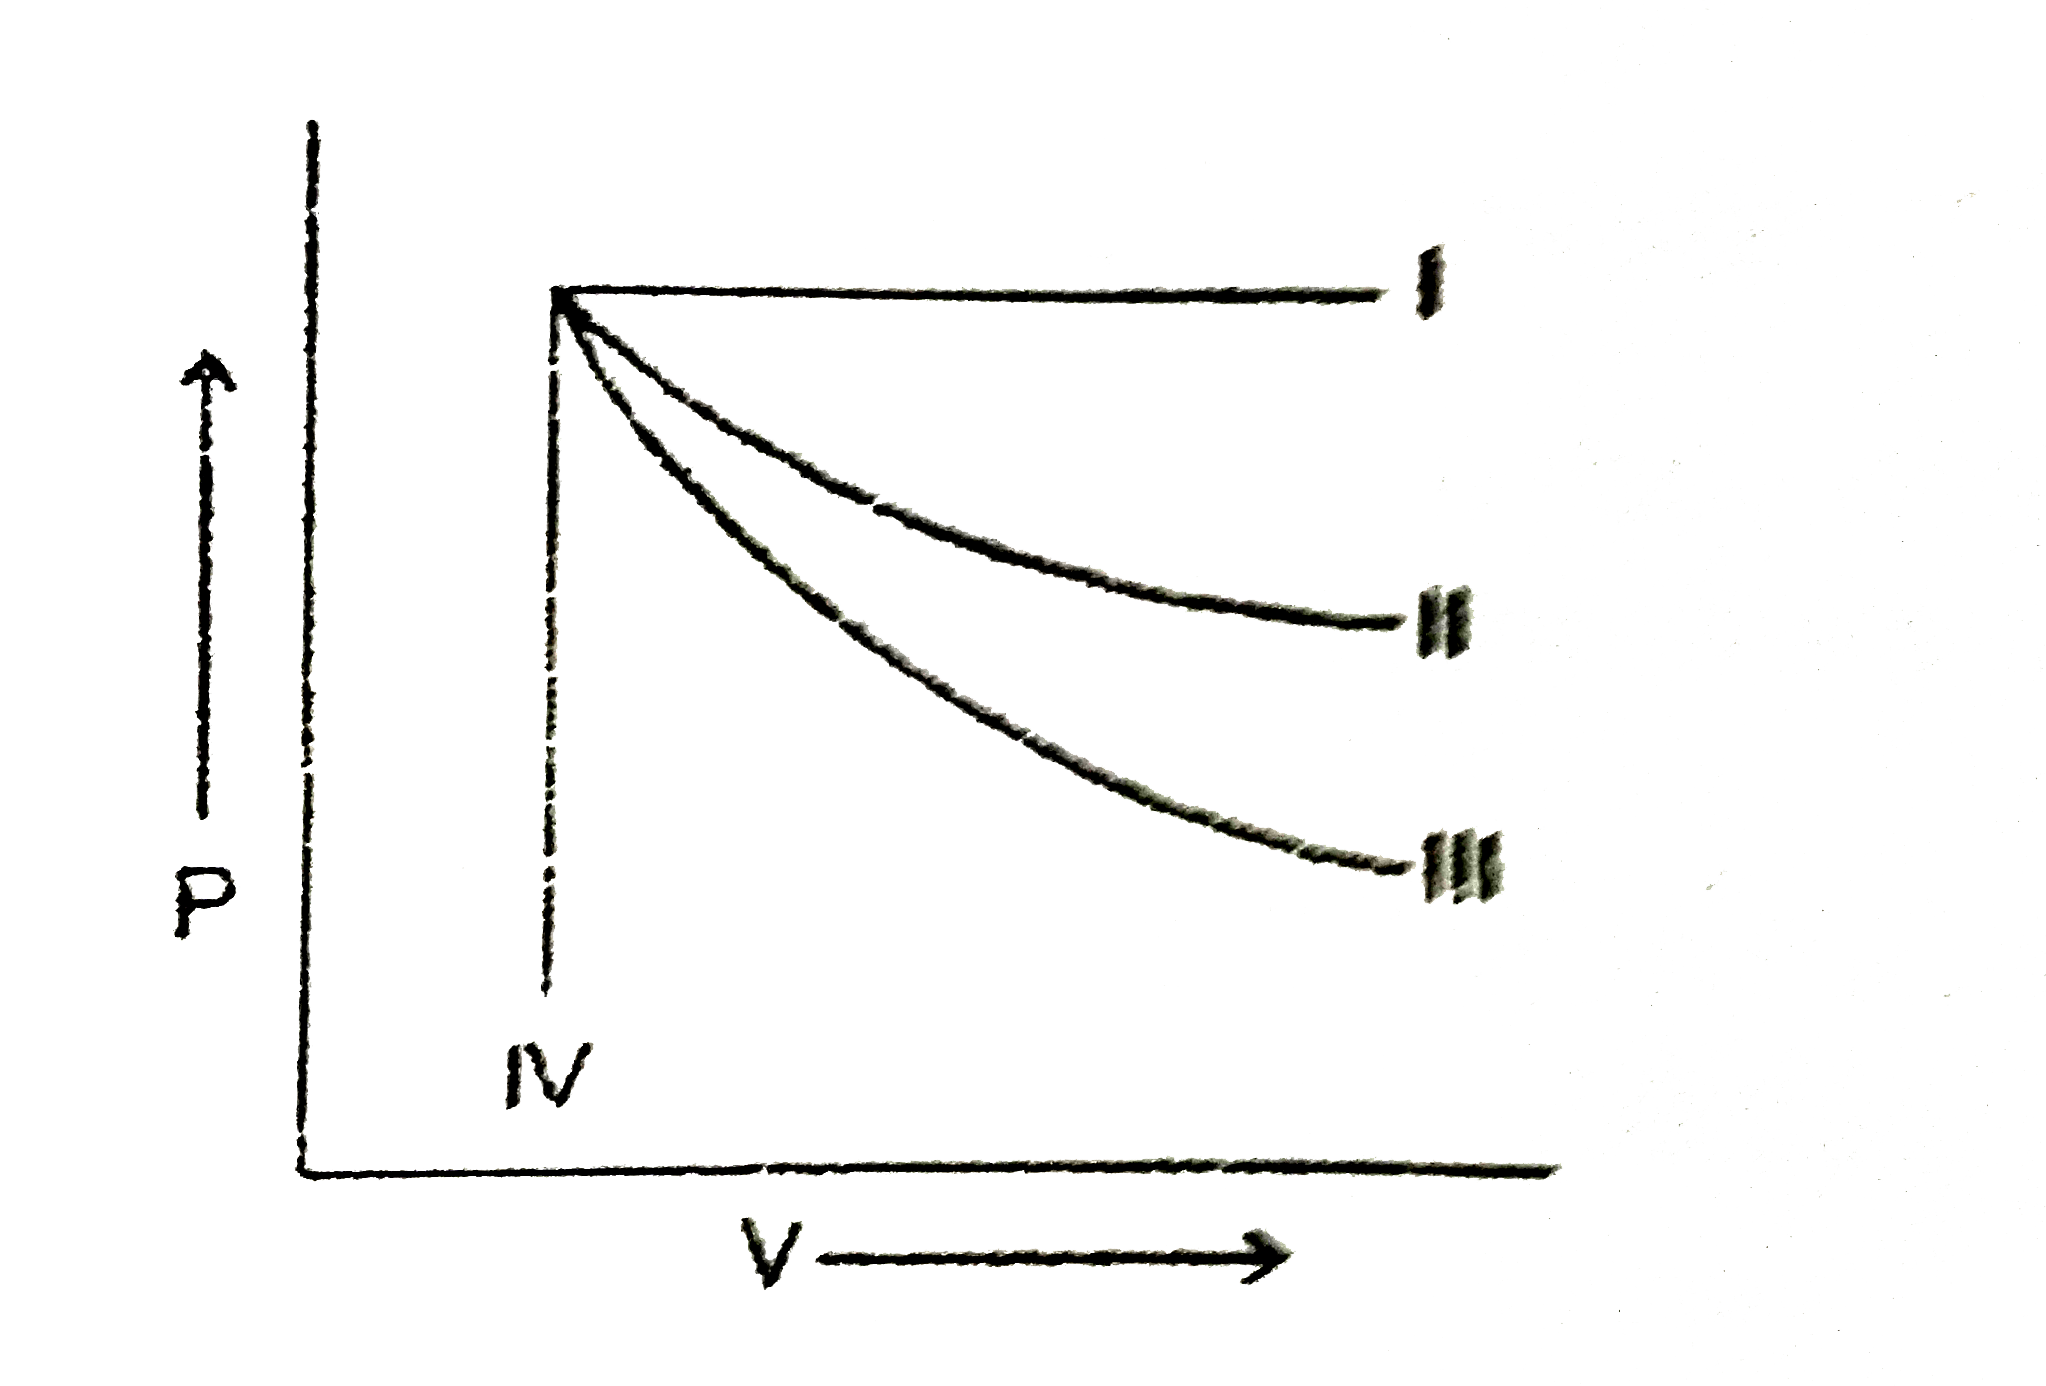
The plots between P and V which represent isochoric and isobaric process respectively:
View Solution

