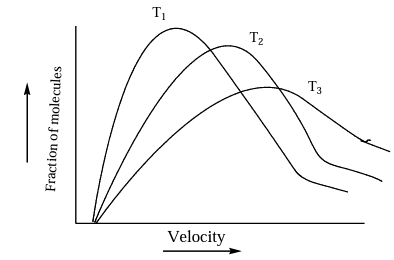
In the graph showing Maxwell Boltzmann distribution of energy ................ .
area under the curve increases with increase in temperature
area under the curve decreases with increase in temperature
with increase in temperature curve broadens and shifts to the right hand side.
as a gas cools to a lower temperature, the peak of the graph shifts to the left
The correct Answer is:A, D
Step by step video, text & image solution for In the graph showing Maxwell Boltzmann distribution of energy ................ . by Chemistry experts to help you in doubts & scoring excellent marks in Class 12 exams.
Updated on:21/07/2023Topper's Solved these Questions
- GRAPHICAL INTERPRETATIONBOOK - GRB PUBLICATIONCHAPTER - GRAPHICAL INTERPRETATIONEXERCISE - Comprehension 1
1 Videos
- GRAPHICAL INTERPRETATIONBOOK - GRB PUBLICATIONCHAPTER - GRAPHICAL INTERPRETATIONEXERCISE - Comprehension
49 Videos
- GRAPHICAL INTERPRETATIONBOOK - GRB PUBLICATIONCHAPTER - GRAPHICAL INTERPRETATIONEXERCISE - Electrochemistry
9 Videos
- F-BLOCK ELEMENTSBOOK - GRB PUBLICATIONCHAPTER - F-BLOCK ELEMENTSEXERCISE - Subjective type
7 Videos
- HYDROCARBON (ALIPHATIC)BOOK - GRB PUBLICATIONCHAPTER - HYDROCARBON (ALIPHATIC)EXERCISE - Previous years jee questions
28 Videos
Similar Questions
Knowledge Check
In the graph showing Maxwell Boltzmann distribution of energy ................ .
Aarea under the curve must not change with increase in temperatureBarea under the curve increases with increases in temperatureCarea under the curve decreases with increase in temperatureDwith increase in temperature curve broadens and shifts to the right hand side.In the graph showing Maxwell Boltzman distribution of energy, ________.
Aarea under the curve must not change with increase in temperatureBarea under the curve increases with increase in temperatureCarea under the curve decreases with increase in temperatureDwith increase in temperature curve broadens and shifts to the right hand sideAccording to Maxwell Boltzmann distribution of energy
Athe fraction of molecules with most probable kinetic energy decrease at higher temperaturesBthe fraction of molecules with most probable kinetic energy increases at higher temperaturesCmost probable kinetic energy decreases at higher temperaturesDmost probable kinetic energy decreases at higher temperatures.
According to Maxwell Boltzmann distribution of energy
View SolutionAccording to Maxwell , Boltzmann distriubtion of energy ……… .
View SolutionMaxwell distribution is true when
View SolutionAccording to Maxwell Boltzmann distribution of energy, …. .
I. The fraction of molecules with most probable kinetic energy decreases at higher temperatures.
II. The fraction of molecules with most probable kinetic energy increases at higher temperatures.
III. Most probable kinetic energy decreases at higher temperatures
IV. Most probable kinetic energy increases at higher temperatures.
The most appropriate option with all correct statements is
View SolutionThe maximum in the curves describing the Maxwell-Boltzmann distribution of speeds corresponds to
View Solution

