A student analyzed tha data from a zero order reaction and obtained the graph shown. What labels should be attached to the X and Y axes, respectively ?
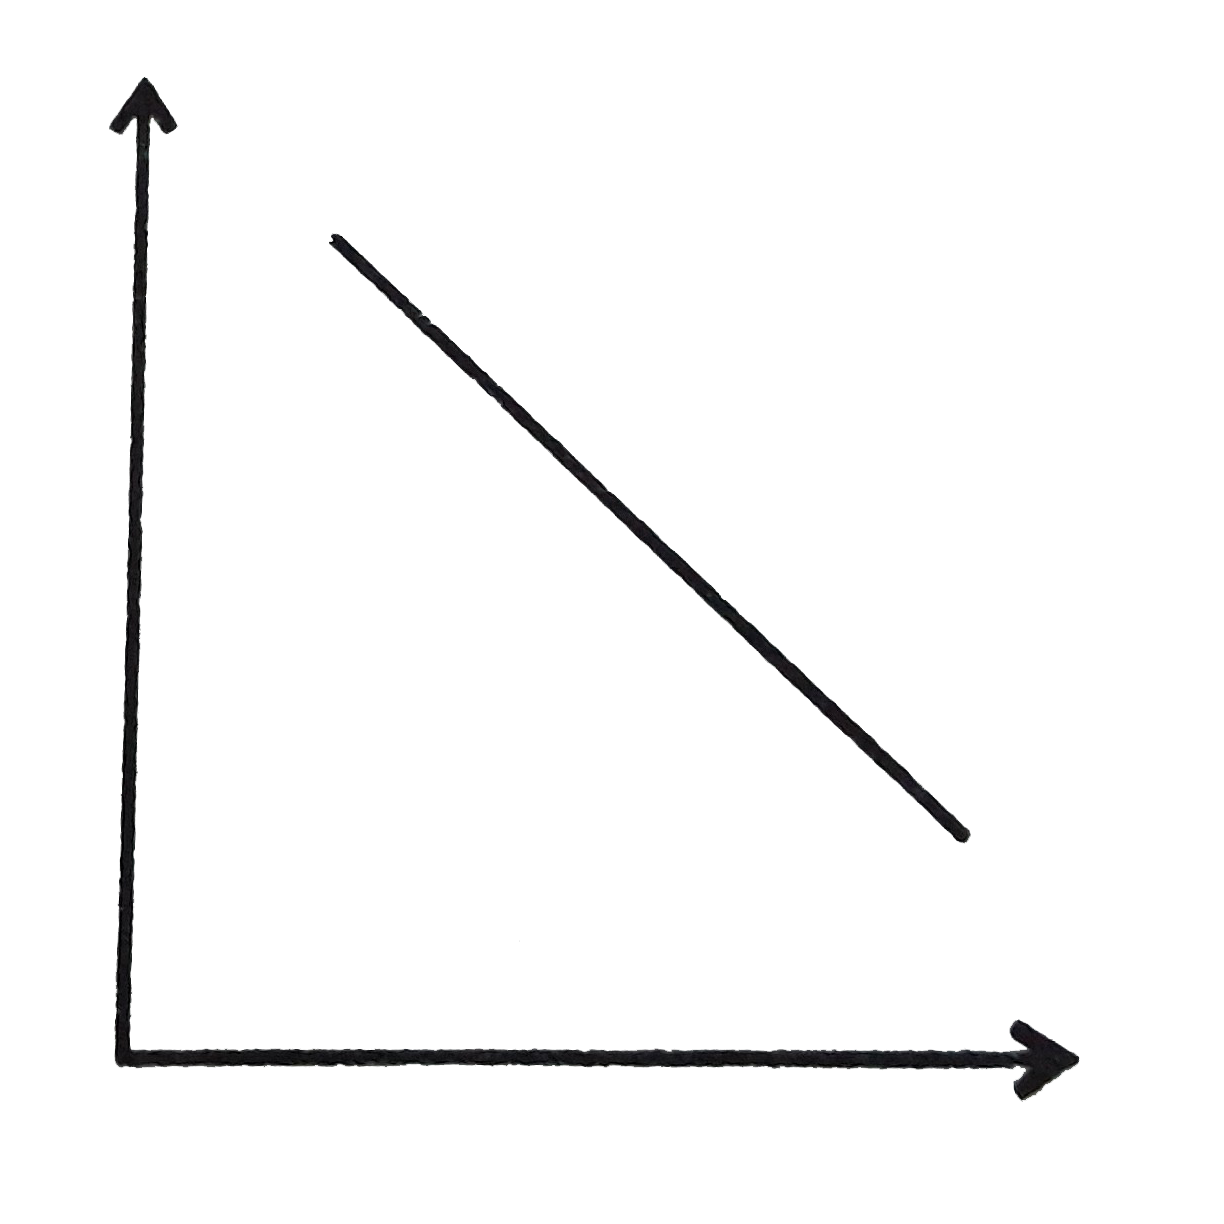
Time, concentration
Time, 1/concentration
Time, ln (concentration)
1/time, concentration
The correct Answer is:A
Step by step video, text & image solution for A student analyzed tha data from a zero order reaction and obtained the graph shown. What labels should be attached to the X and Y axes, respectively ? by Chemistry experts to help you in doubts & scoring excellent marks in Class 12 exams.
Updated on:21/07/2023Topper's Solved these Questions
- GRAPHICAL INTERPRETATIONBook:GRB PUBLICATIONChapter:GRAPHICAL INTERPRETATIONExercise:I.Electrochemistry
Explore 1 Video
- GRAPHICAL INTERPRETATIONBook:GRB PUBLICATIONChapter:GRAPHICAL INTERPRETATIONExercise:Electrochemistry
Explore 9 Videos
- GRAPHICAL INTERPRETATIONBook:GRB PUBLICATIONChapter:GRAPHICAL INTERPRETATIONExercise:H. Chemical Kinetics
Explore 1 Video
- F-BLOCK ELEMENTSBook:GRB PUBLICATIONChapter:F-BLOCK ELEMENTSExercise:Subjective type
Explore 7 Videos
- HYDROCARBON (ALIPHATIC)Book:GRB PUBLICATIONChapter:HYDROCARBON (ALIPHATIC)Exercise:Previous years jee questions
Explore 28 Videos
Similar Questions
Find the equation of the circle which passes through the origin and cuts off intercepts a and b respectively from x and y−axes.
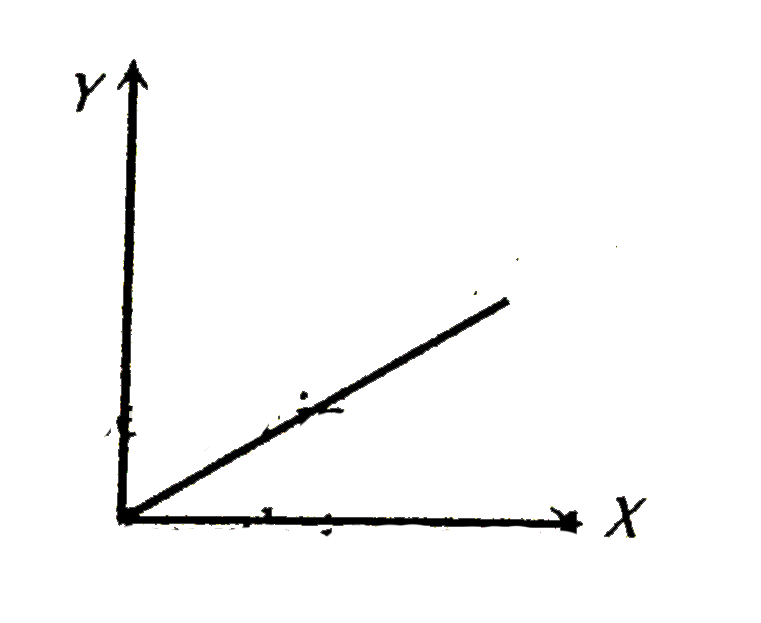
View SolutionA student plots a graph from his reading on the determination of Young's modulus of a metal wire but forgets to label. The quantities on X and Y may be respectively.
View Solution
Knowledge Check
What is the order of a reaction that produces the graphs shown ?
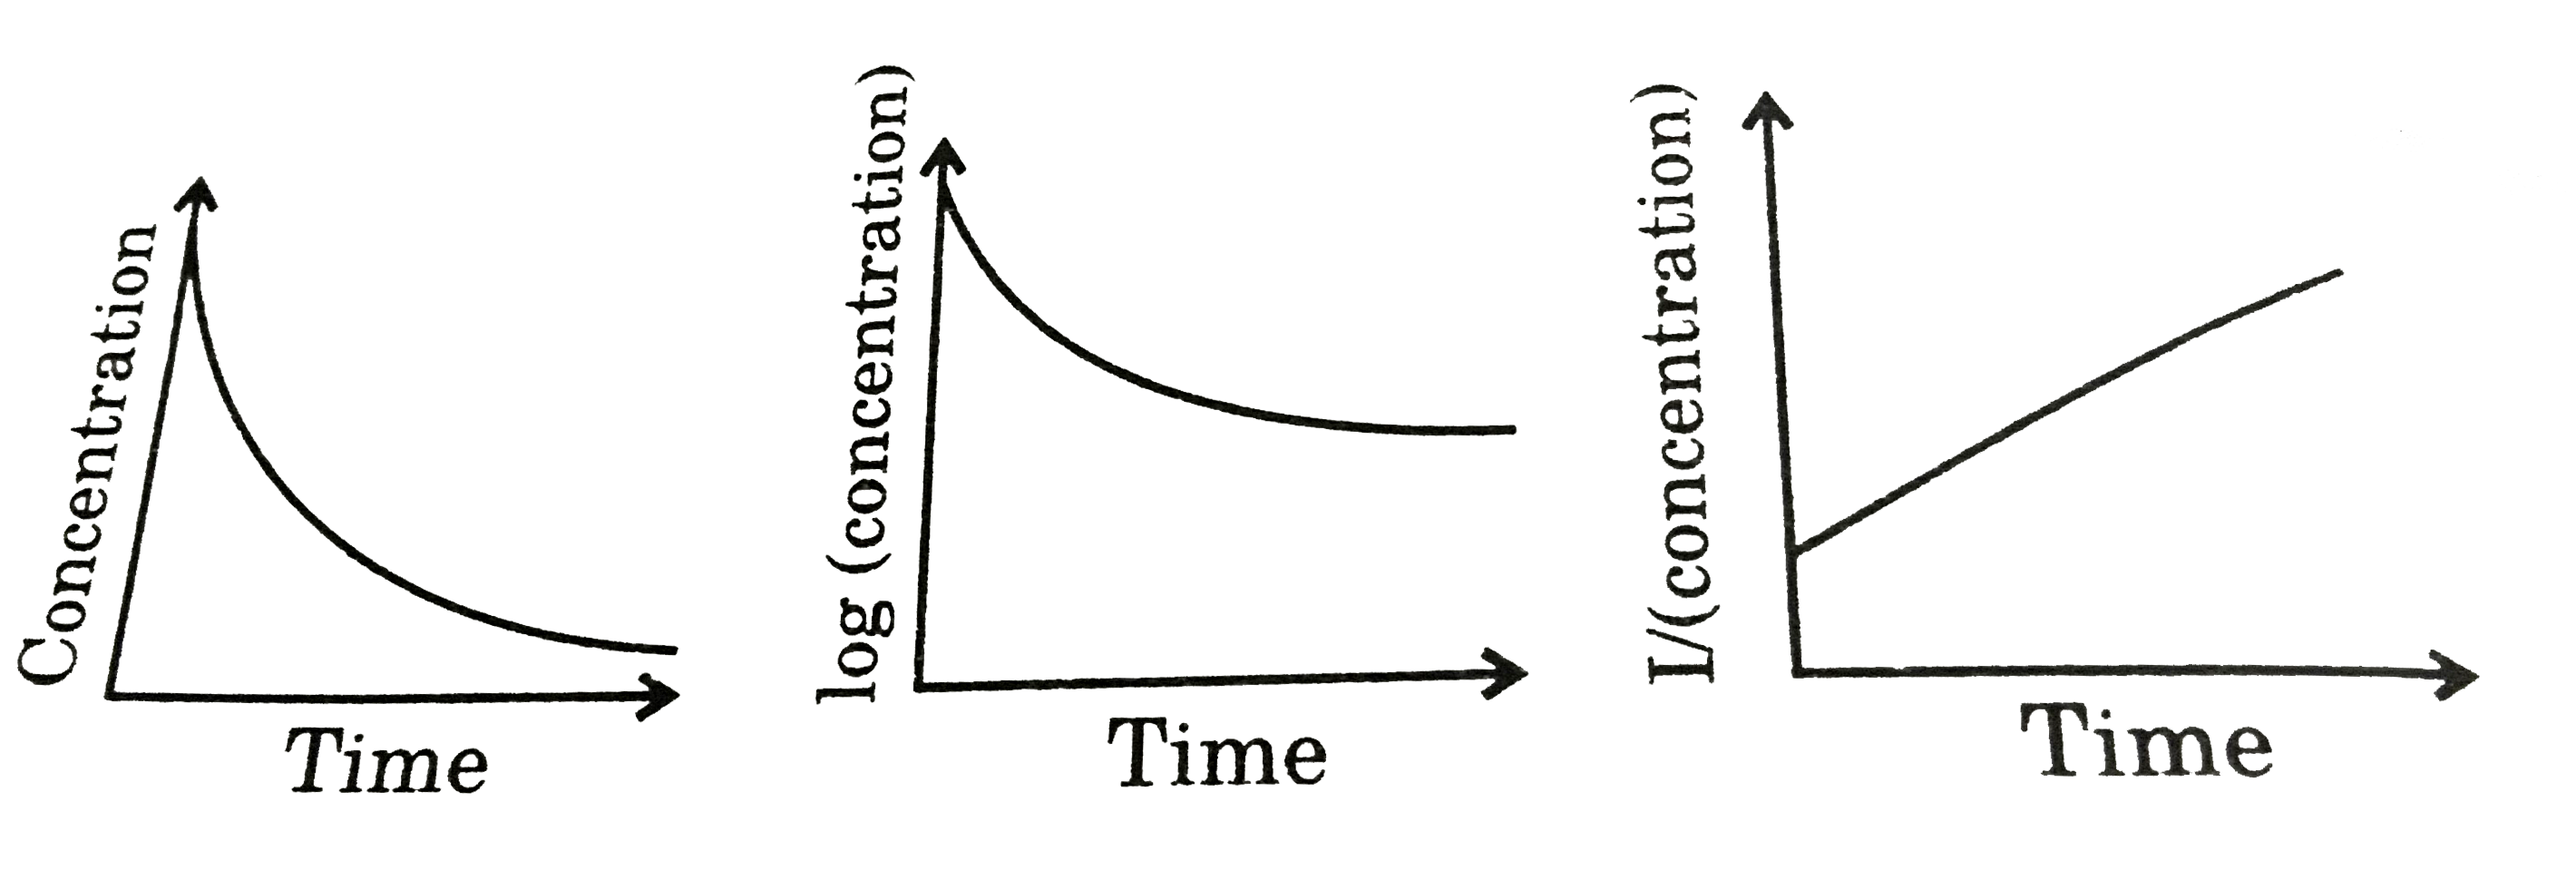 AZero orderBFirst orderCSecond orderDSome other order
What should be added to 8 (3x 4y) to obtain (18 x - 18 y) ?
A6x−14yB14y+6xC14y−6xD6xyFor a zero order reaction a graph of conc. (along Y axis) and time (along X-axis) is linear with
Aa +ve slope and a non - zero Y- interceptBa −ve slope with a non - zero Y-interceptCa +ve slope with a zero Y - interptDa −ve slopw with a zero Y-intercept
The reaction 2X→Y+Z would be zero order reaction when
View SolutionFor a zero order reaction a plot of rate (along Y-axis) and concentration (along X-axis) is
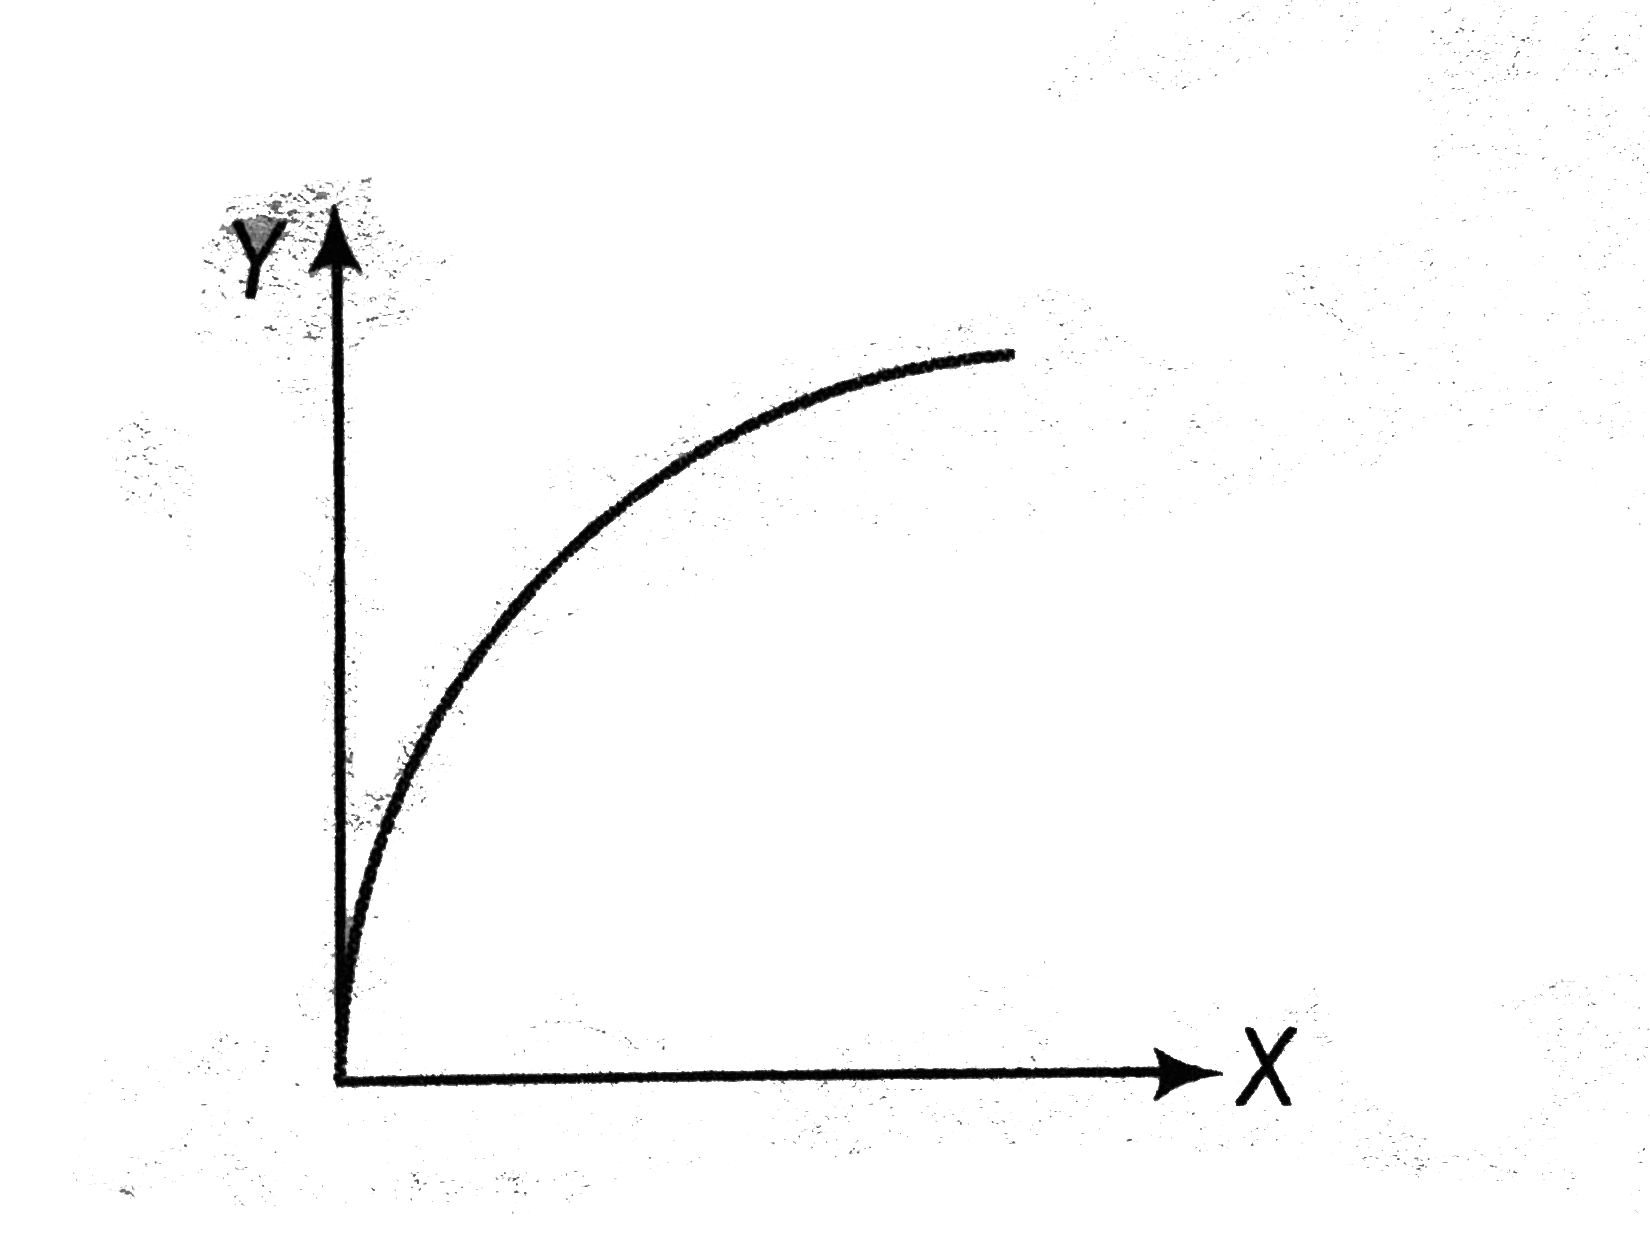
View SolutionThe graph shows the behaviour of a steel wire in the region for whoch the wire obeys Hooke's law. The graph is a parabola. The variables X and Y -axes, respectively can be [ stress (σ),strain (ε) and elastic potential energy(U) ]
View SolutionWhat should be added to 8 (3x 4y) to obtain (18 x - 18 y) ?
View SolutionThe procedure for the admission in the college by the students is depicted in the Data flow diagram. After analyzing the given Data flow diagram, go through the following questions:
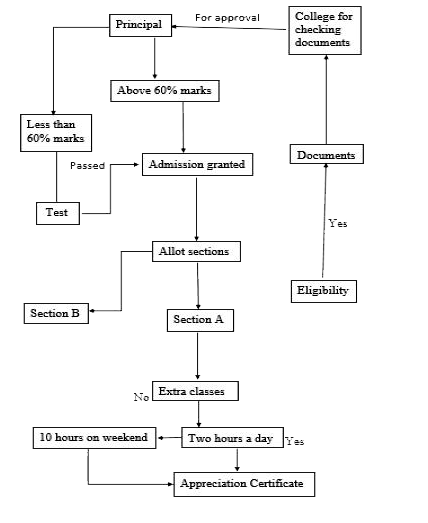
What step should be taken by the student if the eligibility is not met?
View Solution

