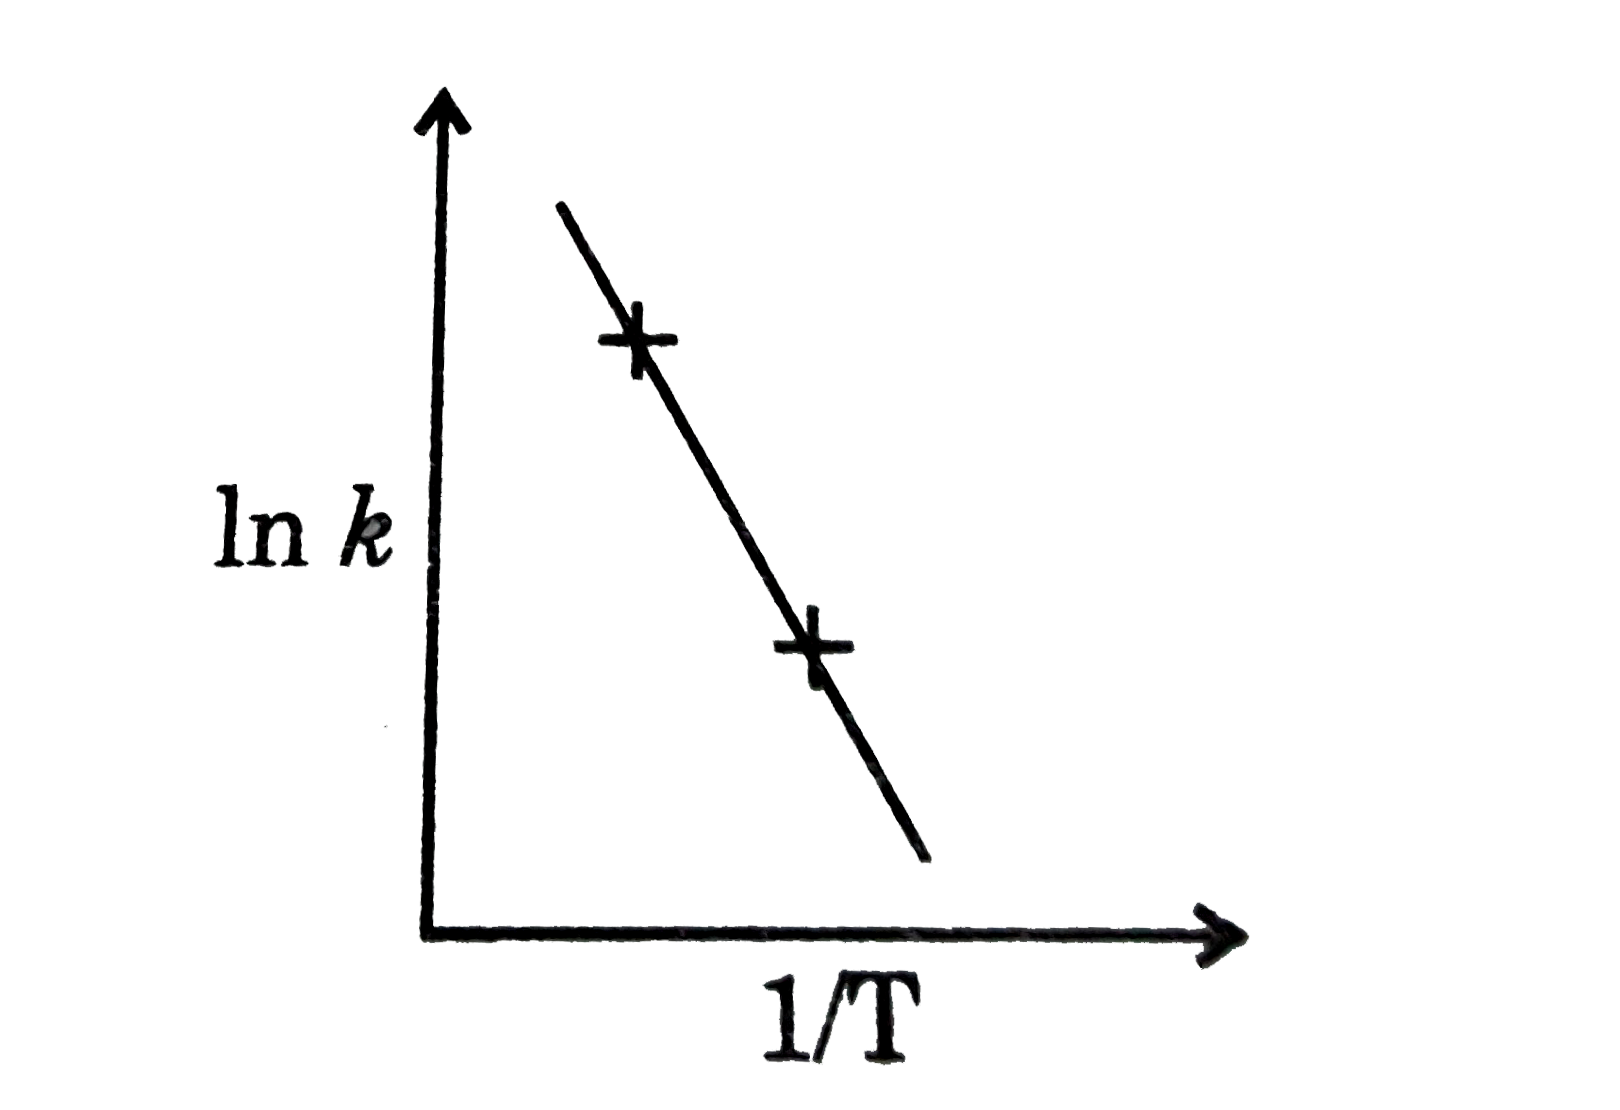
The value of the specific rate constant, k, for a reaction is determined at two different temperatures and plotted in the accompanying graph. What is the relationship between the slope of the graph and the activation energy, Ea?

slope =EA
slope =−Ea
slope =−Ea/R
slope =Ea×R
The correct Answer is:C
Step by step video, text & image solution for The value of the specific rate constant, k, for a reaction is determined at two different temperatures and plotted in the accompanying graph. What is the relationship between the slope of the graph and the activation energy, E_(a)? by Chemistry experts to help you in doubts & scoring excellent marks in Class 12 exams.
Updated on:21/07/2023Topper's Solved these Questions
- GRAPHICAL INTERPRETATIONBOOK - GRB PUBLICATIONCHAPTER - GRAPHICAL INTERPRETATIONEXERCISE - I.Electrochemistry
1 Video
- GRAPHICAL INTERPRETATIONBOOK - GRB PUBLICATIONCHAPTER - GRAPHICAL INTERPRETATIONEXERCISE - Electrochemistry
9 Videos
- GRAPHICAL INTERPRETATIONBOOK - GRB PUBLICATIONCHAPTER - GRAPHICAL INTERPRETATIONEXERCISE - H. Chemical Kinetics
1 Video
- F-BLOCK ELEMENTSBOOK - GRB PUBLICATIONCHAPTER - F-BLOCK ELEMENTSEXERCISE - Subjective type
7 Videos
- HYDROCARBON (ALIPHATIC)BOOK - GRB PUBLICATIONCHAPTER - HYDROCARBON (ALIPHATIC)EXERCISE - Previous years jee questions
28 Videos
Similar Questions
Knowledge Check
The rate constant (K') of one reaction is double of the rate constant (K") of another reaction. Then the relationship between the corresponding activation energies of the two reactions (E′aandE''a) will be
AEa>EaBEa=EaCEa<EaDEa=4EaThe rate constant (k1) of one of the reactions is found to be double than that of the rate constant (k2) of another reaction. The relationship between the corresponding activation energies of the two reactions Ea1<Ea2
AEa1>Ea2BEa1=Ea2CEa1=2Ea2DNone of theseThe rate constant of a reaction at temperature 200 K is 10 times less than the rate constant at 400 K. What is the activation energy (Ea) of the reaction ? (R = gas constant)
A1842.4 RB921.2 RC460.6 RD230.3 R
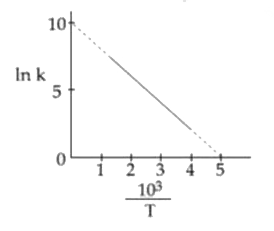
The rate constant (k) of a rection is measured different temperatures (T) , and the data are plotted in the given figure . The activation energy of the reaction in kJmol−1 is : (R is gas constant )

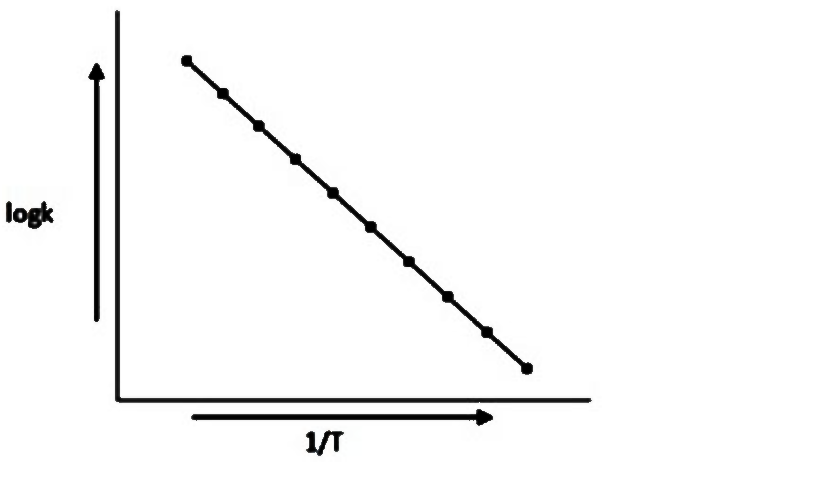
View SolutionWhen a plot between logk and 1/T is plotted we get the graph as shown.

What is the value of slope in the graph?
View SolutionThe rate constant (K') of one reaction is double of the rate constant (K") of another reaction. Then the relationship between the corresponding activation energies of the two reactions (E′aandE''a) will be
View SolutionThe rate constant K1 of a reaction is found to be double that of rate constant K2 of another reaction. The relationship between corresponding activation energies of the two reaction at same temperature (E1andE2) can be represented as:
View SolutionThe rate constant (k') of one of the reaction is found to be double that of the rate constant (k") of another reaction. Then the relationship between the corresponding activation energies of the two reactions can be represented as
View Solution