A graph plotted between log t50% vs log concentration is a straight line. What conclusion can you draw from this graph?
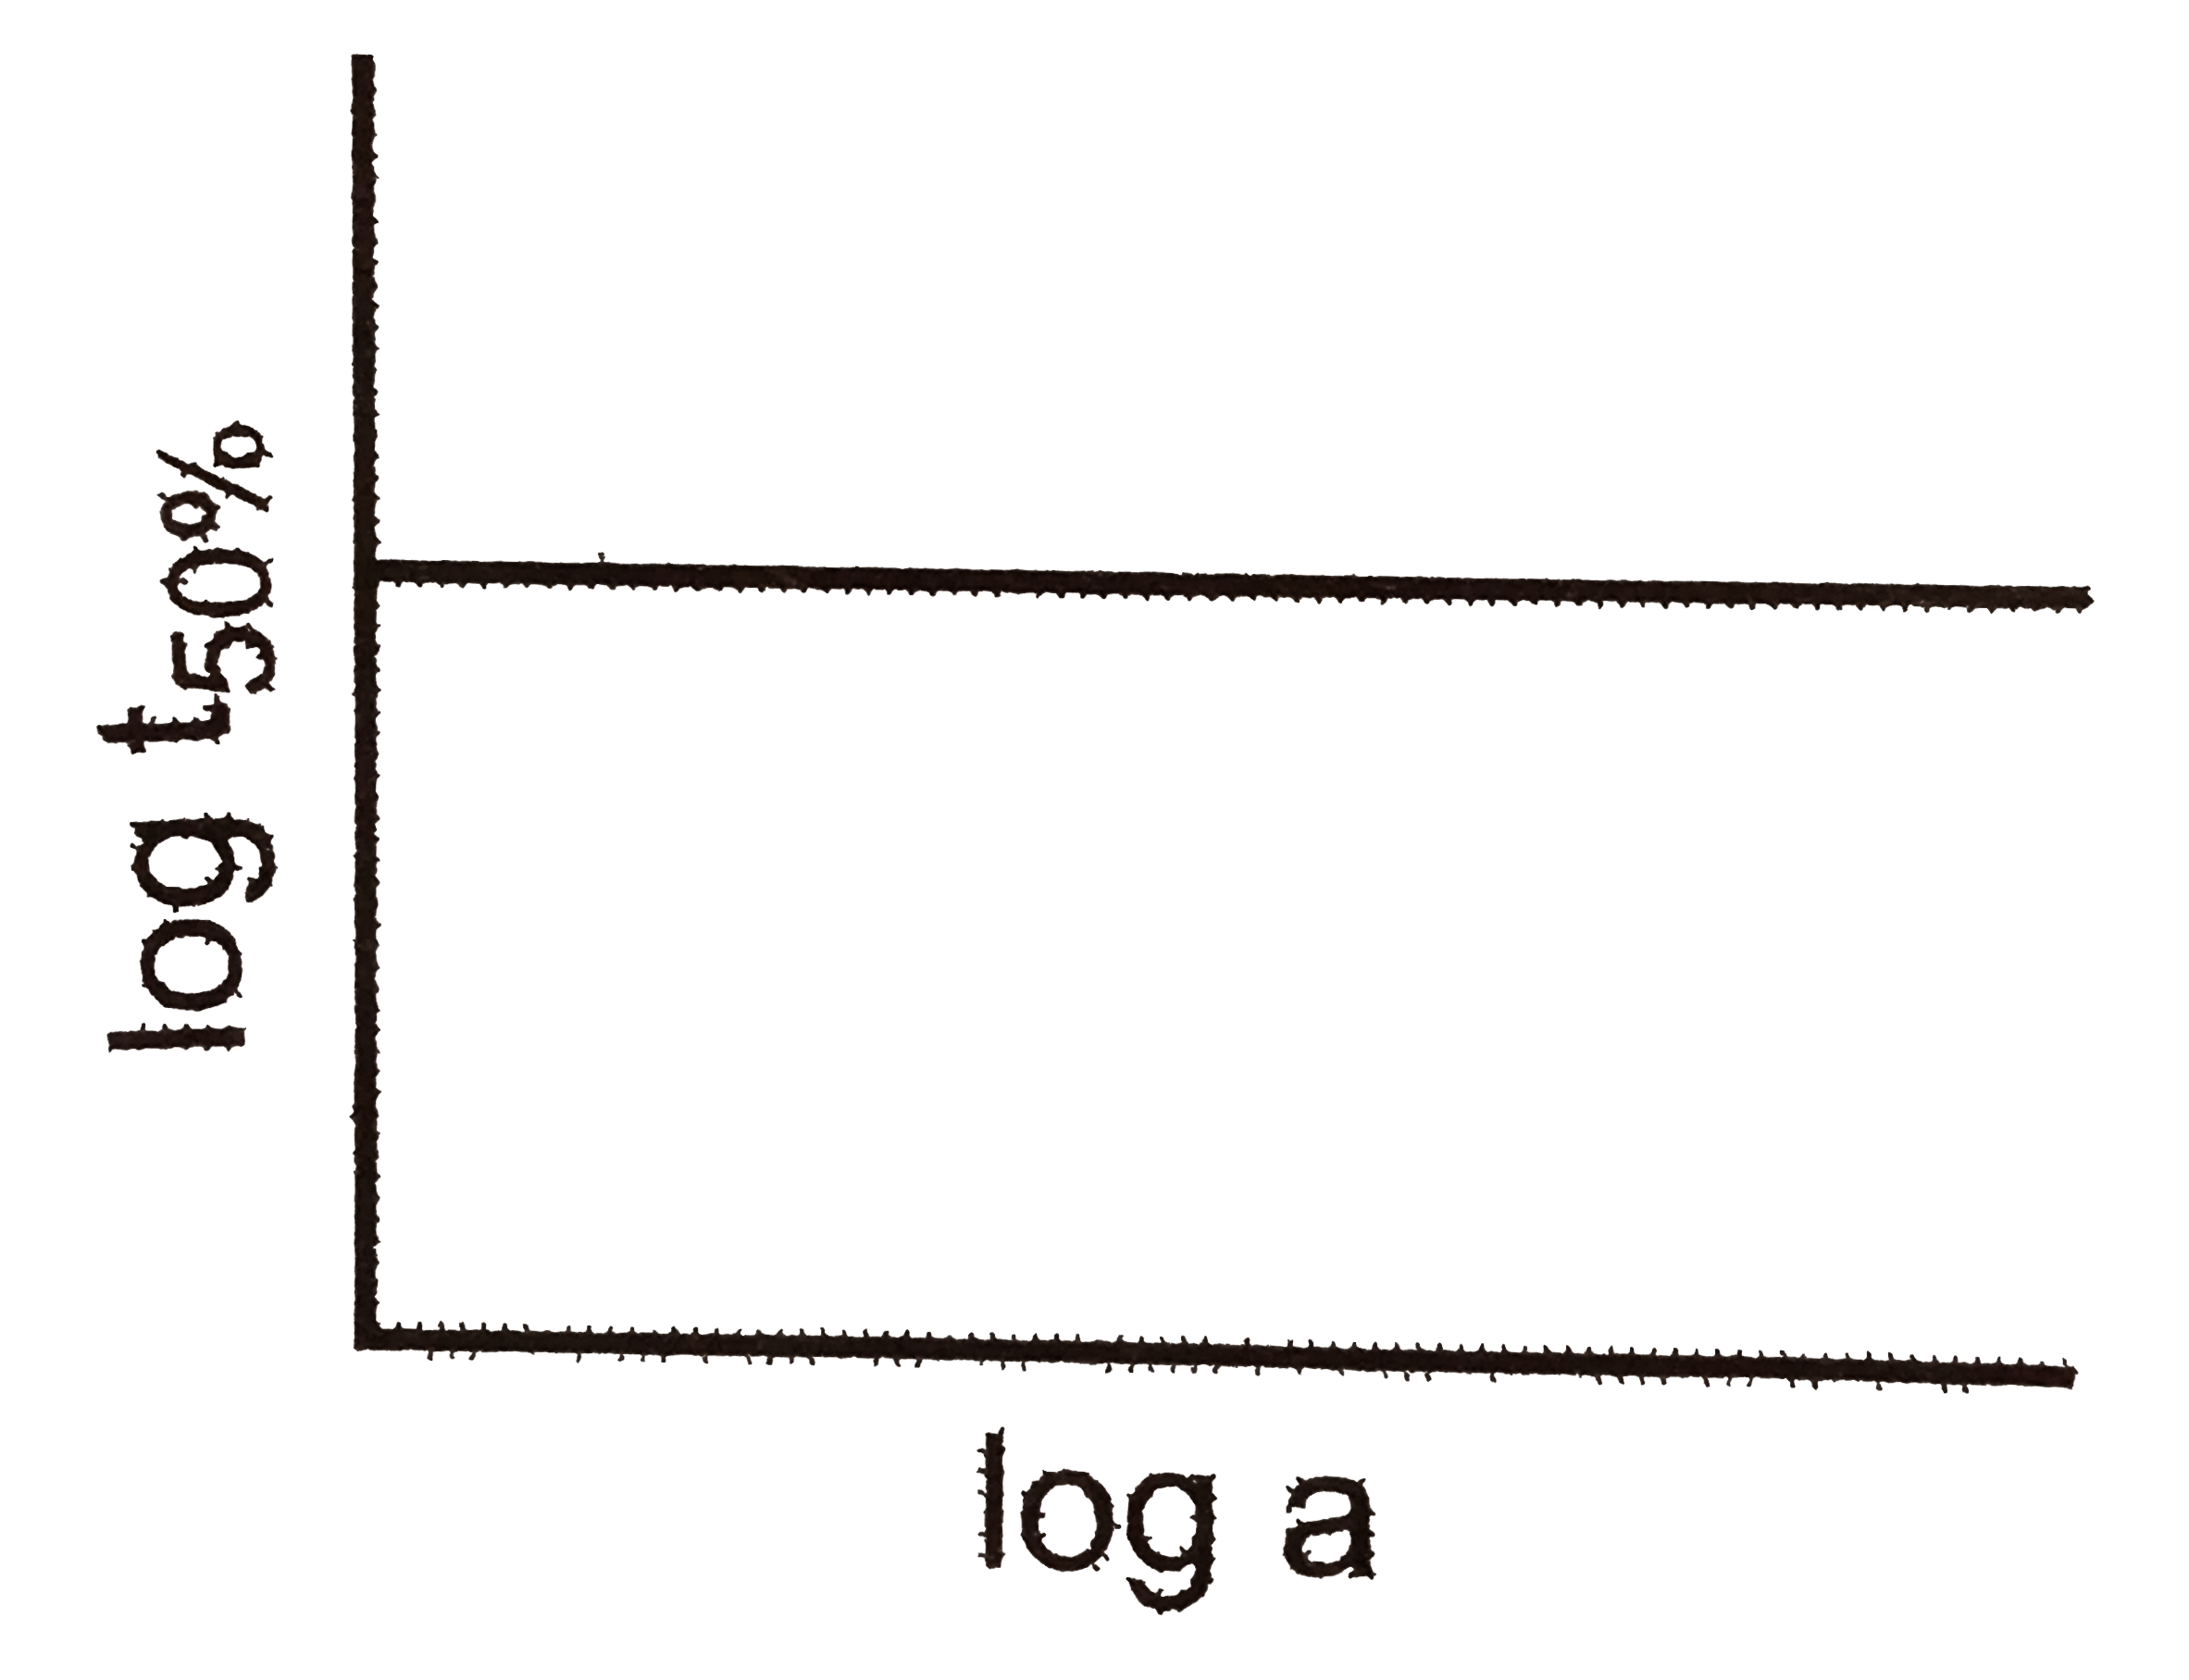
n=1,t1/2∝a
n=2,t1/2∝1a
n=1,t1/2=(0.693/k)
None of the above
The correct Answer is:C
Step by step video, text & image solution for A graph plotted between log t_(50%) vs log concentration is a straight line. What conclusion can you draw from this graph? by Chemistry experts to help you in doubts & scoring excellent marks in Class 12 exams.
Updated on:21/07/2023Topper's Solved these Questions
- GRAPHICAL INTERPRETATIONBook:GRB PUBLICATIONChapter:GRAPHICAL INTERPRETATIONExercise:I.Electrochemistry
Explore 1 Video
- GRAPHICAL INTERPRETATIONBook:GRB PUBLICATIONChapter:GRAPHICAL INTERPRETATIONExercise:Electrochemistry
Explore 9 Videos
- GRAPHICAL INTERPRETATIONBook:GRB PUBLICATIONChapter:GRAPHICAL INTERPRETATIONExercise:H. Chemical Kinetics
Explore 1 Video
- F-BLOCK ELEMENTSBook:GRB PUBLICATIONChapter:F-BLOCK ELEMENTSExercise:Subjective type
Explore 7 Videos
- HYDROCARBON (ALIPHATIC)Book:GRB PUBLICATIONChapter:HYDROCARBON (ALIPHATIC)Exercise:Previous years jee questions
Explore 28 Videos
Similar Questions
Knowledge Check
A graph plotted between logt50% vs log concentration in a straight line. What conclusion can you draw from this graph?
 An= 1, t1/2=tx×aBn=2,t1/2=1aCn=1,t1/2=0.693kDnone of these
A graph plotted between log t50% vs log concentration is a straight line. What conclusion can you draw from this graph?
 An = 1 , t1/2=1KaBn = 2 , t1/2=1/aCn=1,t1/2=0.693KDNone of these
A graph plotted between log k vs 1T is represented by
A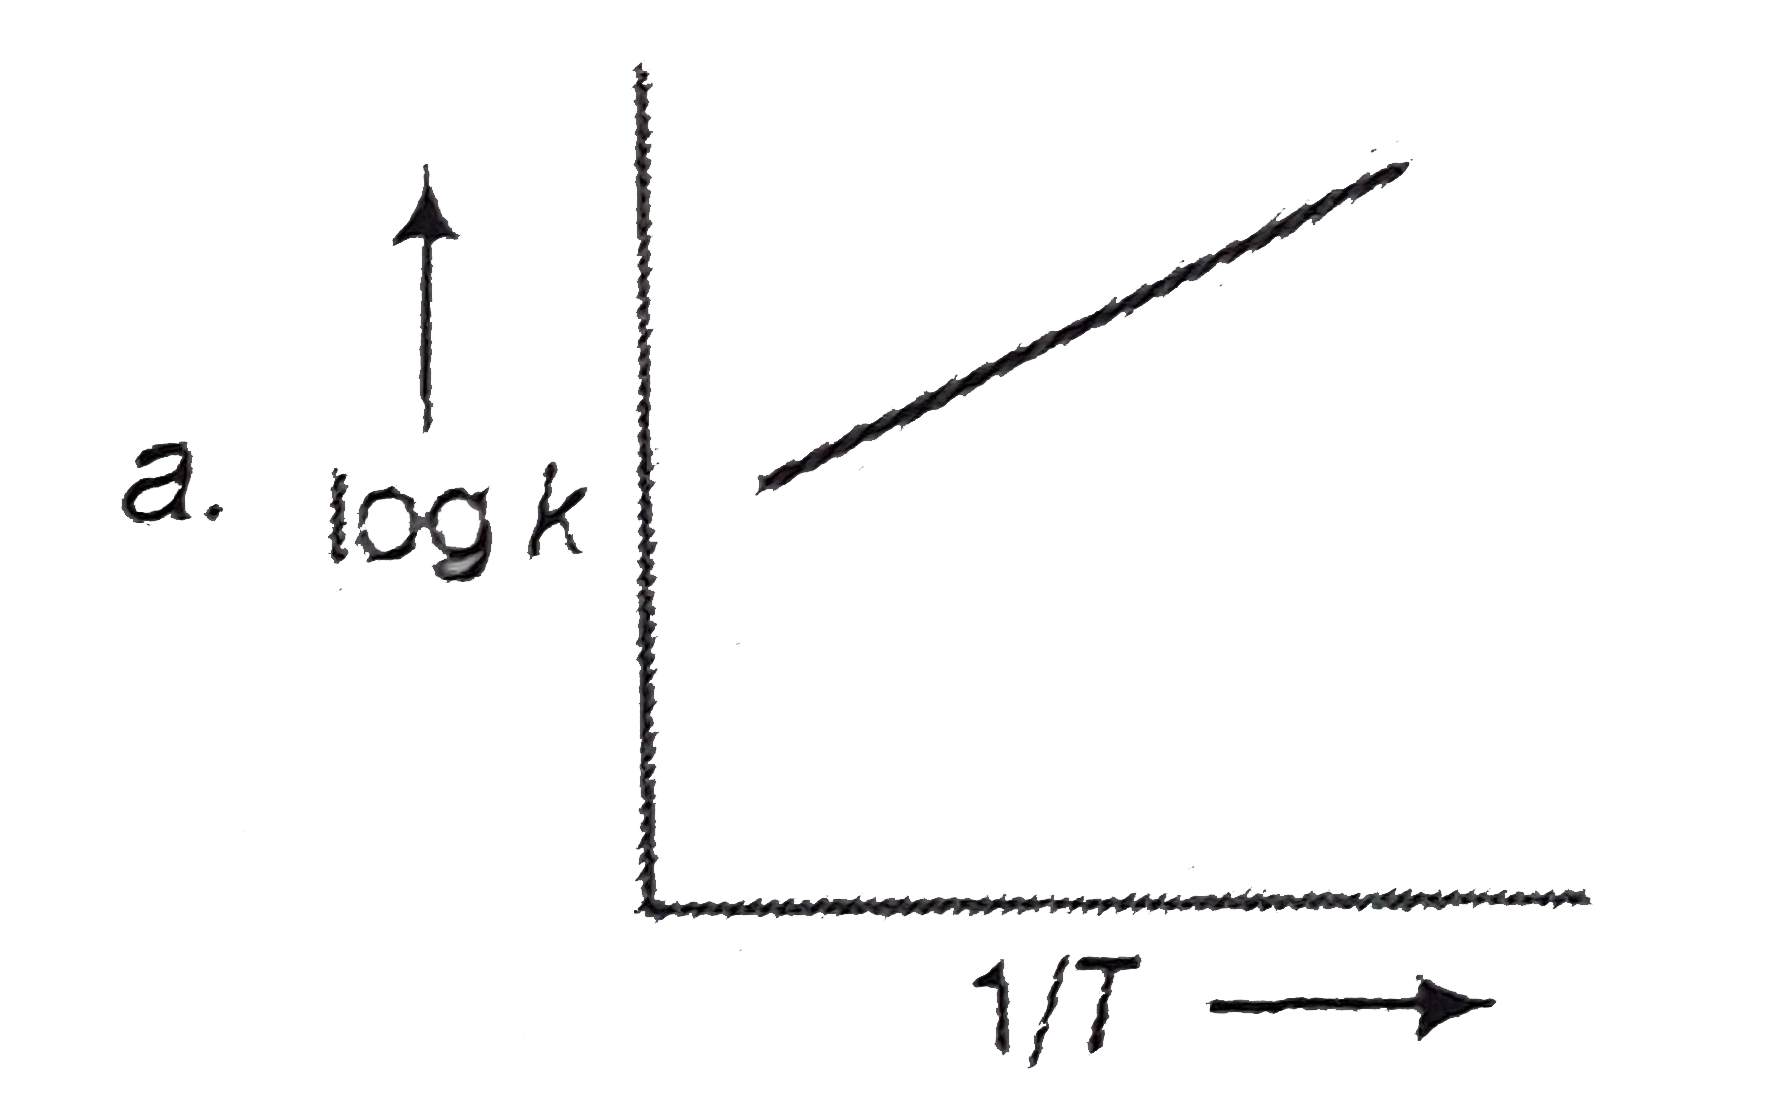 B
B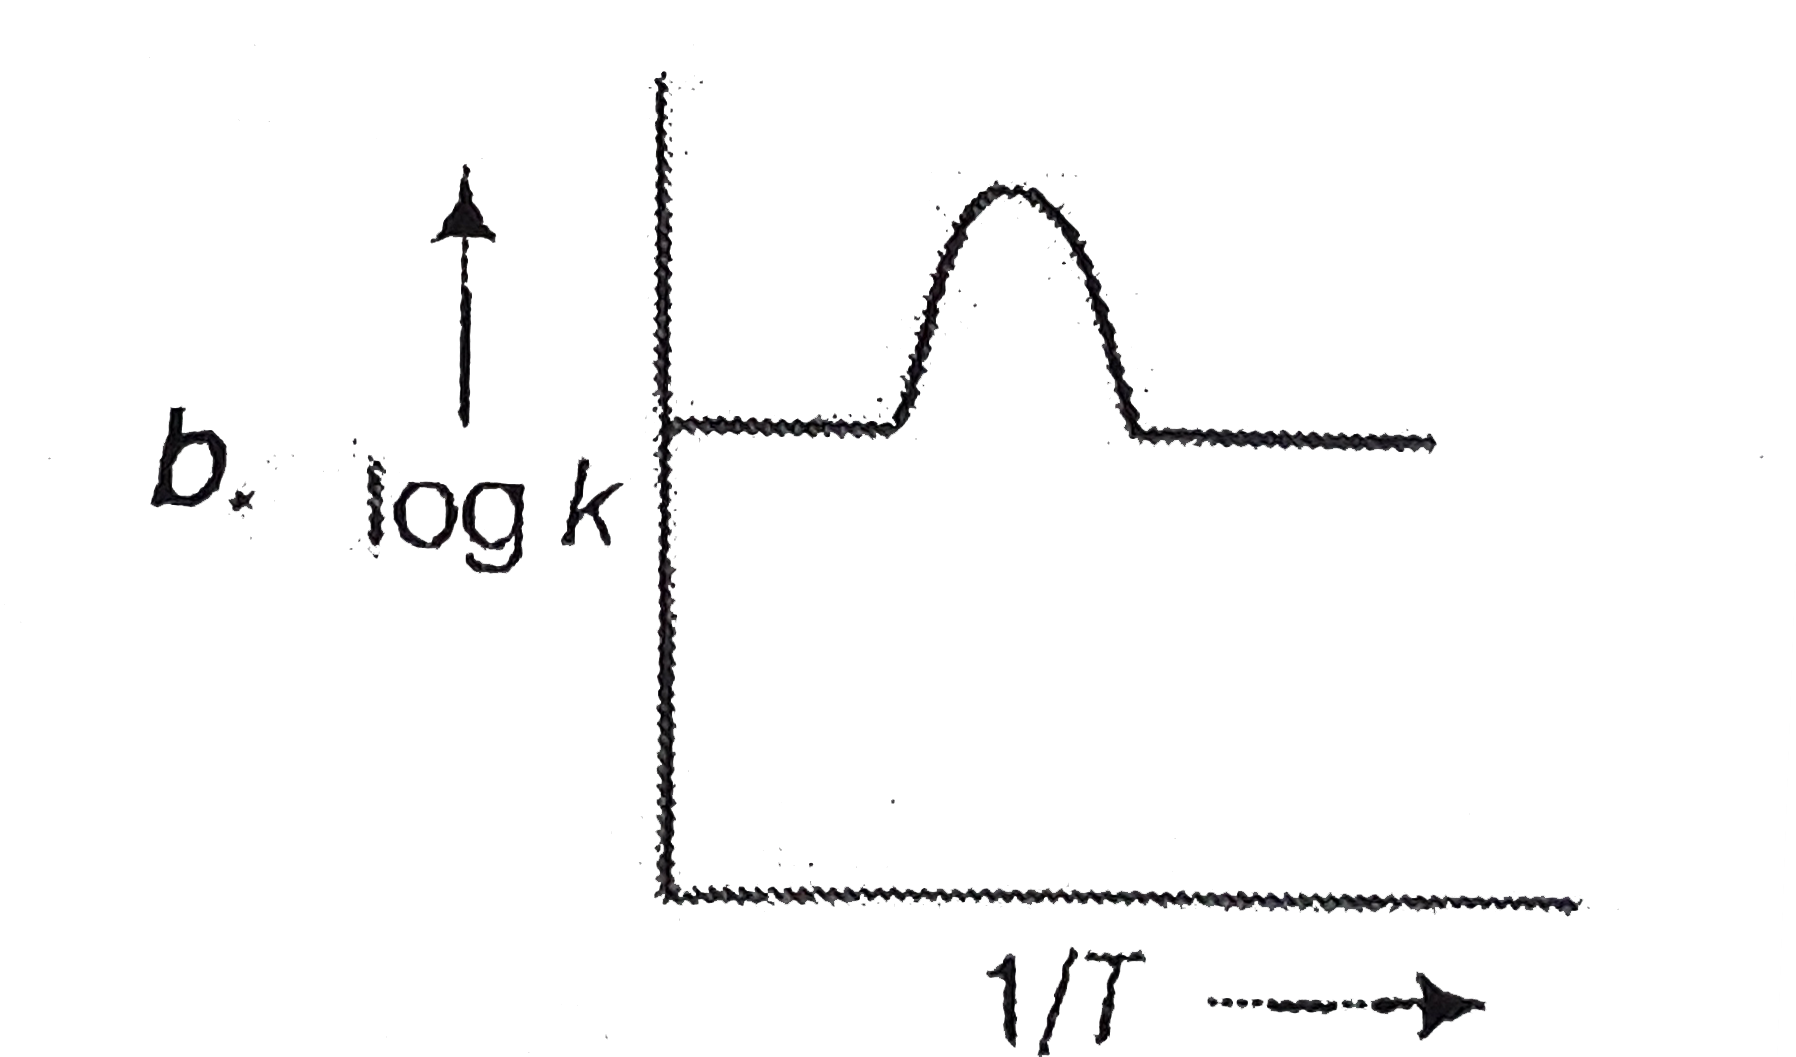 C
C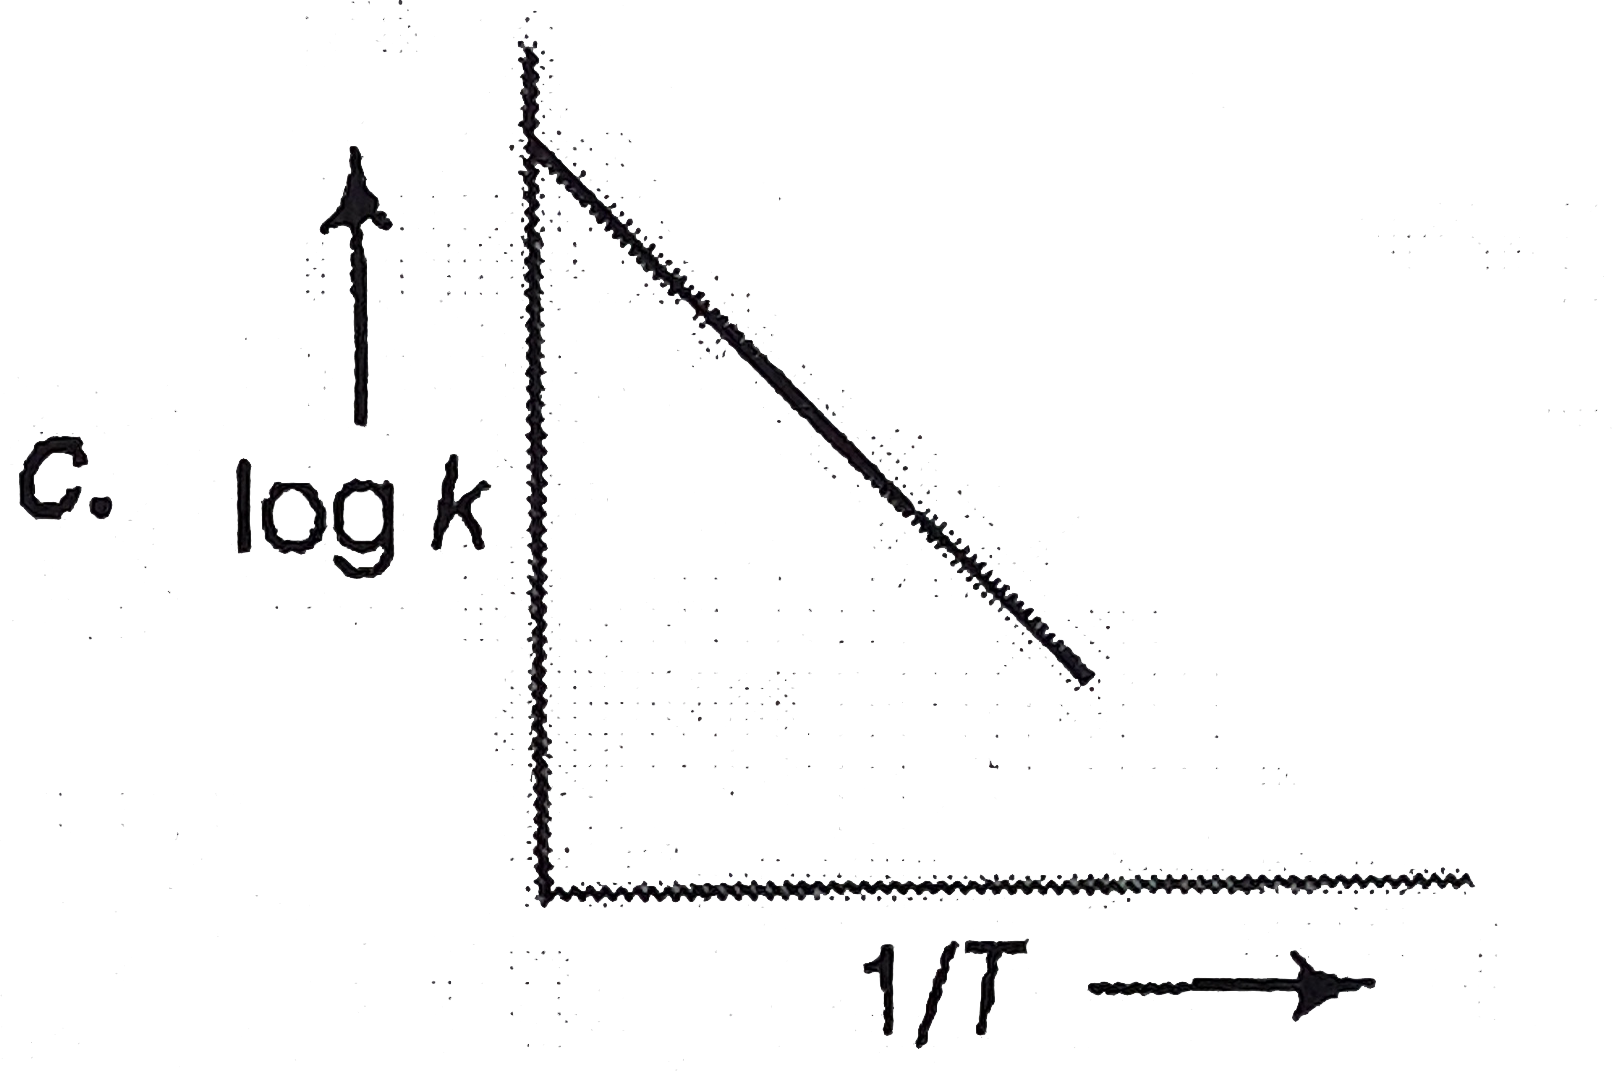 D
D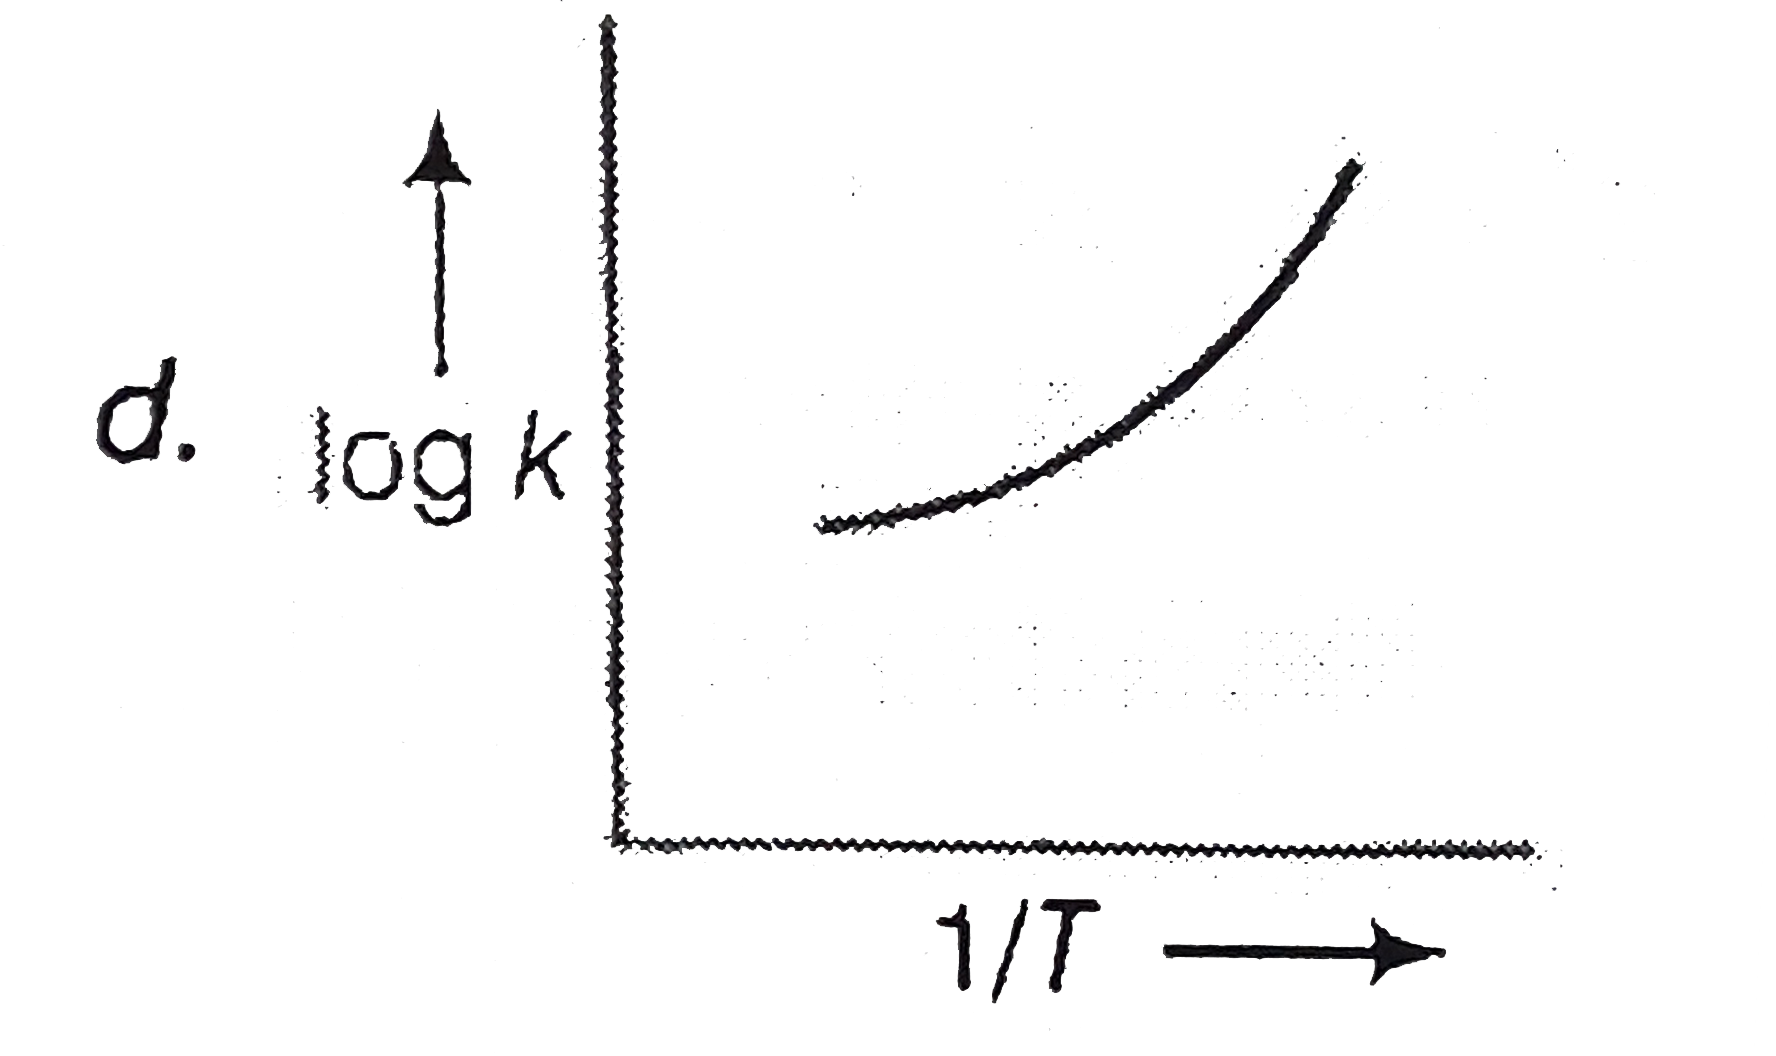
A graph plotted between logk versus 1/T for calculating activation energy is shown by
View SolutionA graph plotted between log N vs, time gives a slope and intercept equal to:
View SolutionA graph plotted between logk versus 1/T for calculating activation energy is shown by
View SolutionWhich conclusion can be drawn if a graph is plotted between log t50% vs. log [reactant] if it show an intercept 'A' and tanθ=0?
View SolutionA graph plotted between logk versus 1/T for calculating activation energy is shown by
View Solution


