A graph plotted between log N vs, time gives a slope and intercept equal to:
−λ2.303,logN0
λ2.303,logN0
−λ2.303,N0
λ2.303,N0
The correct Answer is:(a)
+2.303logN0−λt=0.303logN
or log N=−λt2.303+logN0
∴ Slope =−λ2.303, intercept log N0
Topper's Solved these Questions
- RADIO ACTIVITYBook:P BAHADURChapter:RADIO ACTIVITYExercise:Exercies 3B
Explore 13 Videos
- RADIO ACTIVITYBook:P BAHADURChapter:RADIO ACTIVITYExercise:Exercies 4
Explore 17 Videos
- RADIO ACTIVITYBook:P BAHADURChapter:RADIO ACTIVITYExercise:Exercies 2
Explore 19 Videos
- MOLE AND EQUIVALENT CONCEPTBook:P BAHADURChapter:MOLE AND EQUIVALENT CONCEPTExercise:Exercise 9 Advanced numerical problems
Explore 61 Videos
- REDOX REACTIONSBook:P BAHADURChapter:REDOX REACTIONSExercise:Exercise(8) Statement:Explanation type problems
Explore 19 Videos
Similar Questions
For an elementry reaction aA→ product, the graph plotted between reaction log[−d[A]dt] vs. time gives a straight line with intercept equal to 0.6 and showing an angle of 45∘ with origin, then:
View SolutionWhich conclusion can be drawn if a graph is plotted between log t50% vs. log [reactant] if it show an intercept 'A' and tanθ=0?
View Solution
Knowledge Check
A graph plotted between log k vs 1T is represented by
A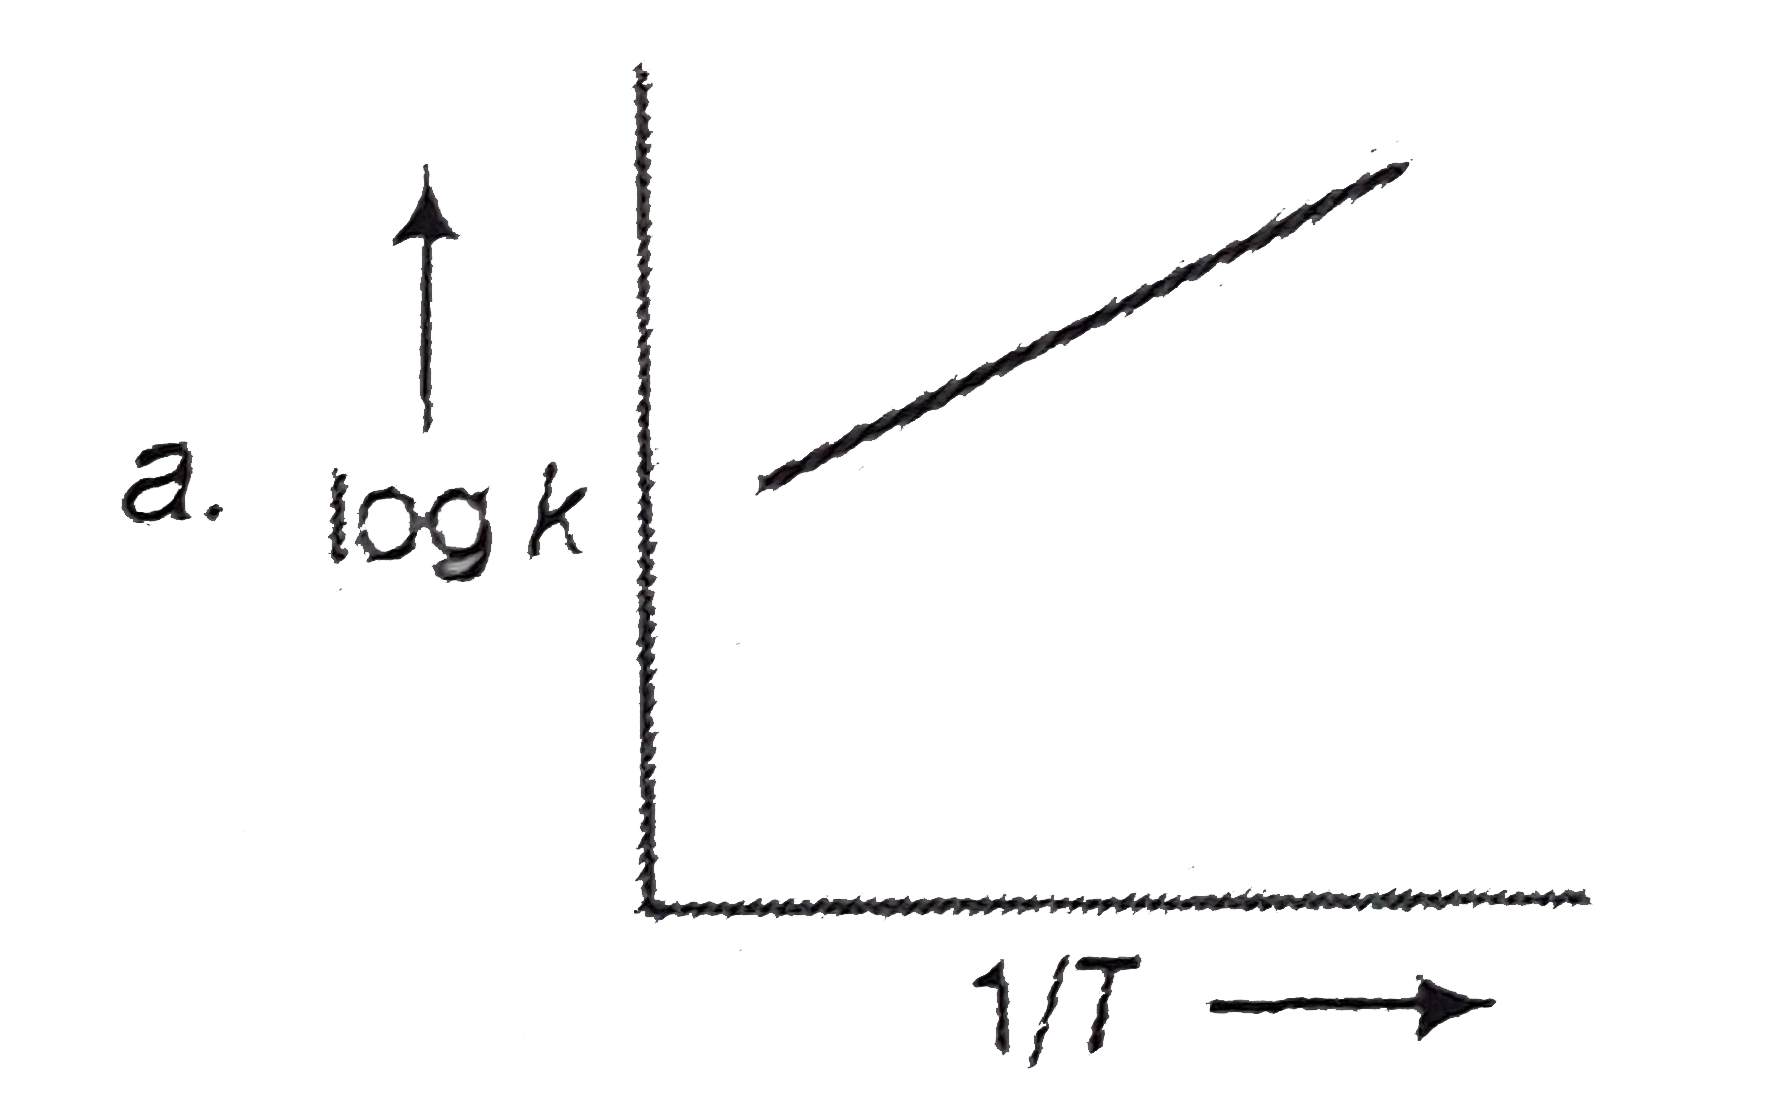 B
B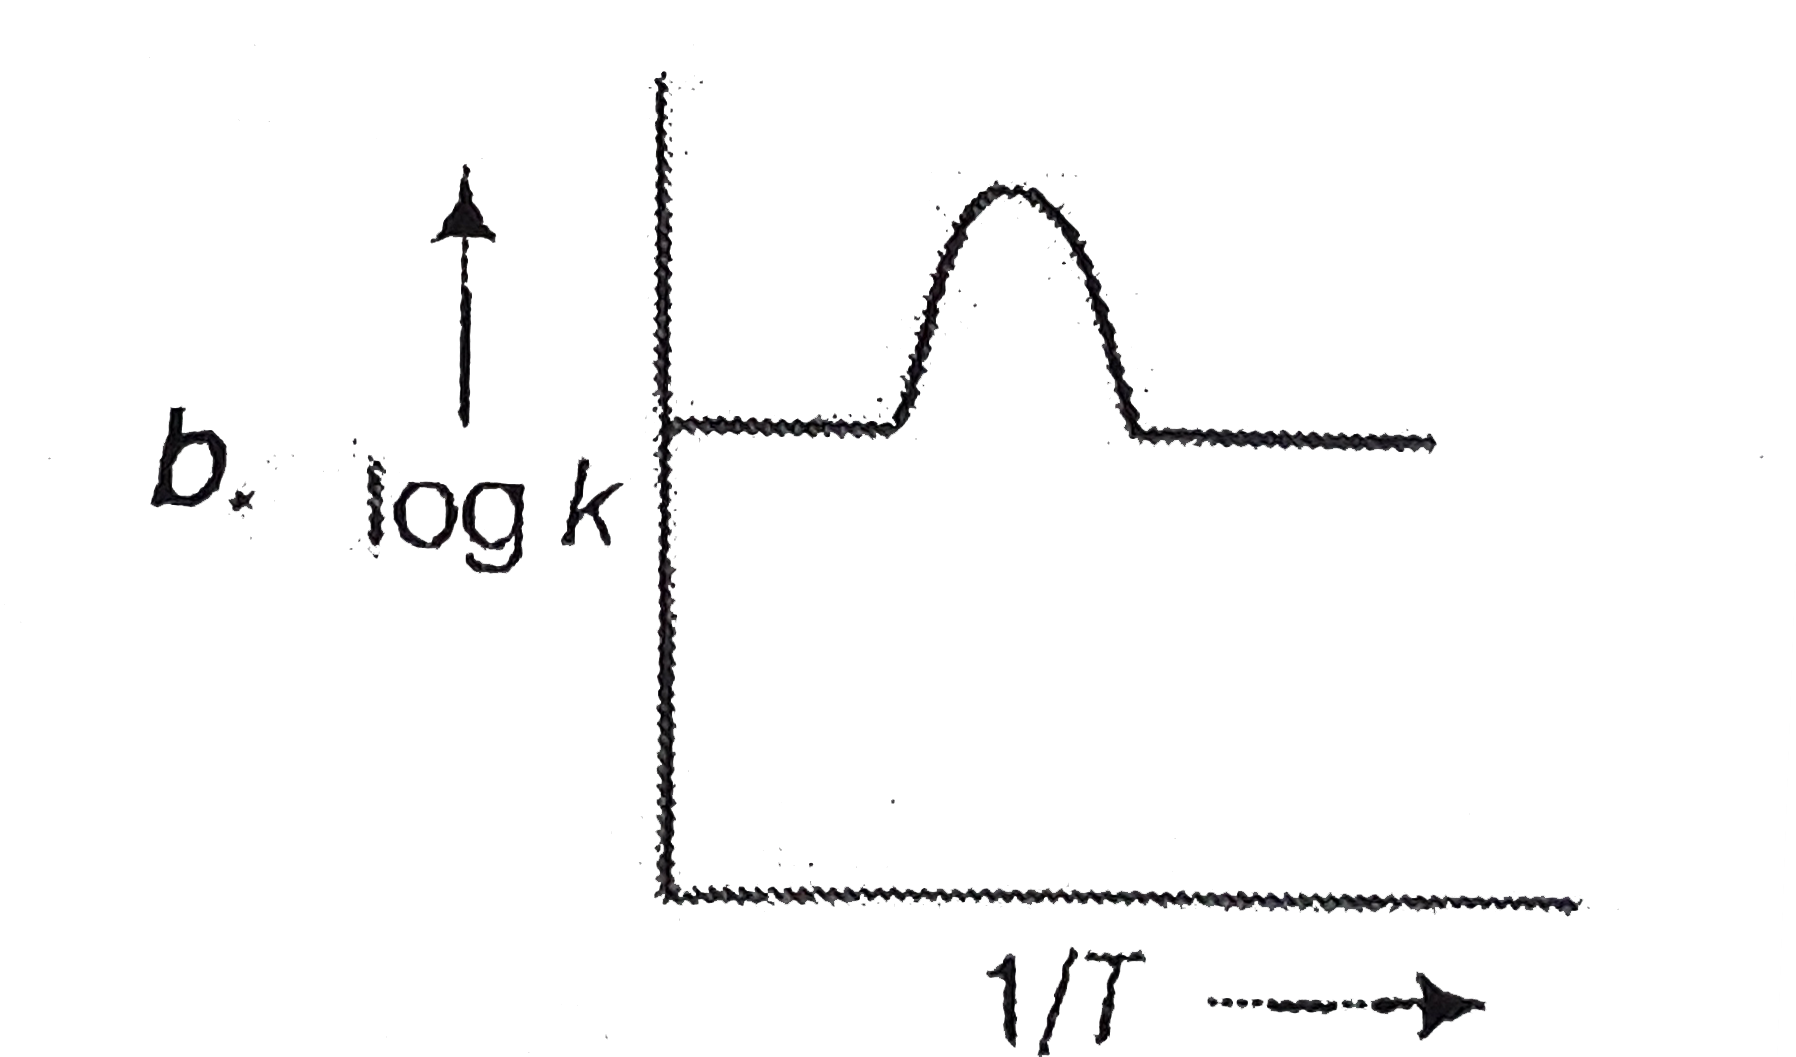 C
C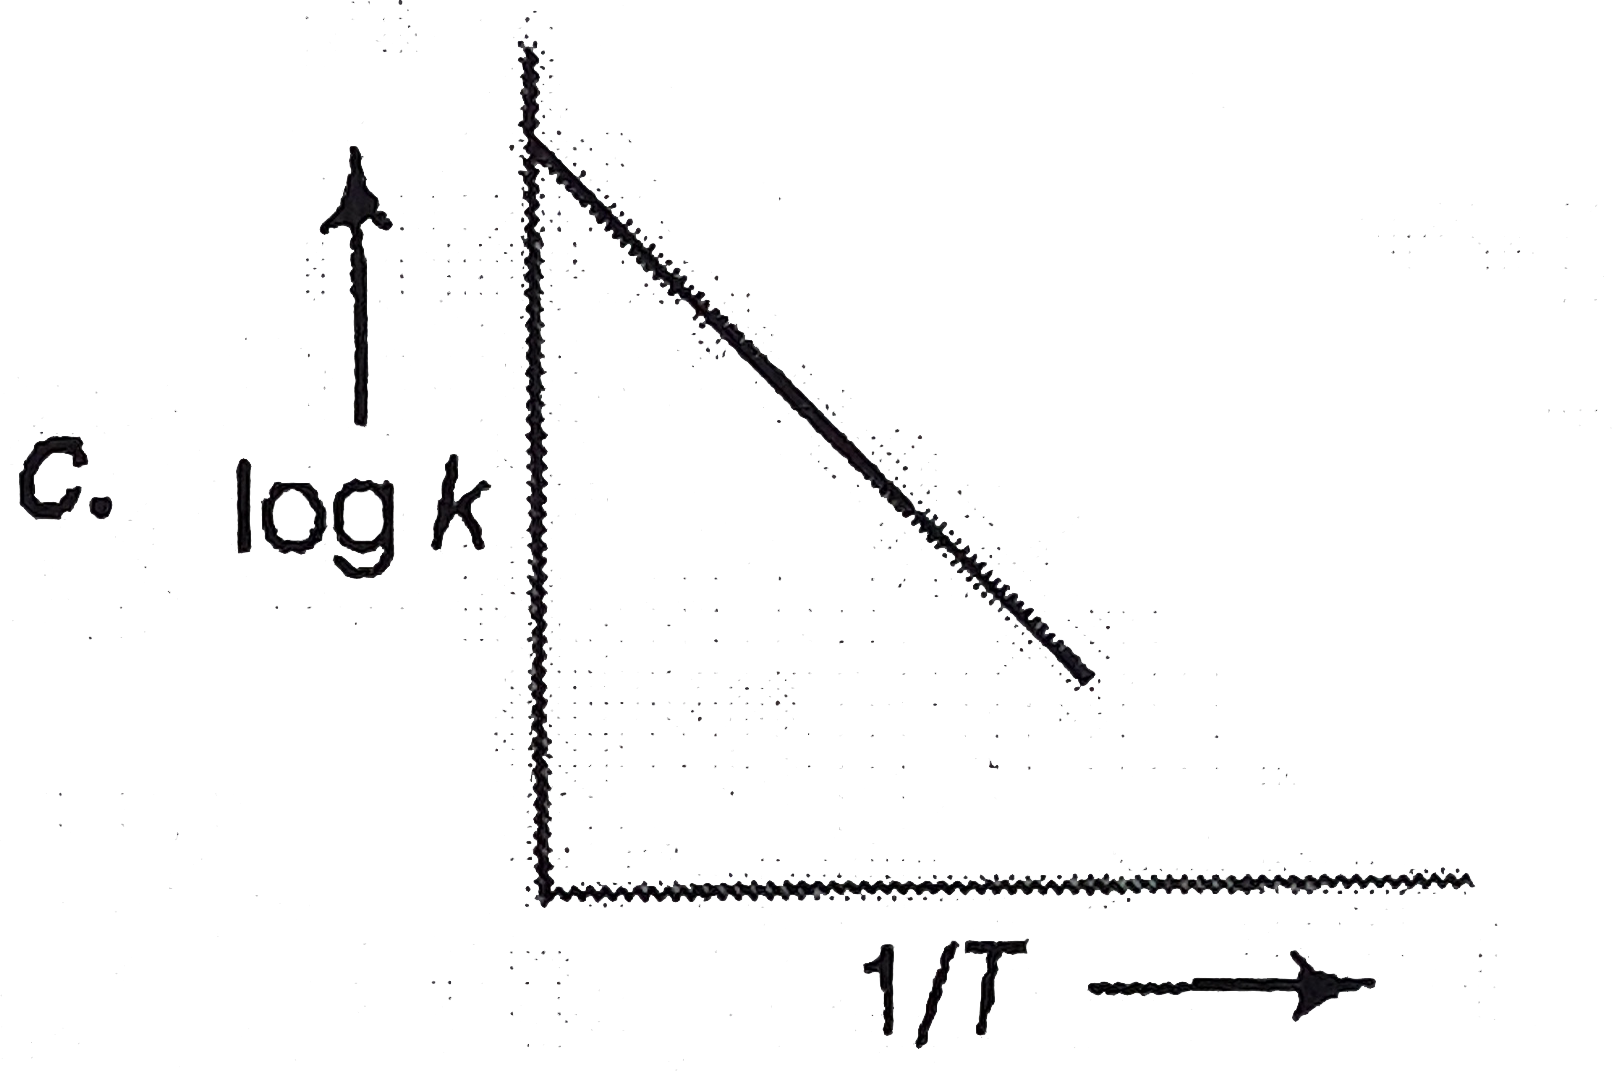 D
D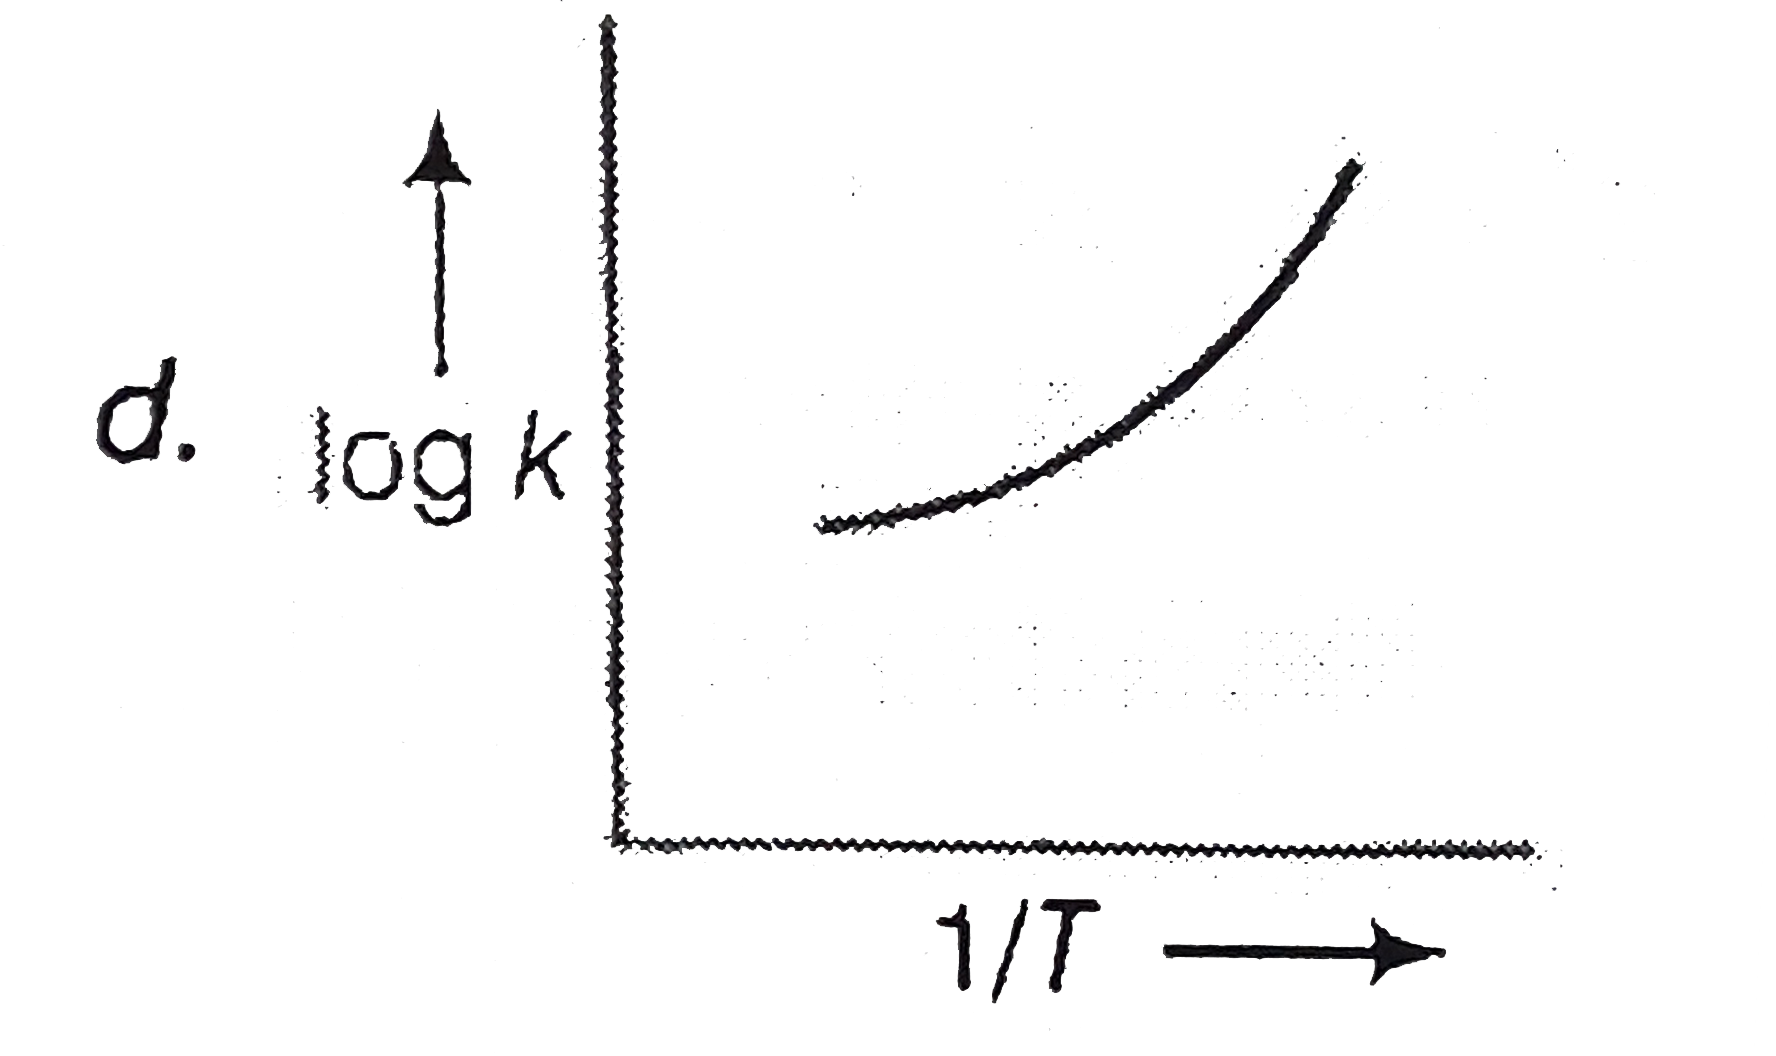
In Arrehenius equation if a graph is plotted between logK and 1/T, the slope of the curve will be:
A−EaRB−Ea2.303RCEaRDEa2.303RIn Arrhenius plot, intercept is equal to
A−Ea/RBlnAClnKDlog10a
At constant temperature if a graph plotted between logP and log(1V) has an intercept of unity then what will be the value of constant (k)
View SolutionFor a reaction A→ Product, a graph plotted between 1[A]2 vs time is found to be linear with slope = 0.4 and y intercept equal to 4 as shown. The rate of disapparance of A at the initial stages will be:
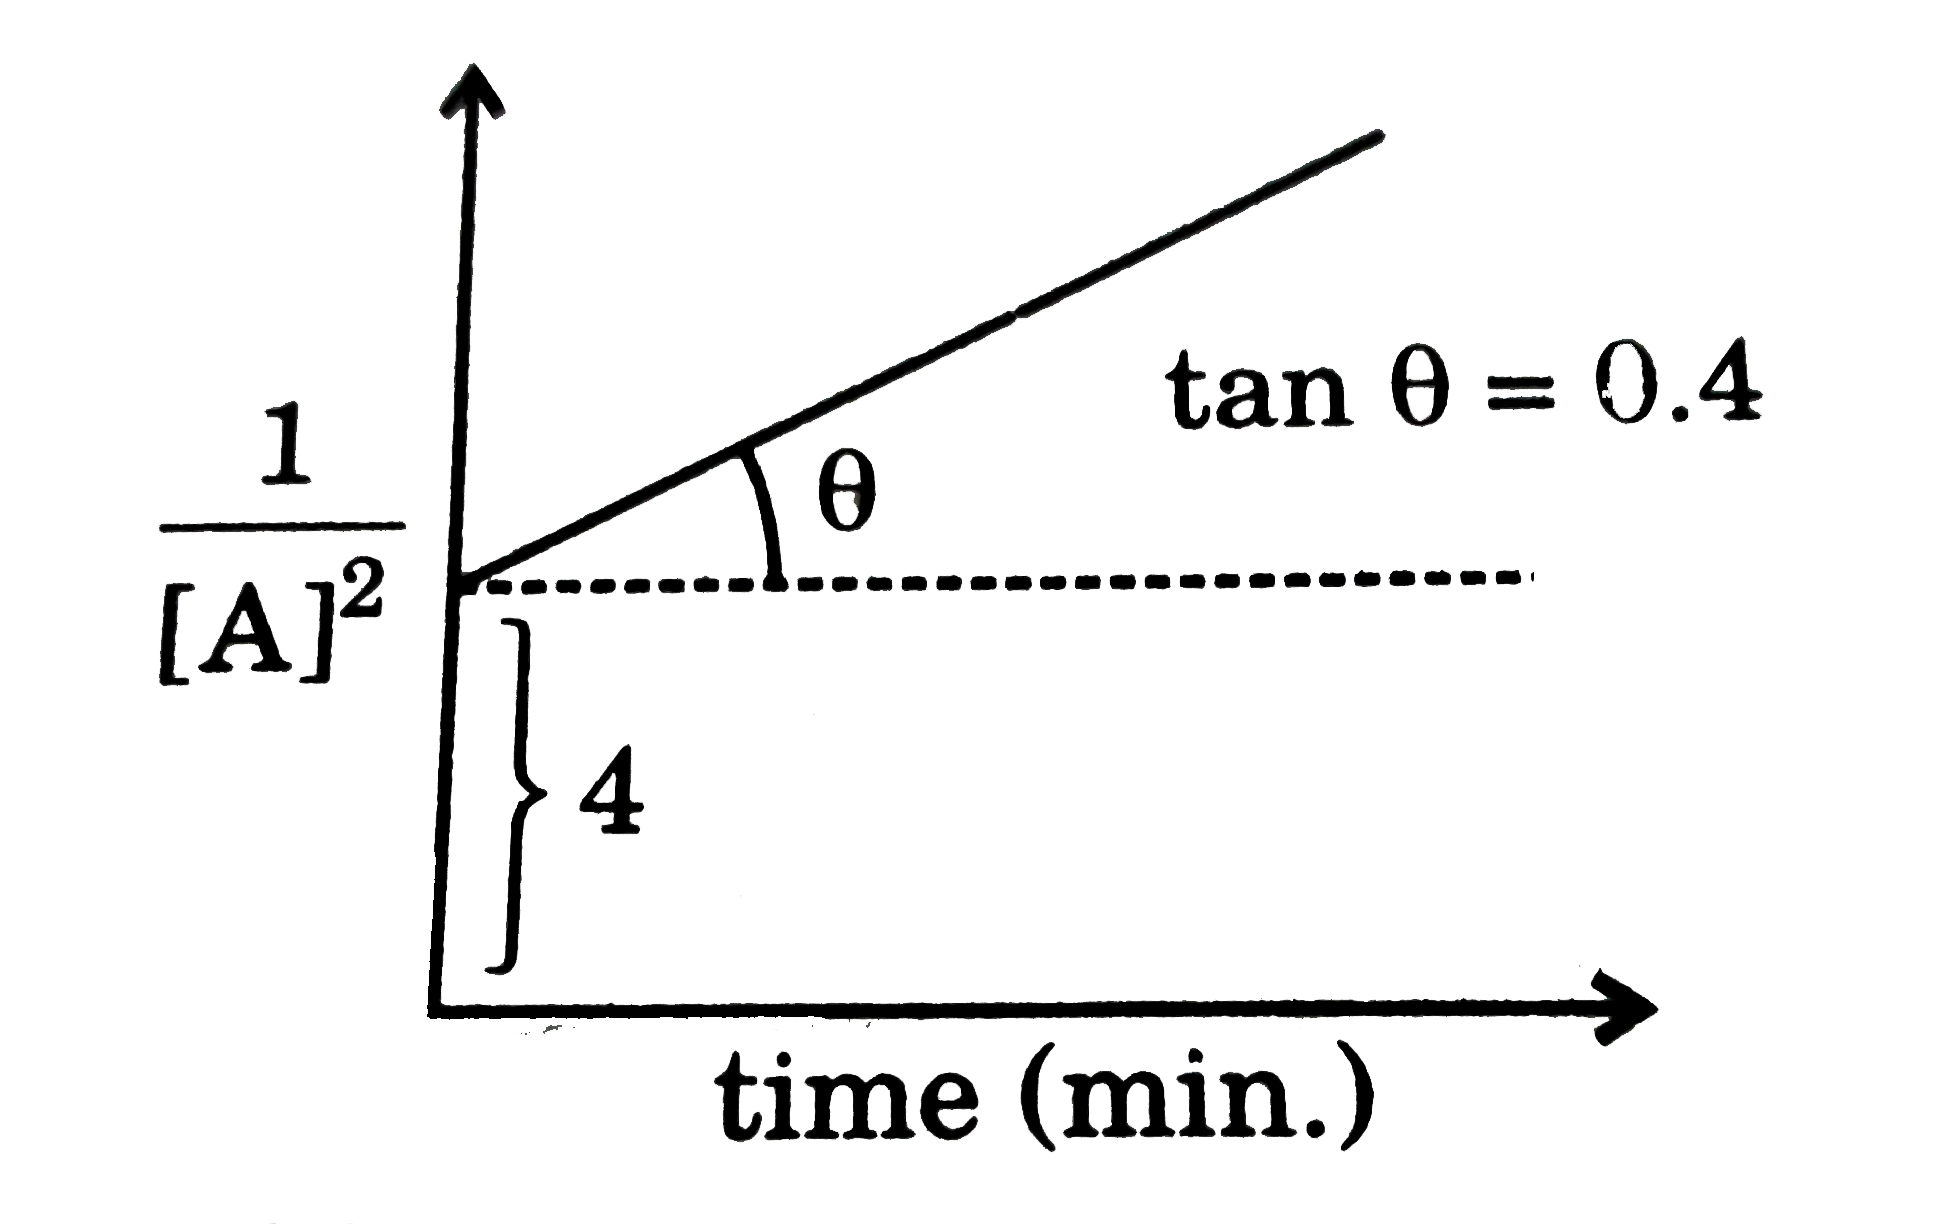
[A] is in terms of molarity
View SolutionIf a graph is plotted between log(a−x) and t, the slope of the straight line is equal to −0.03. The specific reaction rate will be
View SolutionA graph plotted between log t50% vs log concentration is a straight line. What conclusion can you draw from this graph?
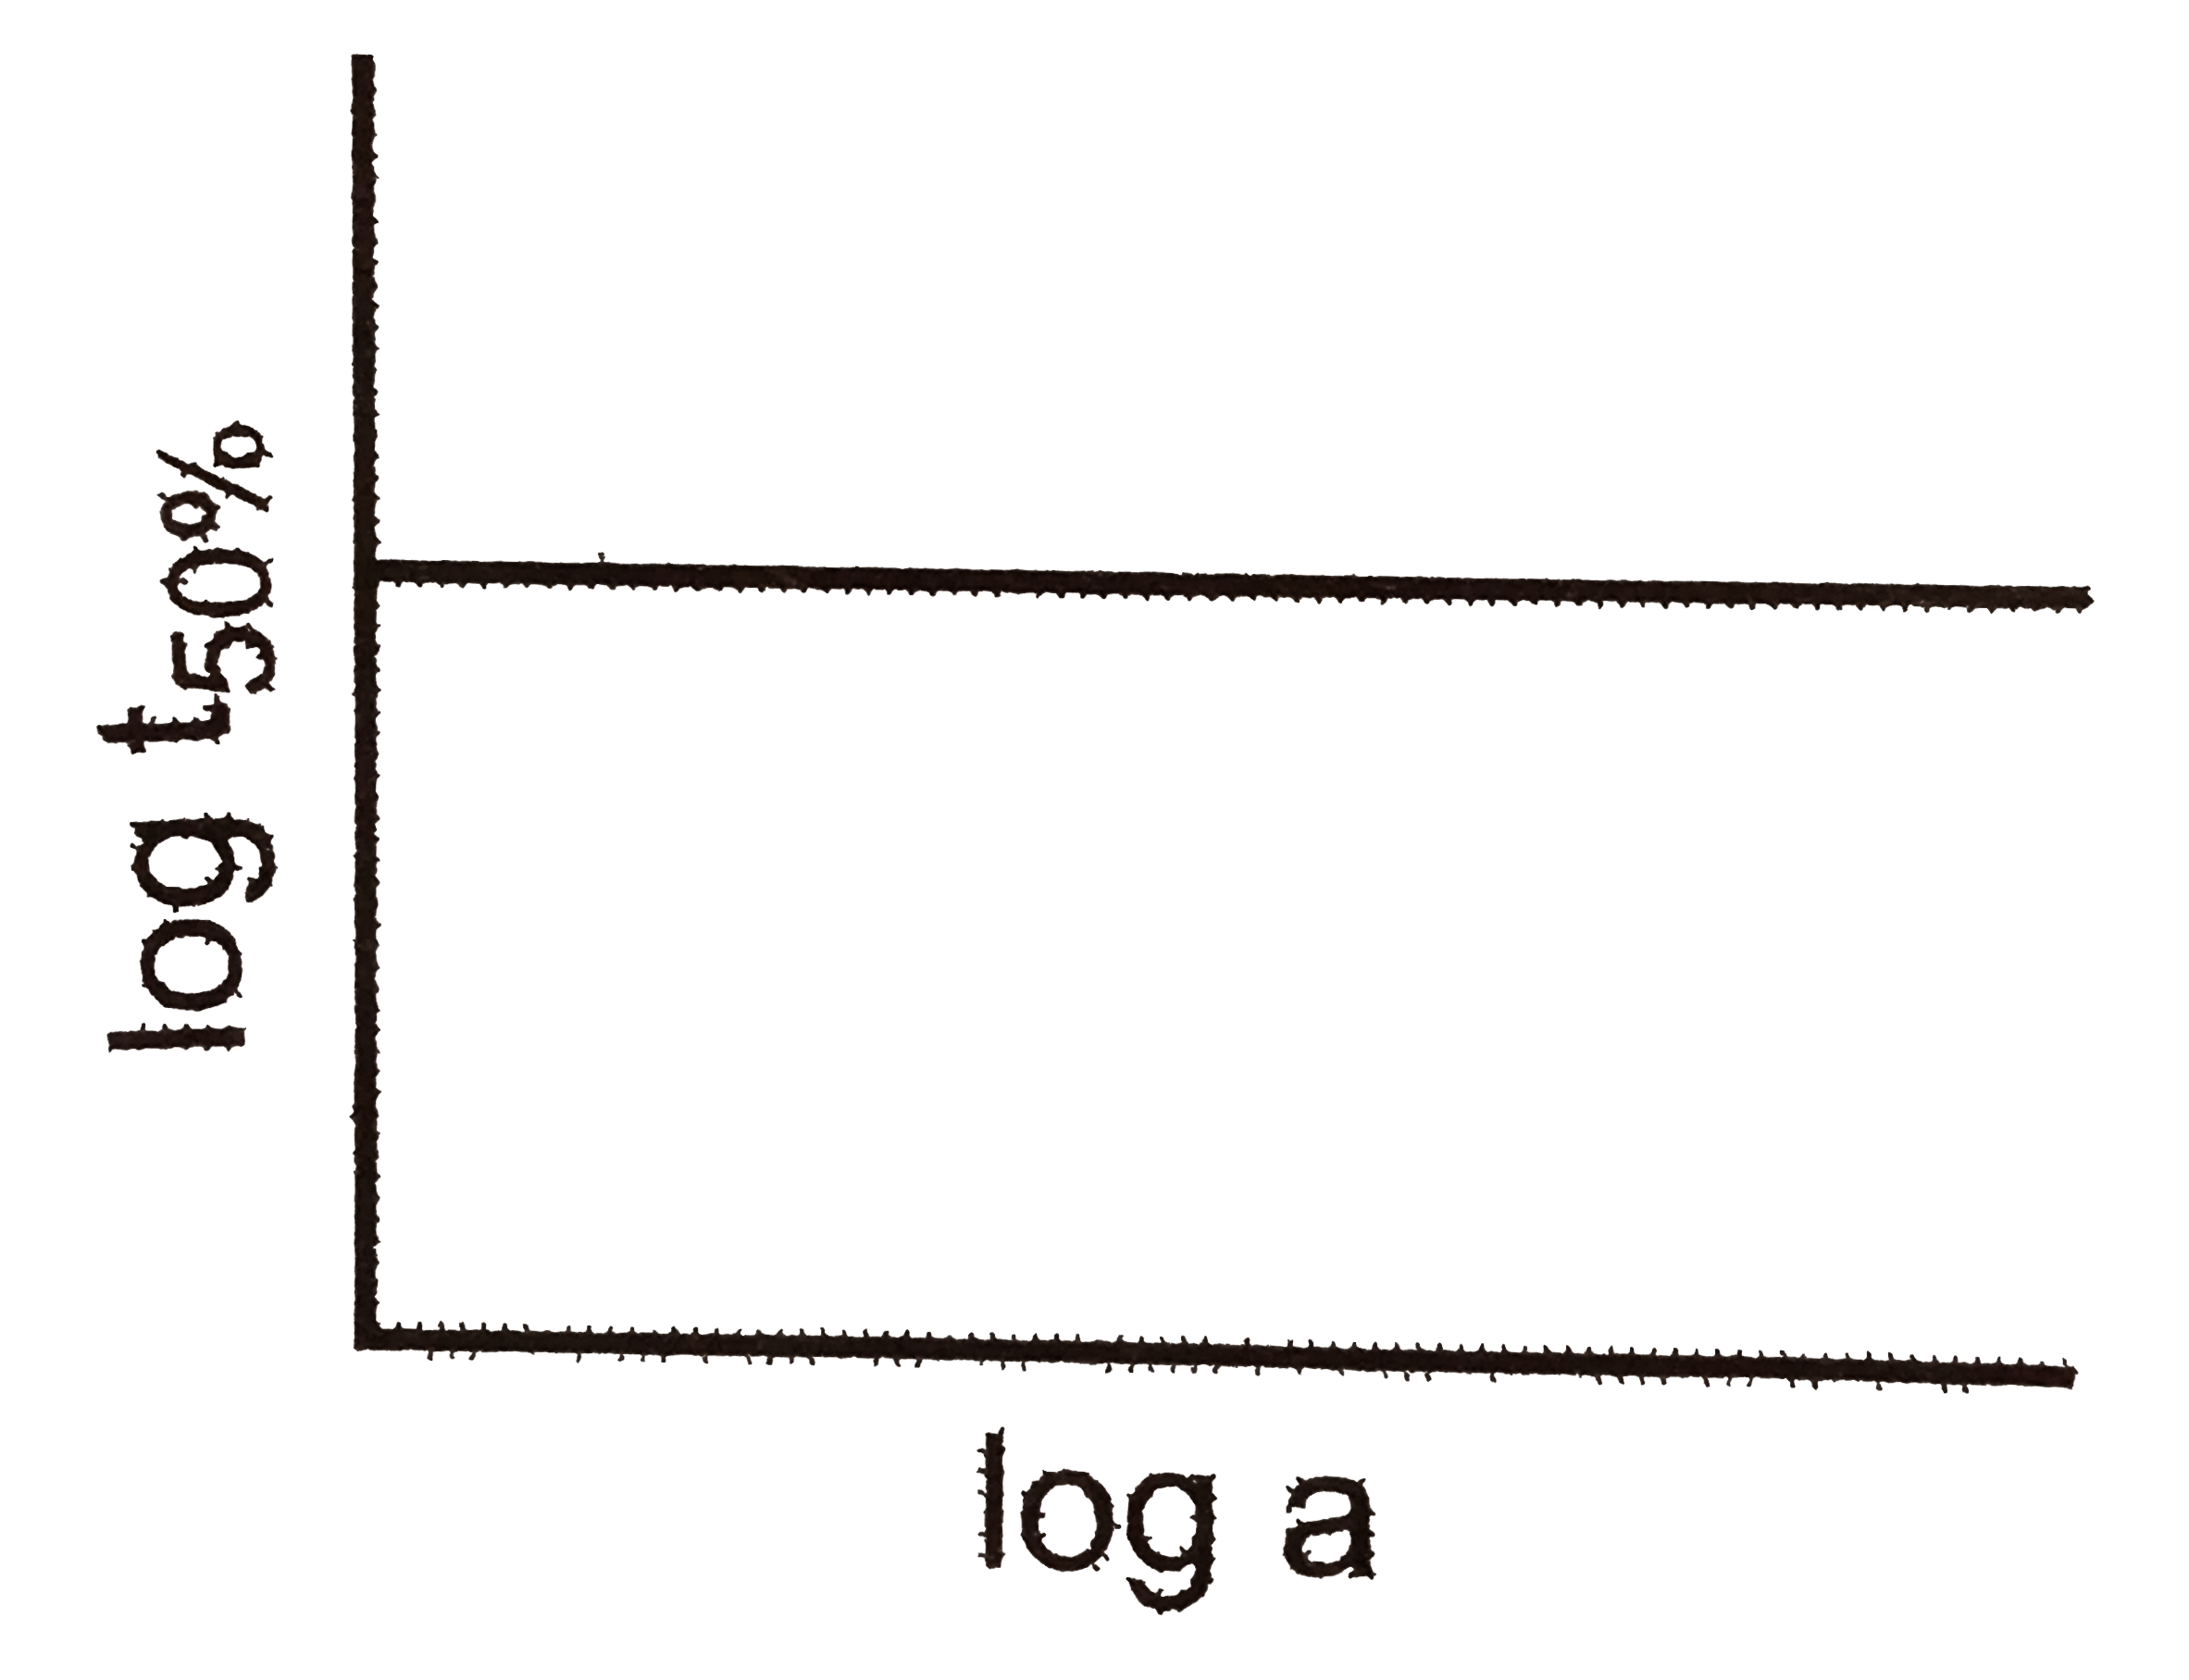
View SolutionA graph plotted between logt50% vs log concentration in a straight line. What conclusion can you draw from this graph?

View Solution

